

The Energy Situation, Explained for Tech People
There is no failover for the Strait of Hormuz


America | Tech | Opinion | Culture | Charts
Michael Spyker returns to a16z news! Last November Michael wrote a great two-part series that gave tech founders and investors a primer on all things natural gas. Today he explains everything we need to know about the energy crisis unfolding every day the Strait of Hormuz remains closed. Enjoy:

Think of it like this. The Persian Gulf is the us-east-1 of the global energy trade, and the Strait of Hormuz is the most critical global energy dependency. The consequences of a prolonged closure are not limited to higher gasoline prices; with enough time the pain will cascade into food, freight, fertilizer, petrochemicals, power, manufacturing, and eventually political stability.
Tech people understand hidden centralization better than almost anyone. A stale DNS record, a busted base image, secrets that weren’t rotated; a single failure can bring a ‘distributed’ stack to its knees overnight. That’s more or less where we are today with global energy markets. There is no failover for the Strait of Hormuz.
Entrenched
In a perfect world, nobody would consider the world’s reliance on energy produced in the Middle East to be a strategic oversight. By most metrics, it was a prudent global capital allocation decision in a vacuum.
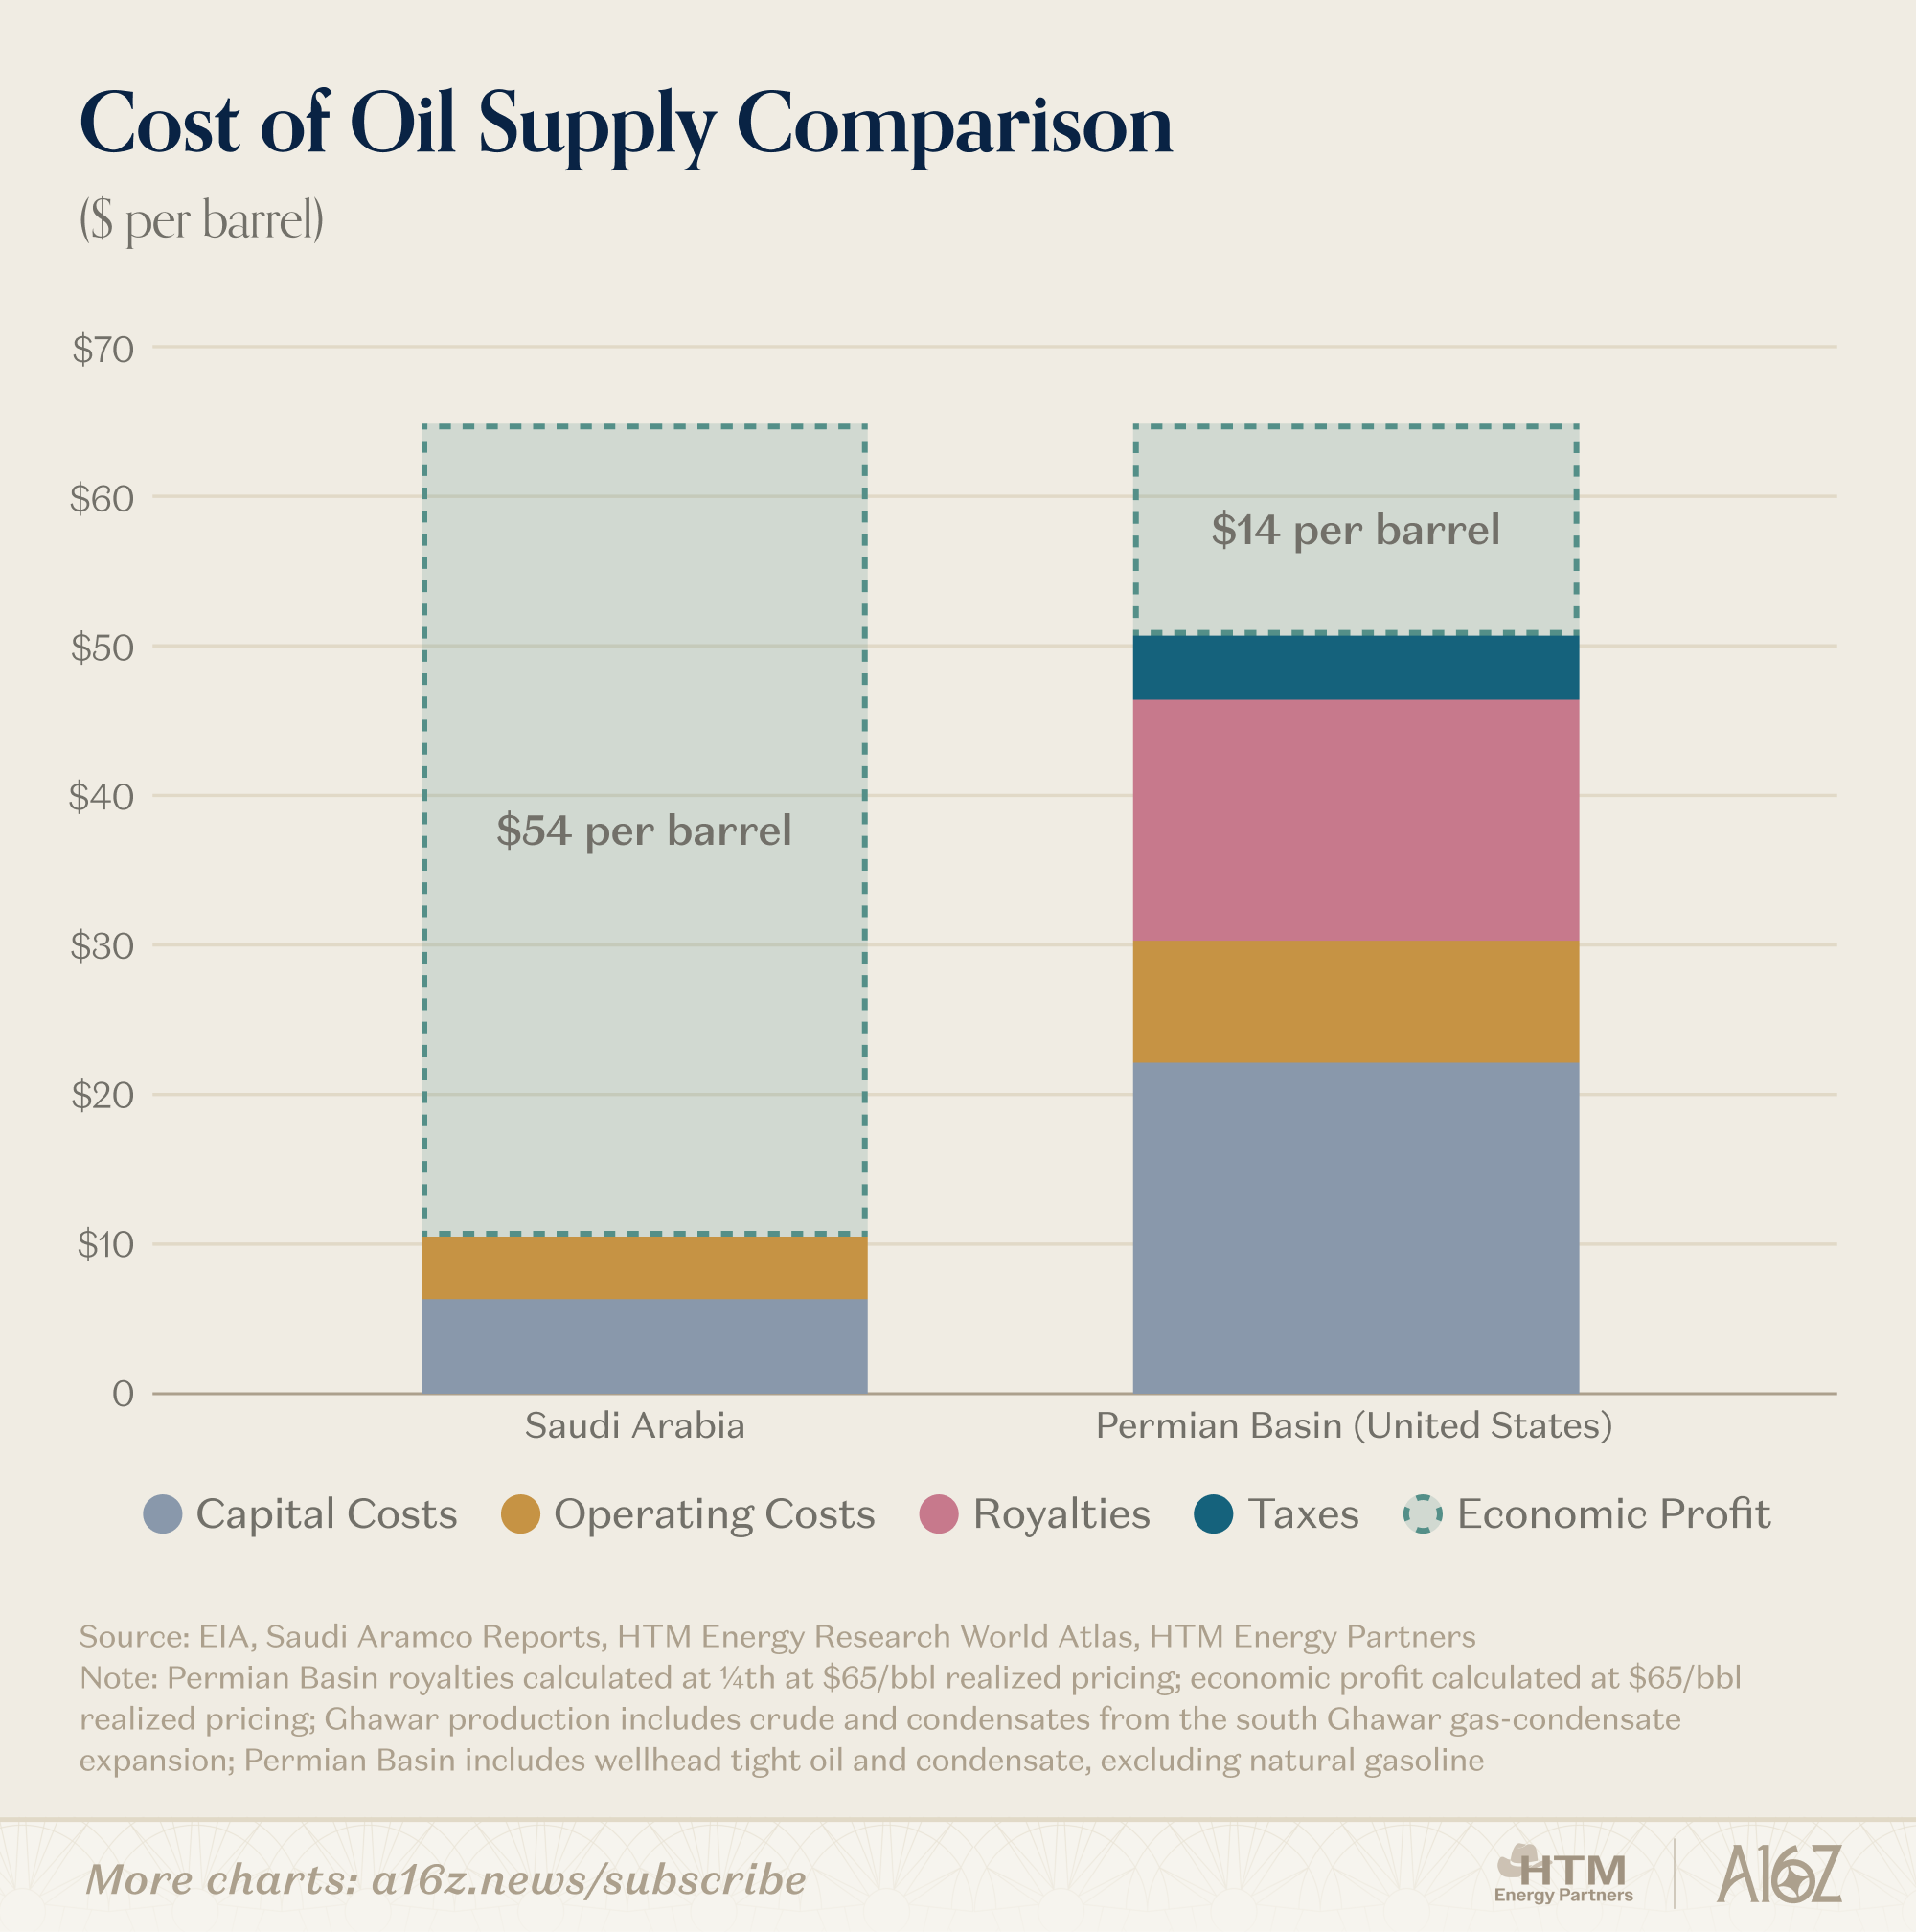
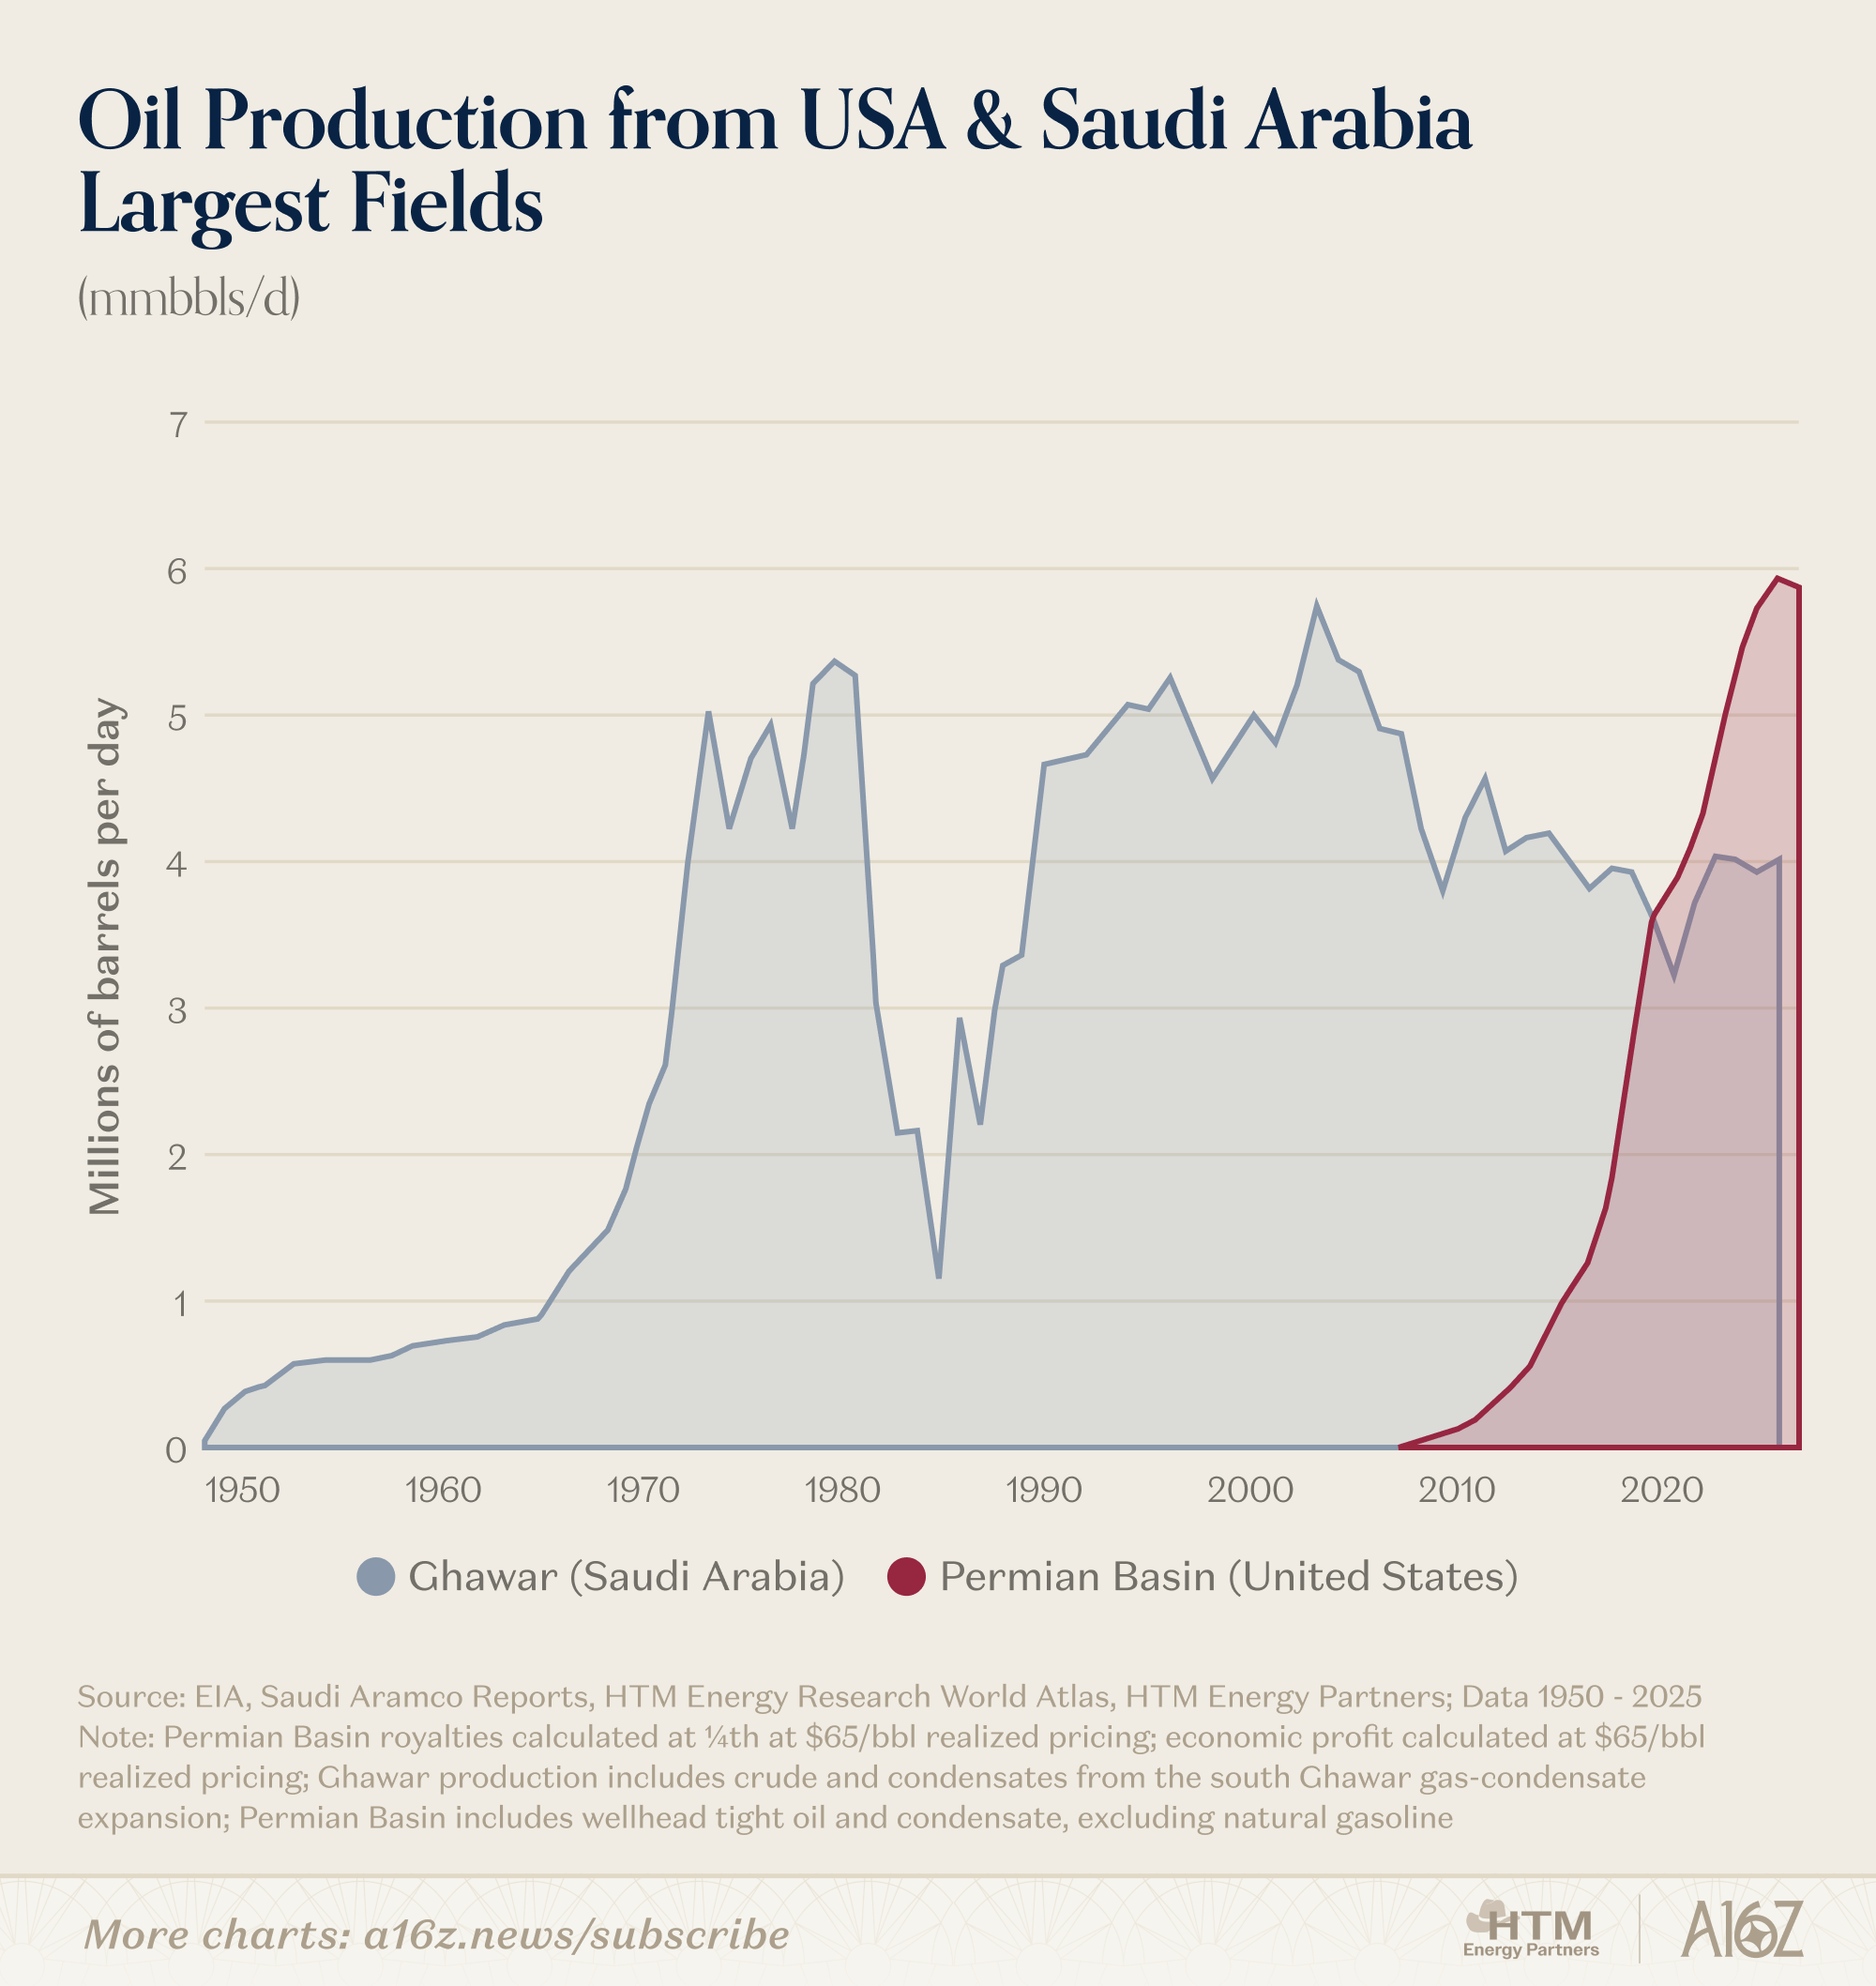
A good shale well in the Permian Basin in Texas may recover about 0.5 million barrels of oil (mmbbls), while a strong well into Saudi Arabia’s largest oil field (Ghawar) can recover 100 mmbbls or more. The Middle East’s geology is uniquely advantaged; massive conventional oil accumulations that are highly overpressured and simple to produce have resulted in to the most prolific oil fields in the world.
Oil produced in the Middle East is some of the lowest cost on earth, and government ownership over the resource means their economic profits, which are ultimately used to fund their fiscal budgets, are far higher than the economic profits generated from a typical US shale well on a per-barrel basis (if the US producers generate any profit at all).
But a slightly higher breakeven didn’t stop the United States from taking the Permian Basin from zero, to outclassing Saudi Arabia’s crown jewel within a decade. When people say “shale was a massive net benefit to society”; this is what they mean. The US added millions of barrels per day of oil production that really shouldn’t have been “next in line” – all facilitated by the unmatched risk appetite of the American capital markets.
If we rewind to the 1970s (it’s important), we’d find ourselves at the founding of the Saudi Basic Industries Corporation. It was then that the Persian Gulf States began to appreciate the need to focus on monetizing the entire molecular value chain. This was accelerated by the 1998 oil price crash which made it viscerally clear that downstream integration was important for fiscal survival.
When China’s demand for conventional energy began to grow in the early-2000s, the Gulf States answered. Selling plastics feedstock to China allowed the Gulf to diversify their commodity exposure, but it made Asia reliant on Middle Eastern crude and liquids (spoiler: this eventually comes full circle). As China and Asia developed industrially, their refineries became reliant on, if not specifically designed to ingest Middle Eastern grades of oil. This was a symbiotic relationship – when refined, the finished product basket of Middle Eastern crude almost exactly matched the demand profile of local markets.
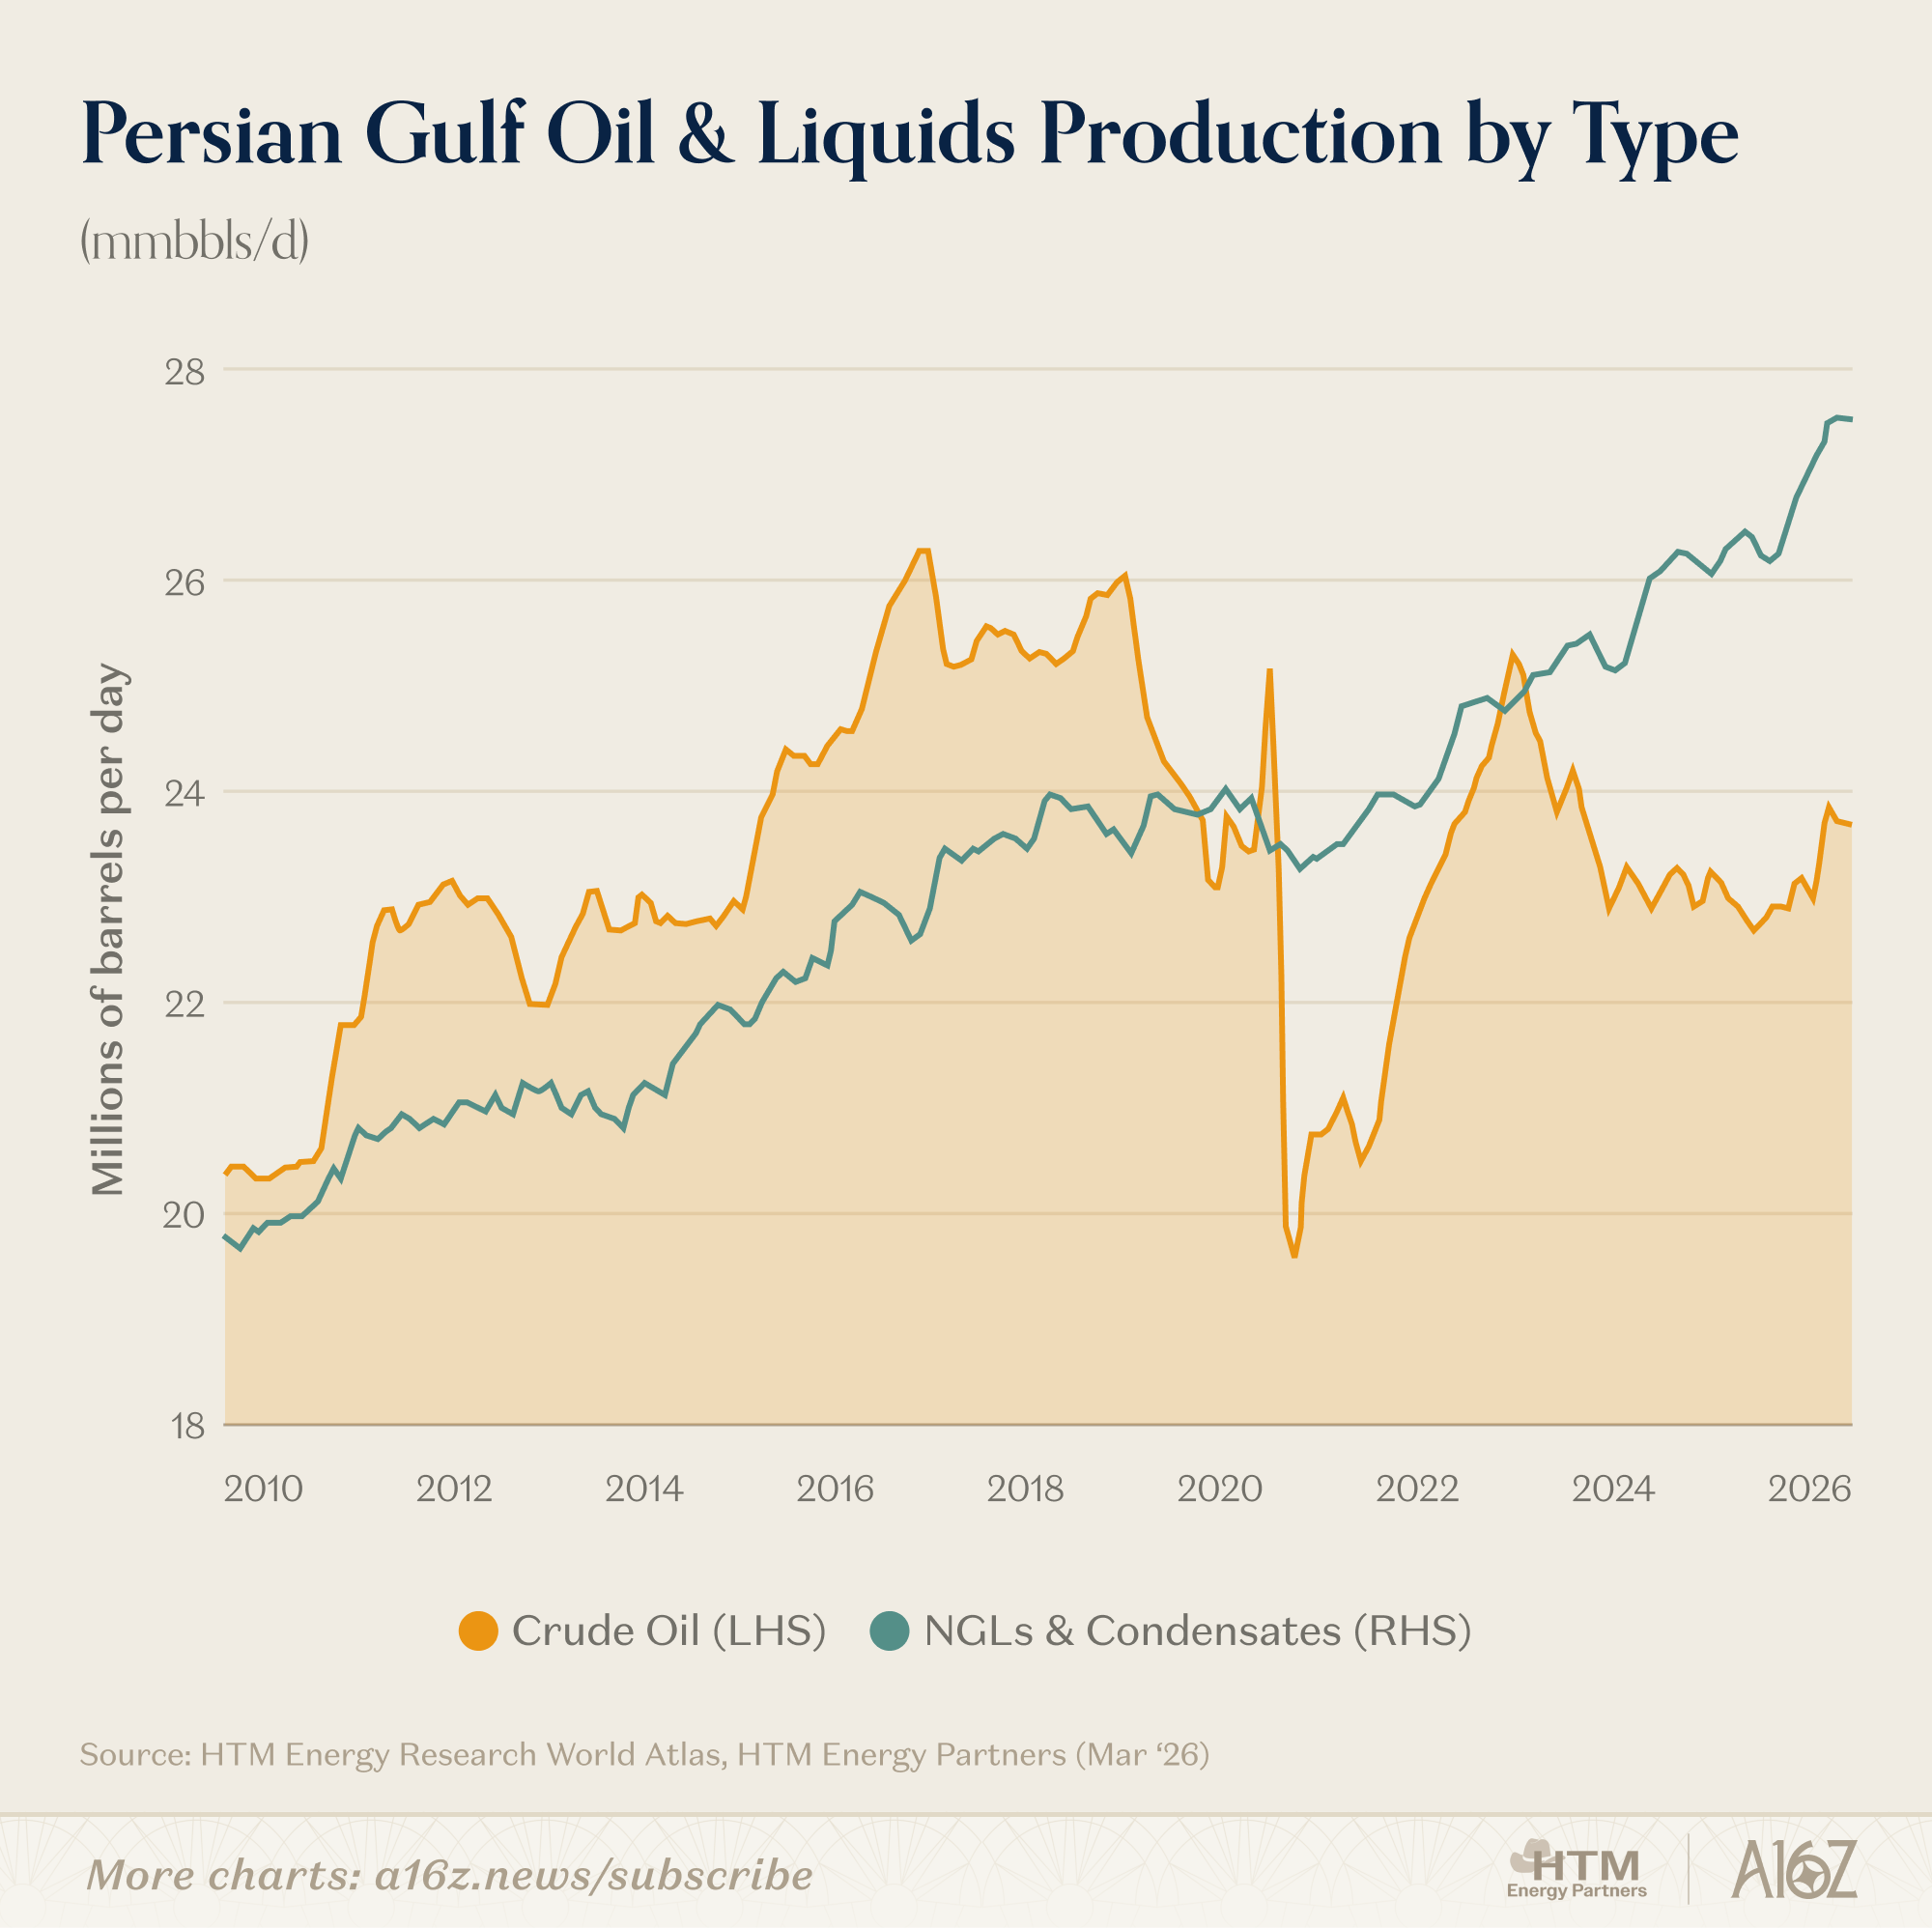
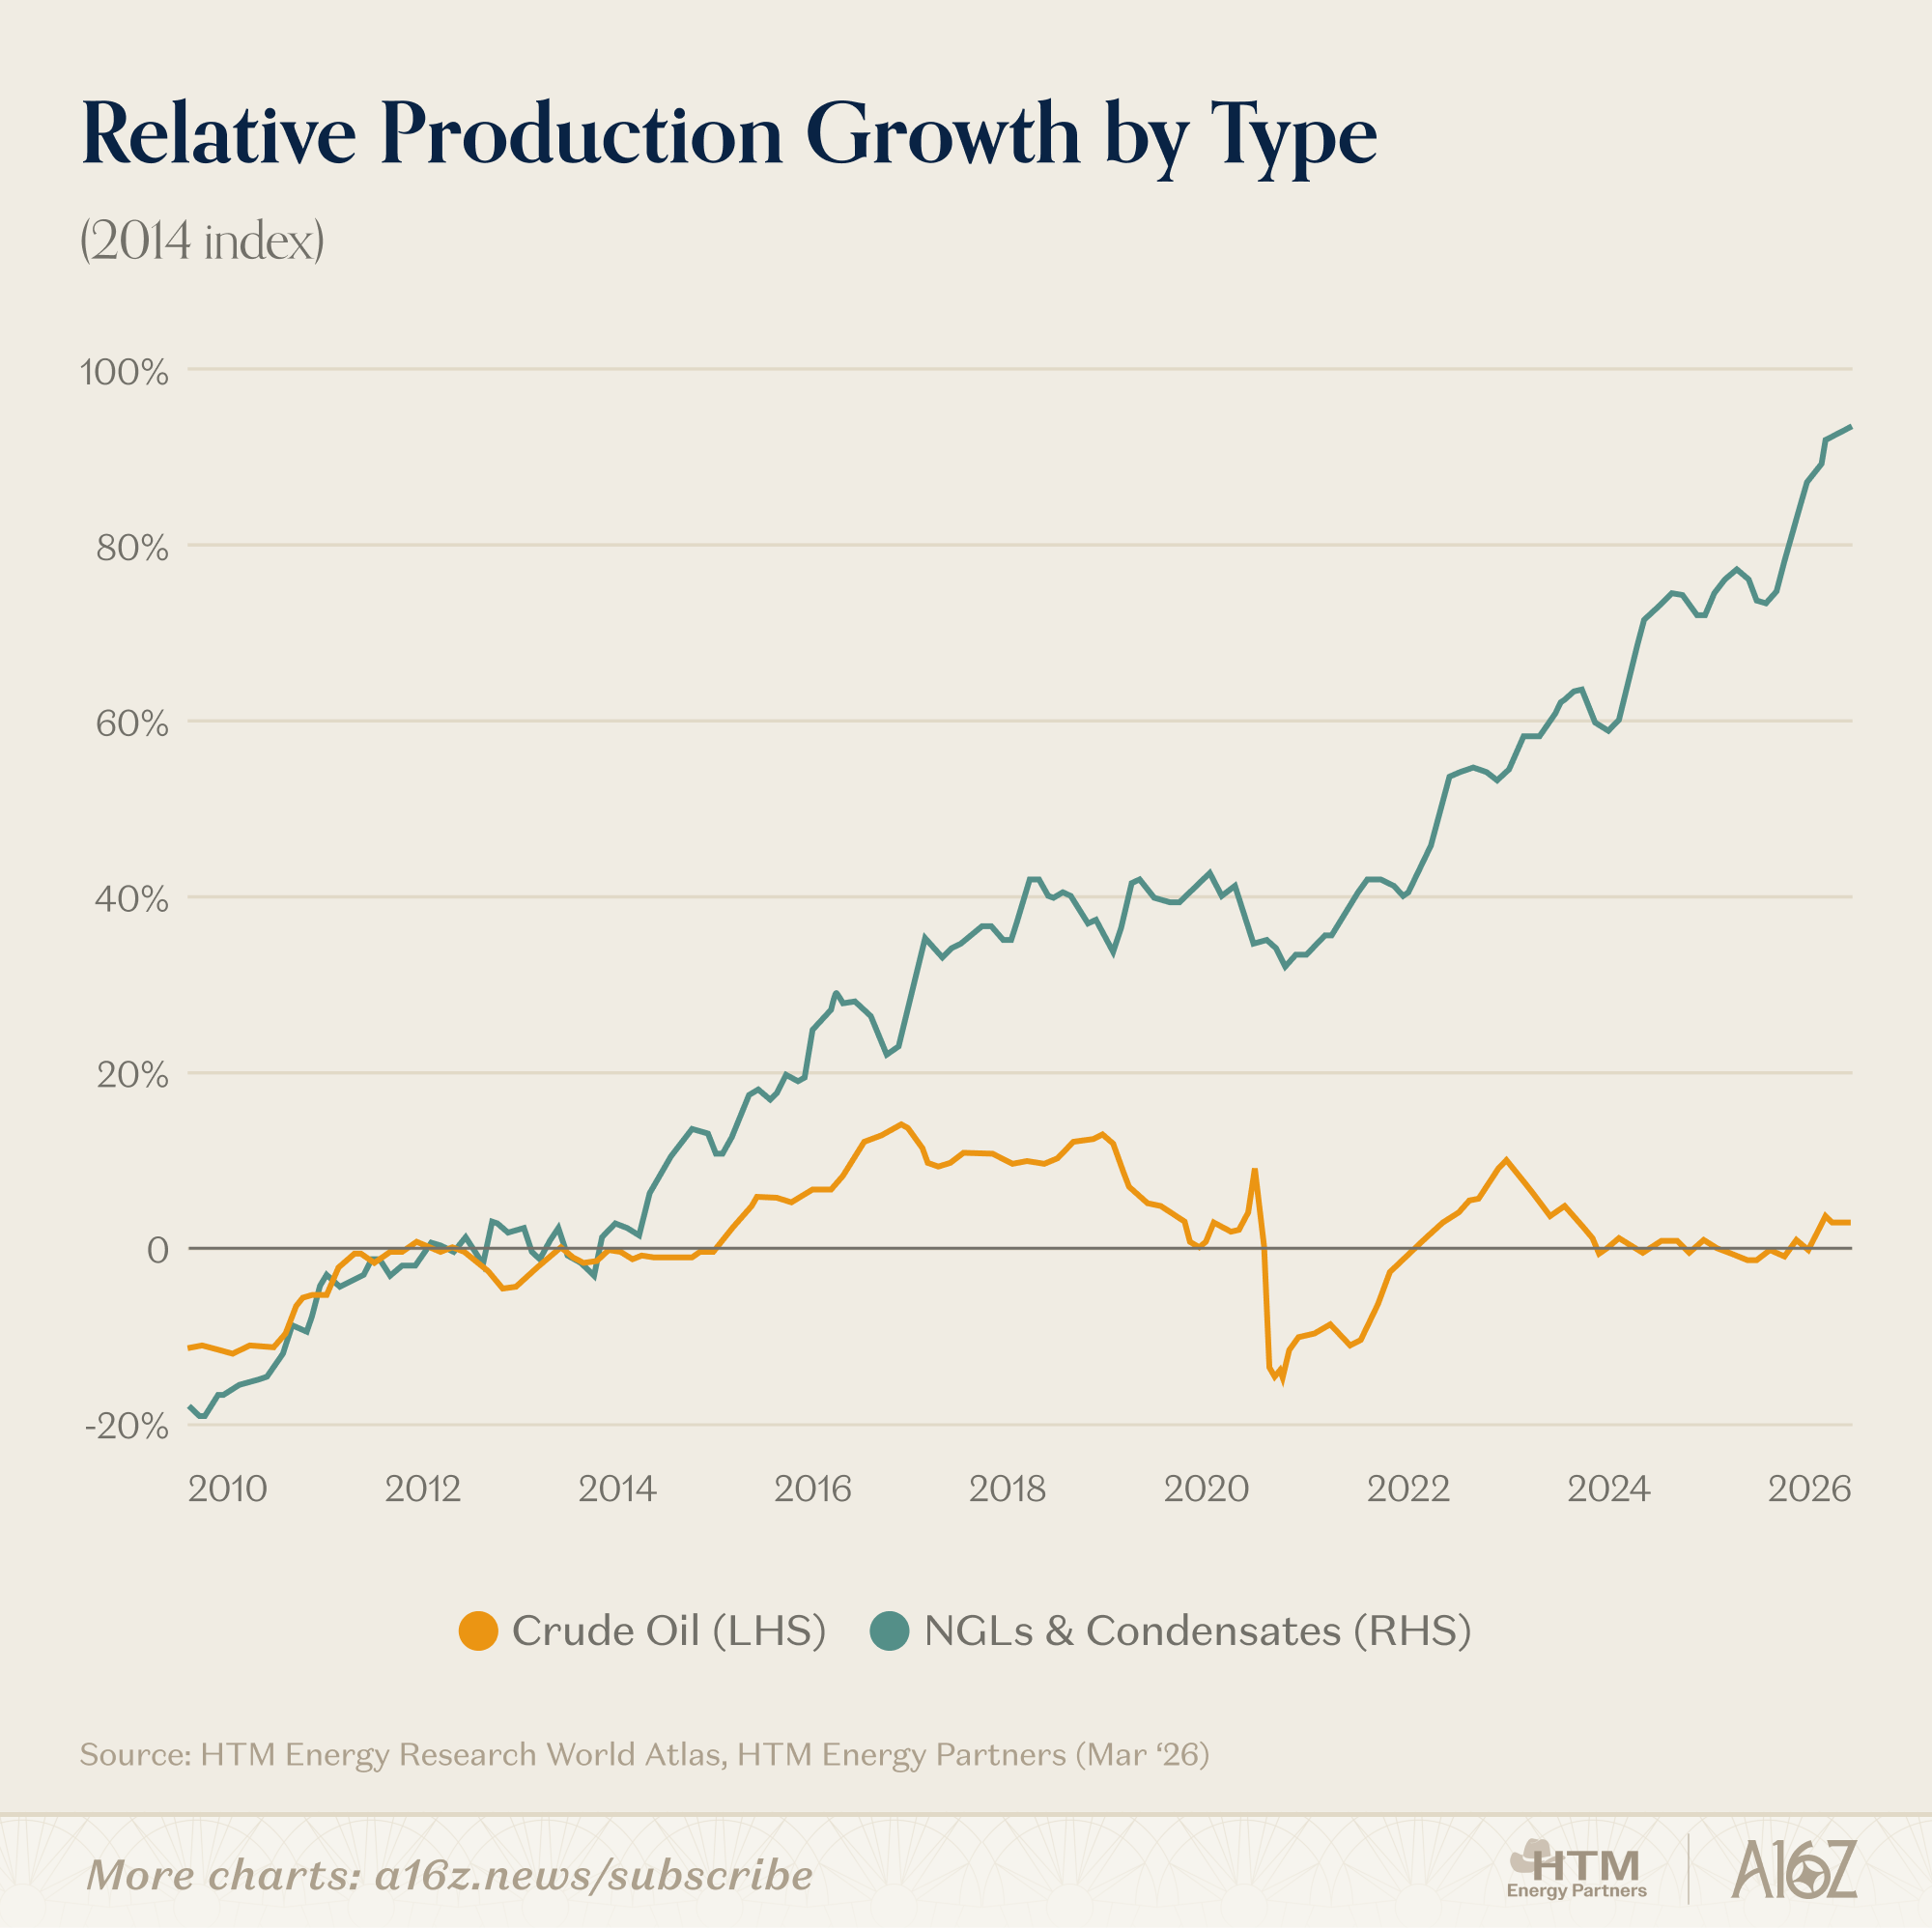
As Asia’s industrial buildout matured, US shale entered the scene, and its rapid production growth only sharpened the Gulf’s strategic imperative. If the US could flood the market with light sweet crude, the Gulf States would have to become more calculated. The Gulf countries needed to convert their hydrocarbons into whatever the world was short of – and leverage their scale and cost advantage to become reliable suppliers of those molecules.
All this resulted in Gulf Countries growing their LNG, LPG & condensate volumes, over brute-force raw crude. These lighter hydrocarbons find their way into India where LPG is widely used as a cooking fuel, Singapore where condensate is split into aviation fuel and plastics feedstock, South Korea where condensates are turned into specialty textiles, and even Taiwan where ~15% of their power grid is fueled with Qatari LNG. These are deep, hard to break, and not “pauseable” dependencies. For 55 days a year, Taiwan keeps its lights on thanks to Qatar. 400 million Indians use LPG to cook dinner every night. In Japan the taxi cab fleet runs on Middle Eastern autogas.
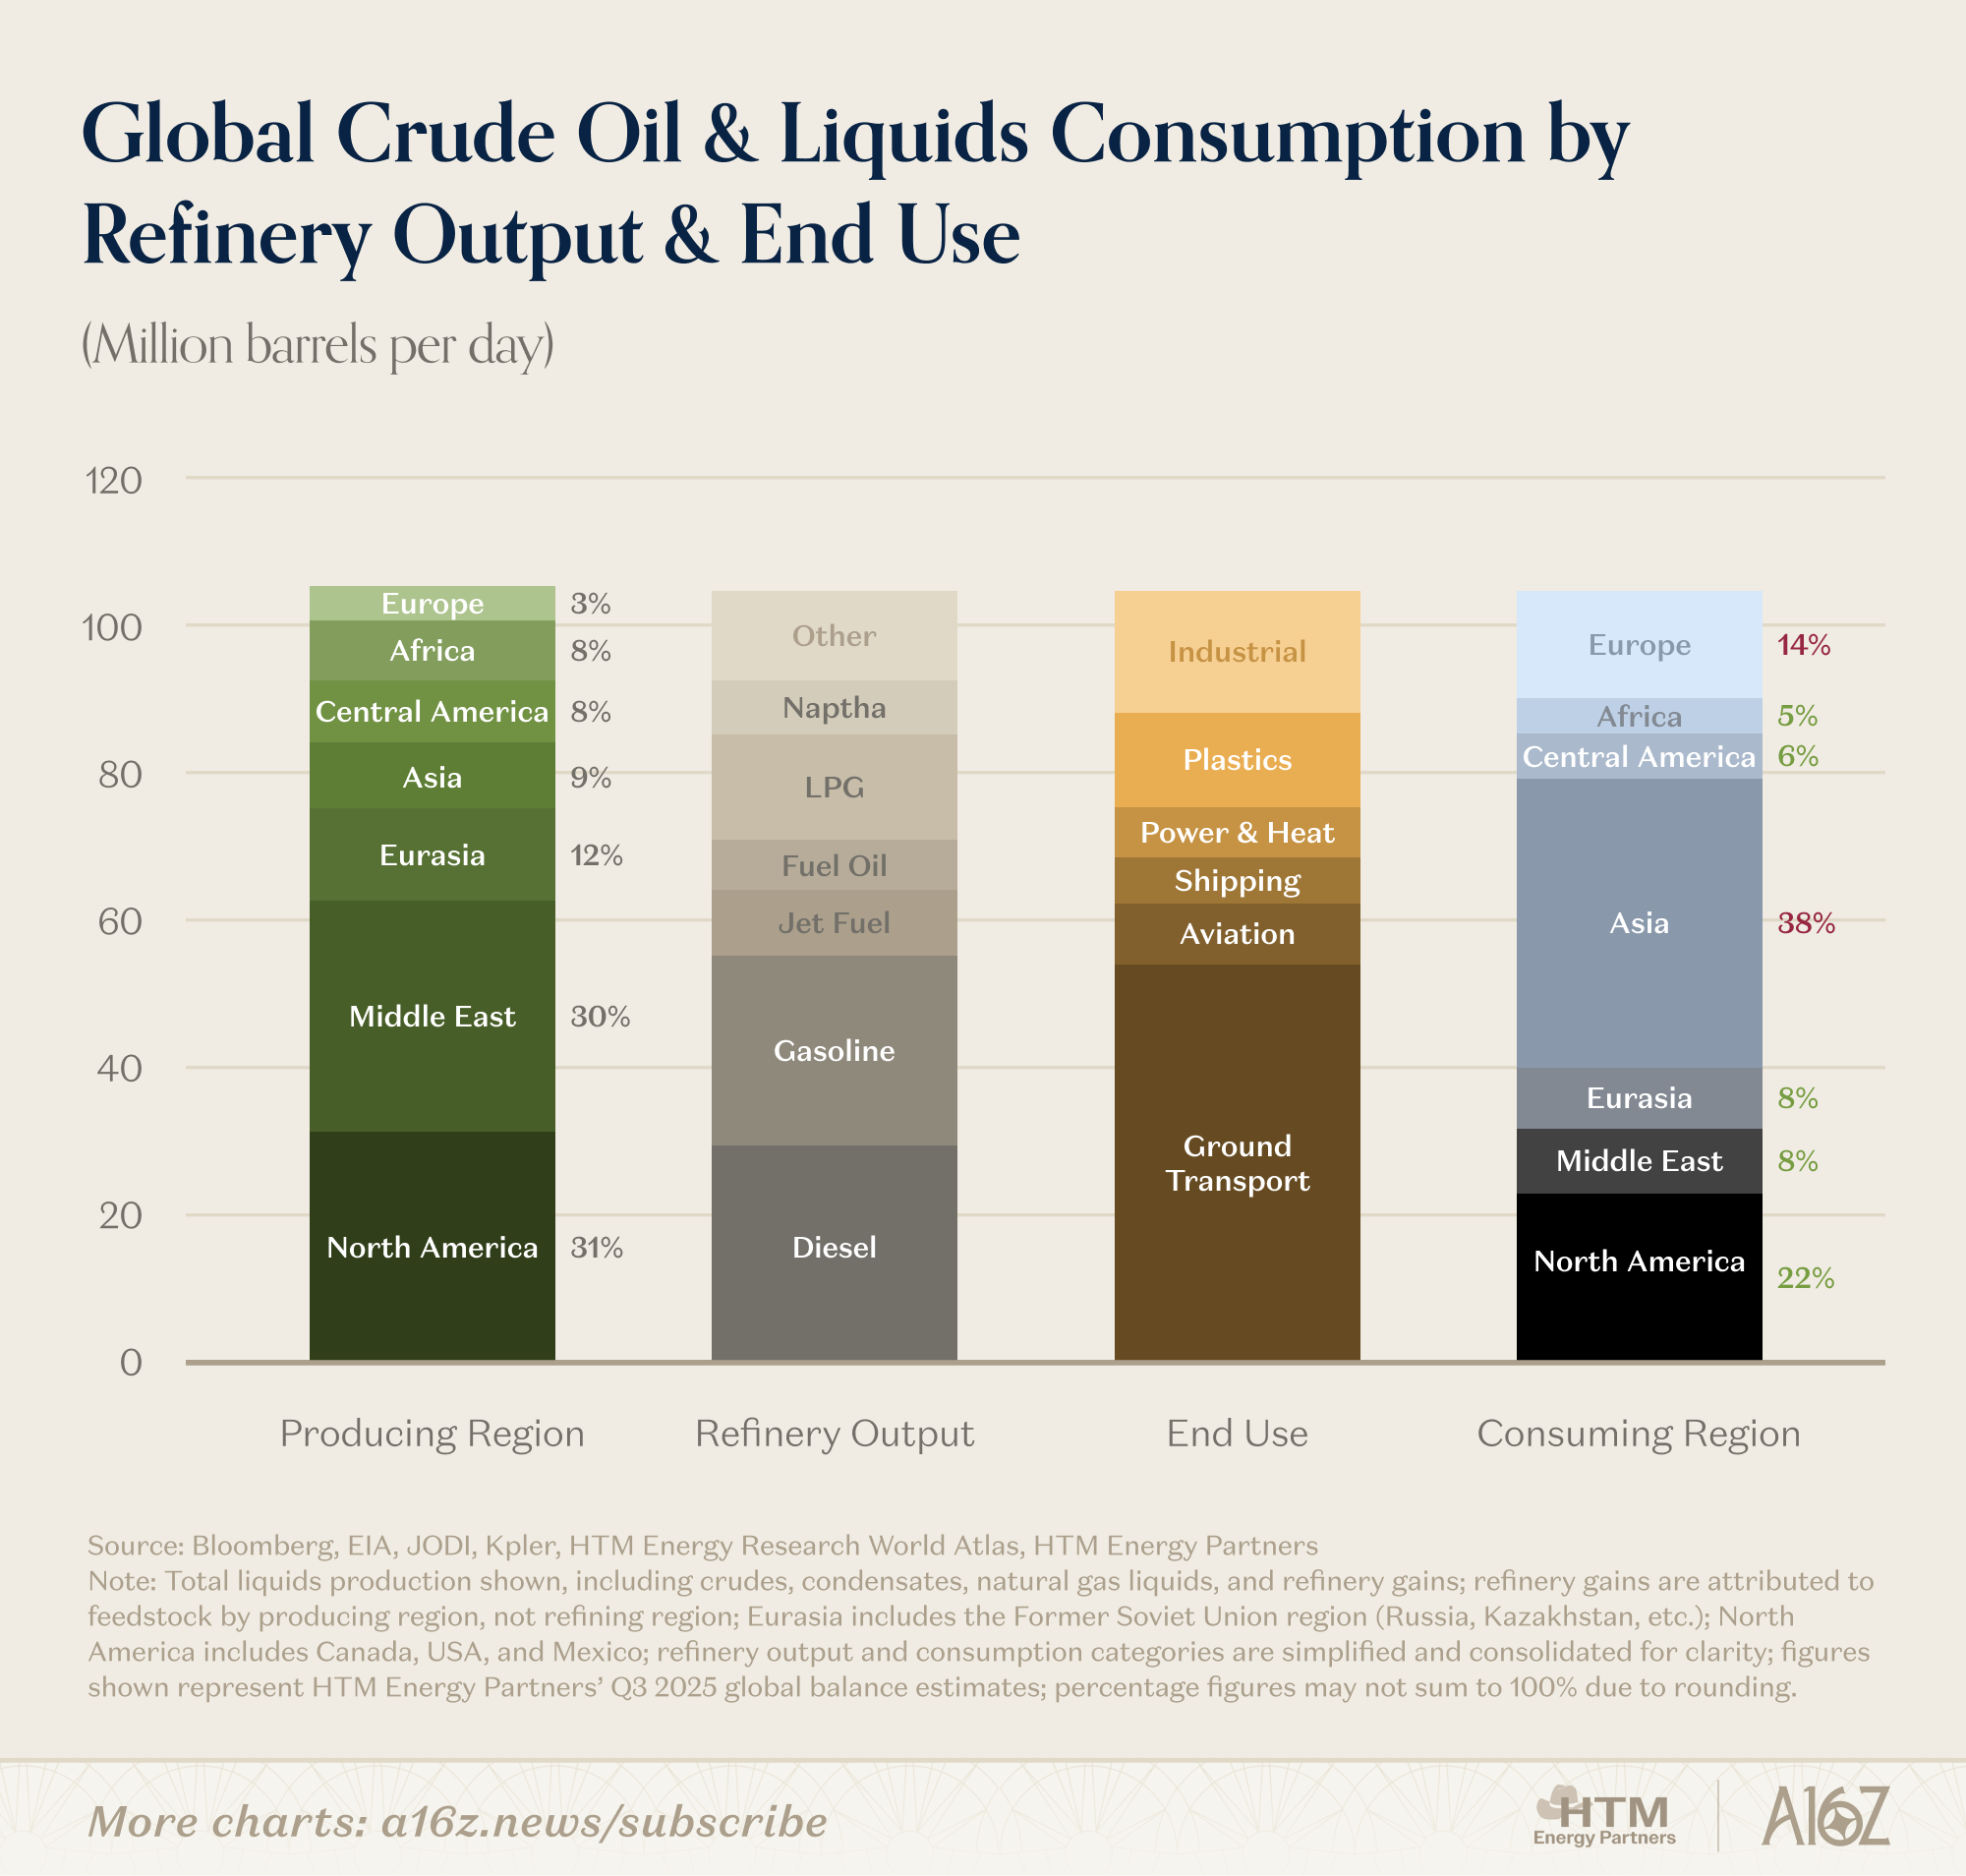
Kind of like how CUDA makes it impossible to move off the Nvidia stack – the Persian Gulf’s deliberate actions to build, internalize, and profit off the critical industrial processes that the world needed, has made their energy and materials output irreplaceable. Sure you could migrate to ROCm, but you won’t, and neither will Asia rebuild their ~38 mmbbls/d of refining capacity.
The Strait Jacket
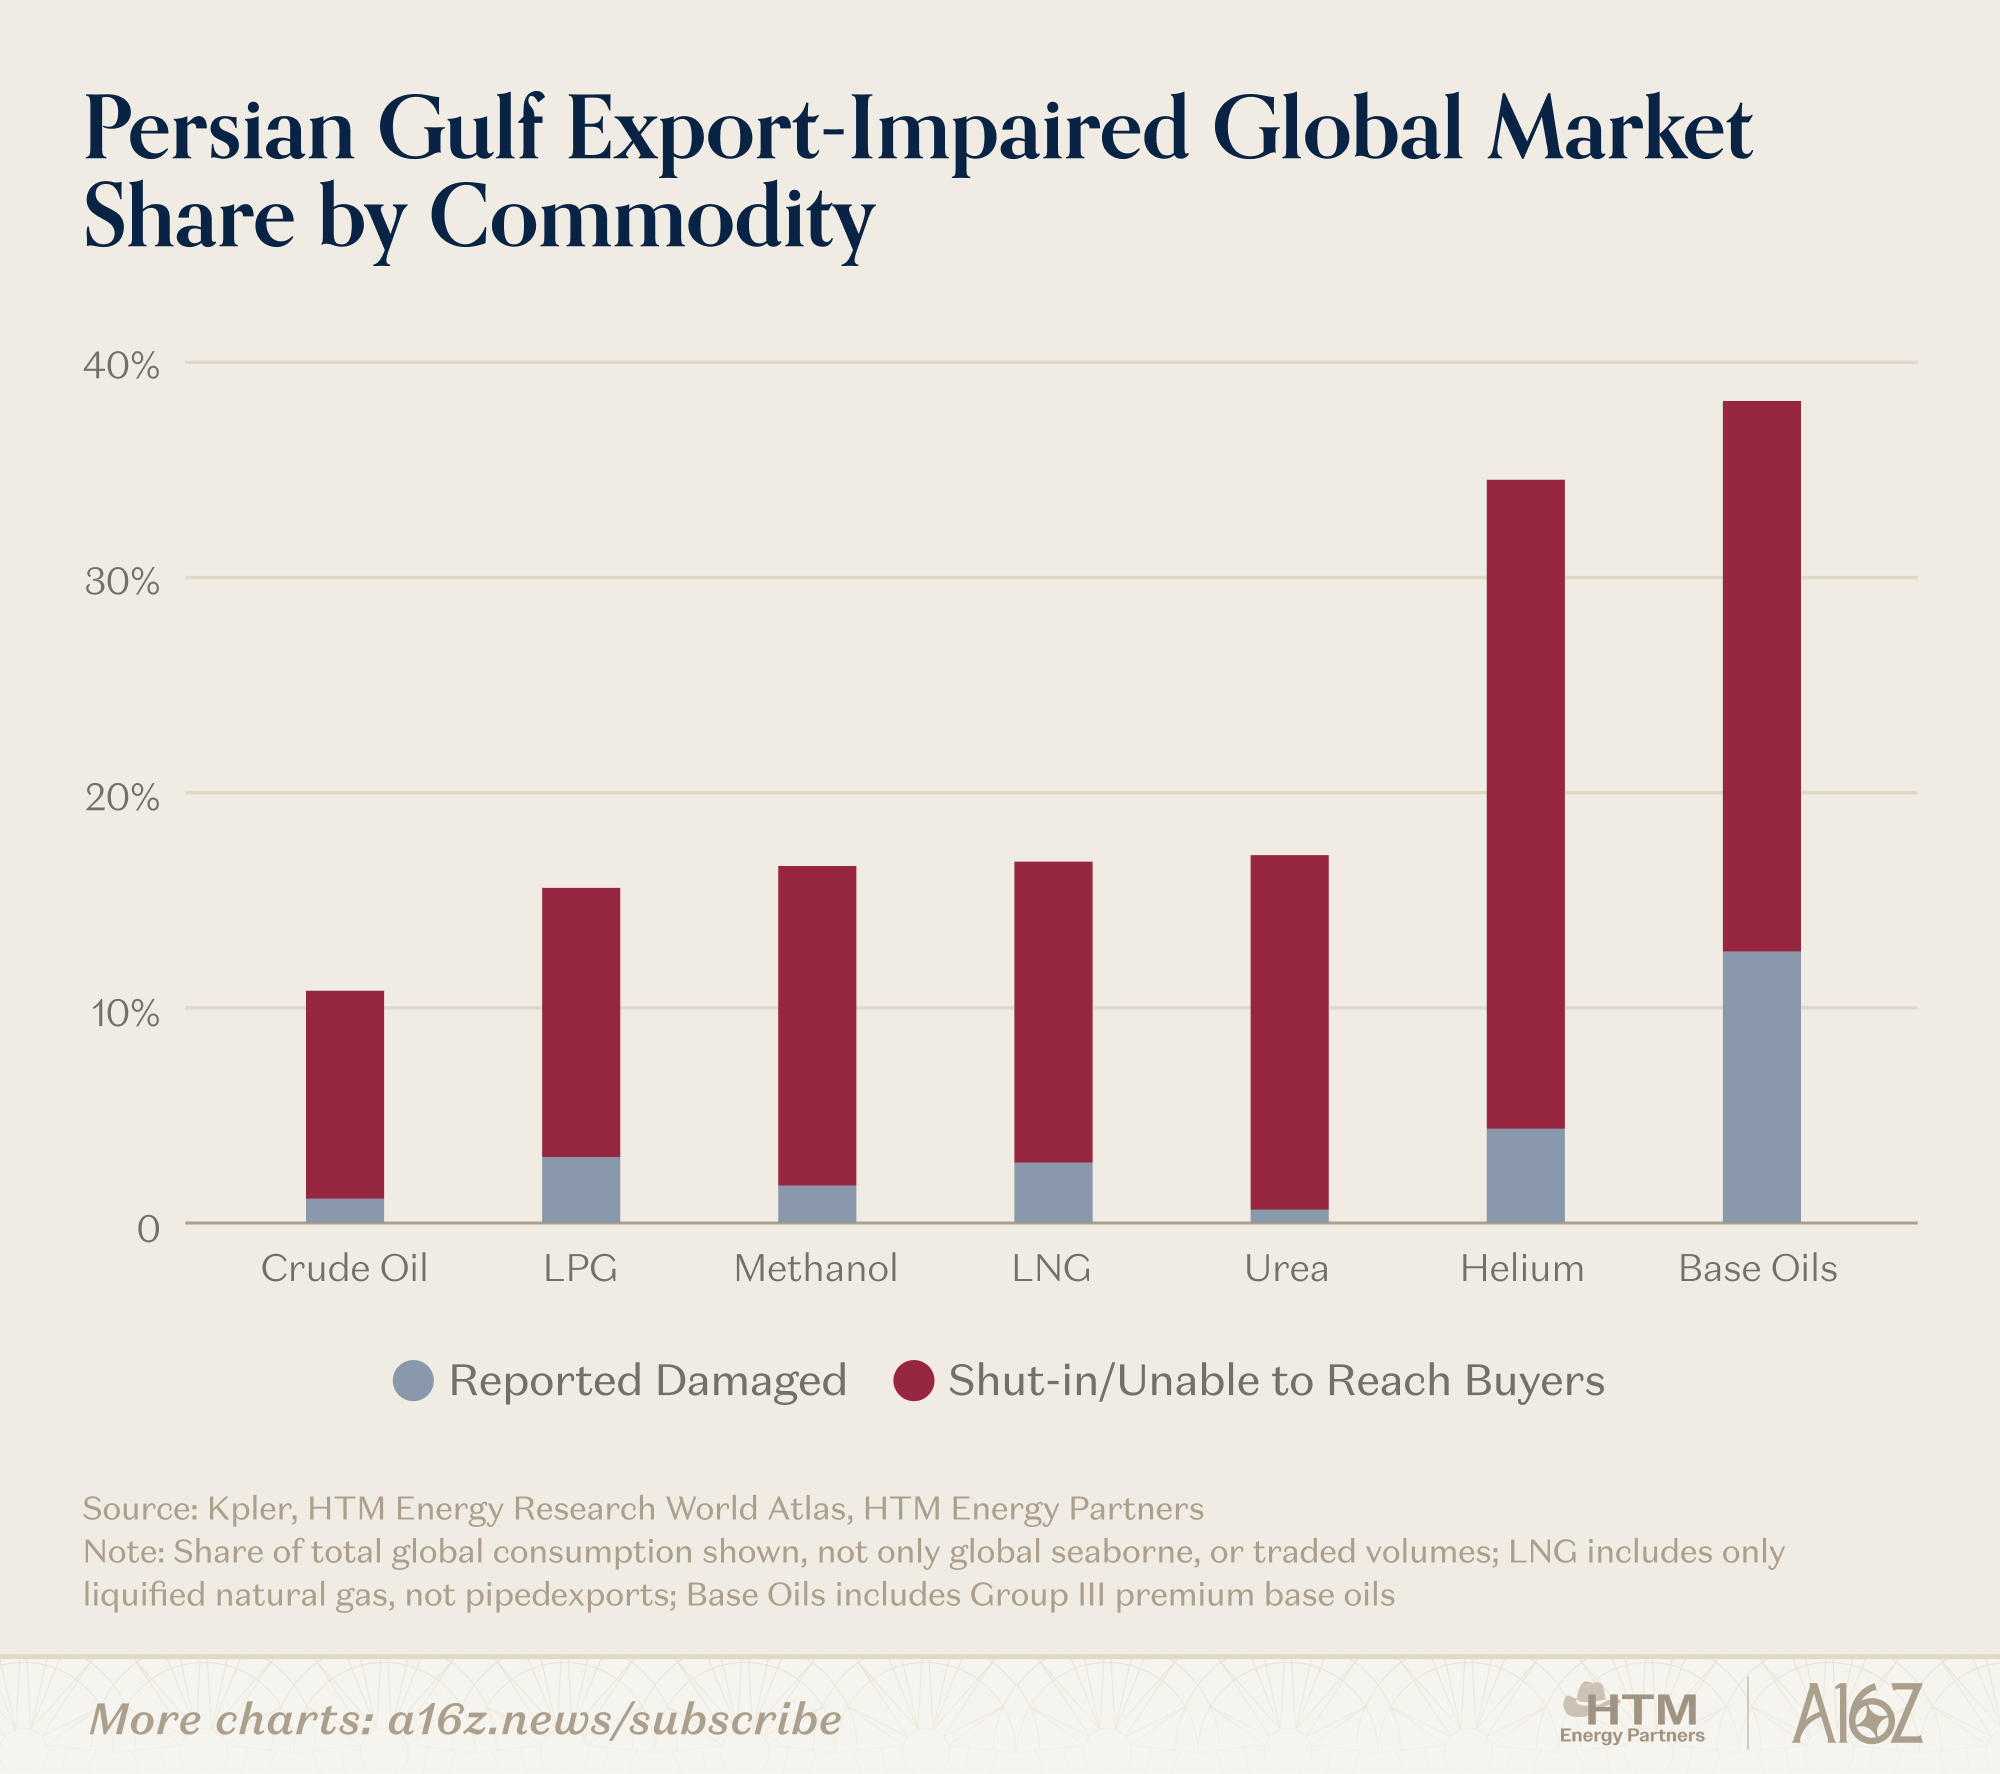
And here we are today – the Persian Gulf is totally paralyzed, and with its attrition, a significant share of the world’s energy supply is completely stranded. Across every key hydrocarbon/commodity category, ~15% or more of the world’s production is unable to reach its normal-course buyer. And not just crude oil, its key industrial gases, refined fuels; even metals, fertilizers, and lubricants. Invisible things that are critical to a functioning earth. Remember, these are commodity markets, where pricing is set at the margin – and the loss of the Middle East is anything but marginal.
The impairment is being felt physically already in markets where the Gulf makes up a large share of global seaborne trade, like condensates and petrochemicals – and felt financially where the absolute volume loss is catastrophic enough to curb-stomp global pricing. The fallout has largely been limited to Asian countries that are reliant on just-in-time delivery of natural gas and crude oil. Substitutes, if available at all, are in the Americas and months away by ship – and if the Strait’s closure was to last that long, the world would no longer be facing a regional commodity deficit, there would be very real, unsolvable, global energy shortages.
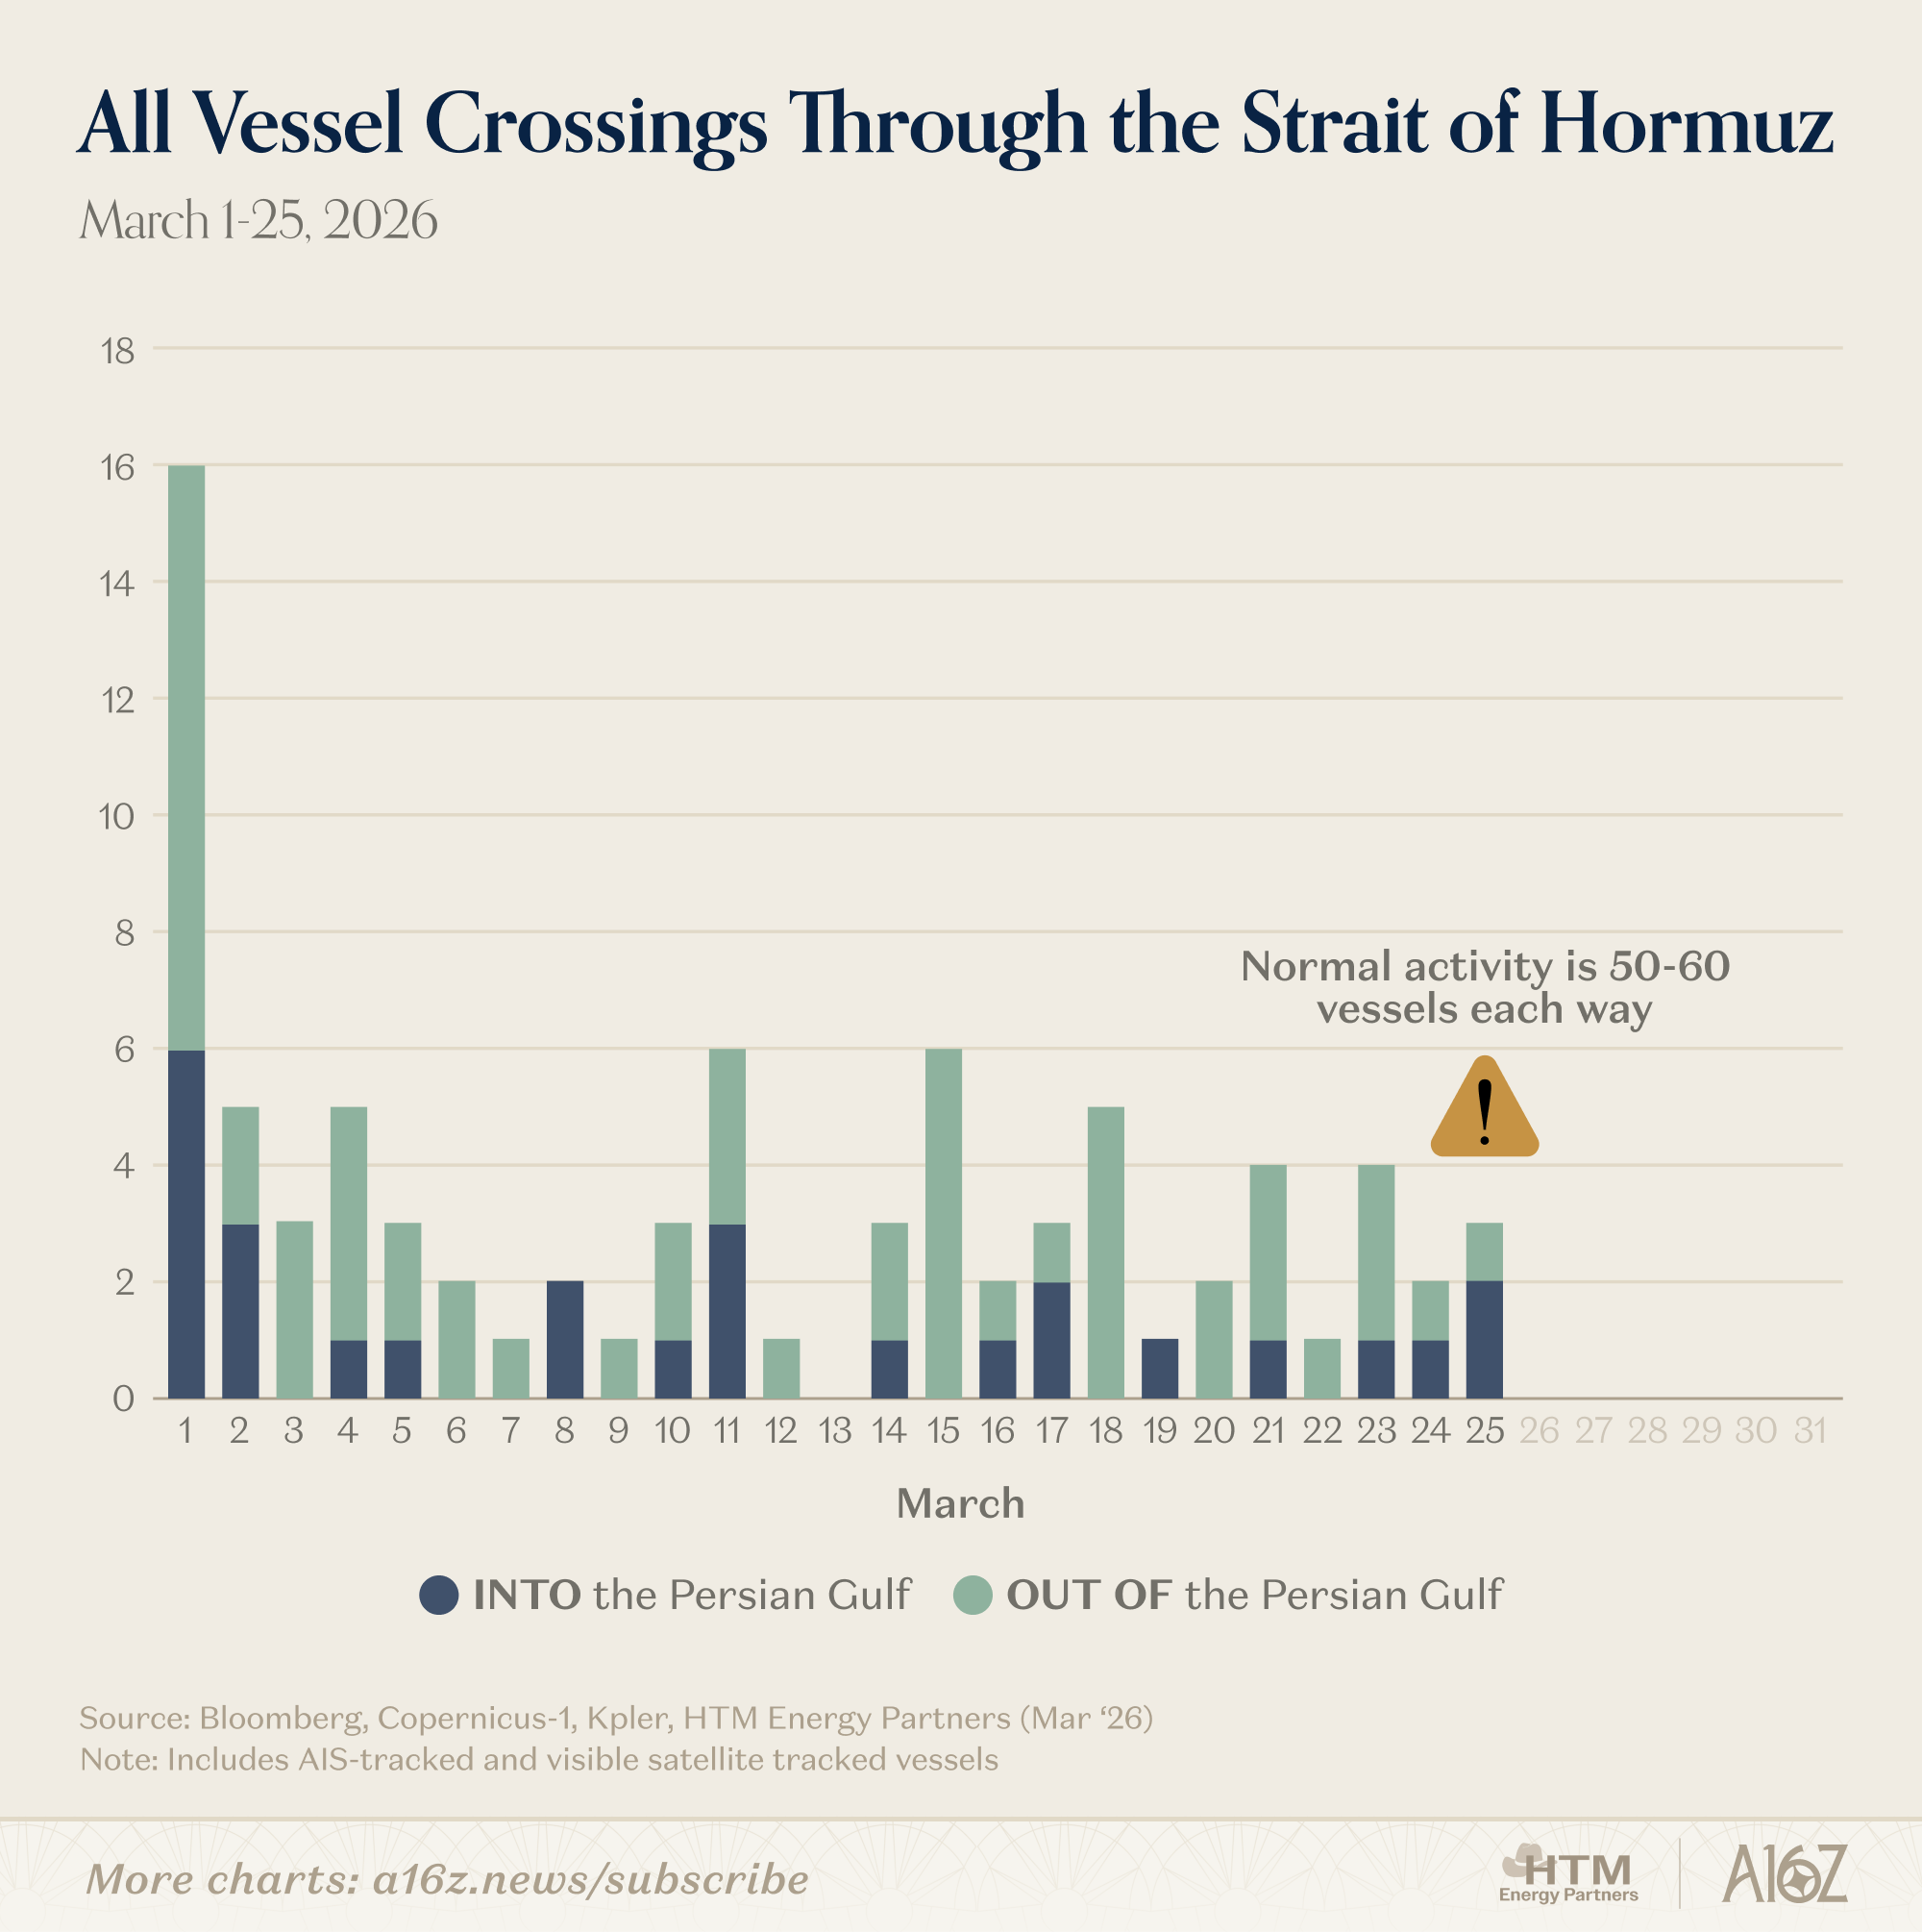
Worst of all, nobody knows what’s happening. Visibility into activity through the Strait is deteriorating. Vessels are now transiting with AIS (Automatic Identification System) transponders switched off, leaving satellite imagery and fragmented media reporting as the only way to gauge true activity.
By our math, only 17 (maybe 18) vessels have crossed the Strait in the past 7 days, total! At normal levels, we’d expect ~50-60 vessels transiting daily, each way. Even counting the Iranian shadow fleet activity, and the new pay-to-cross scheme through Iranian territorial waters, activity through the Strait is still 95% lower than normal.
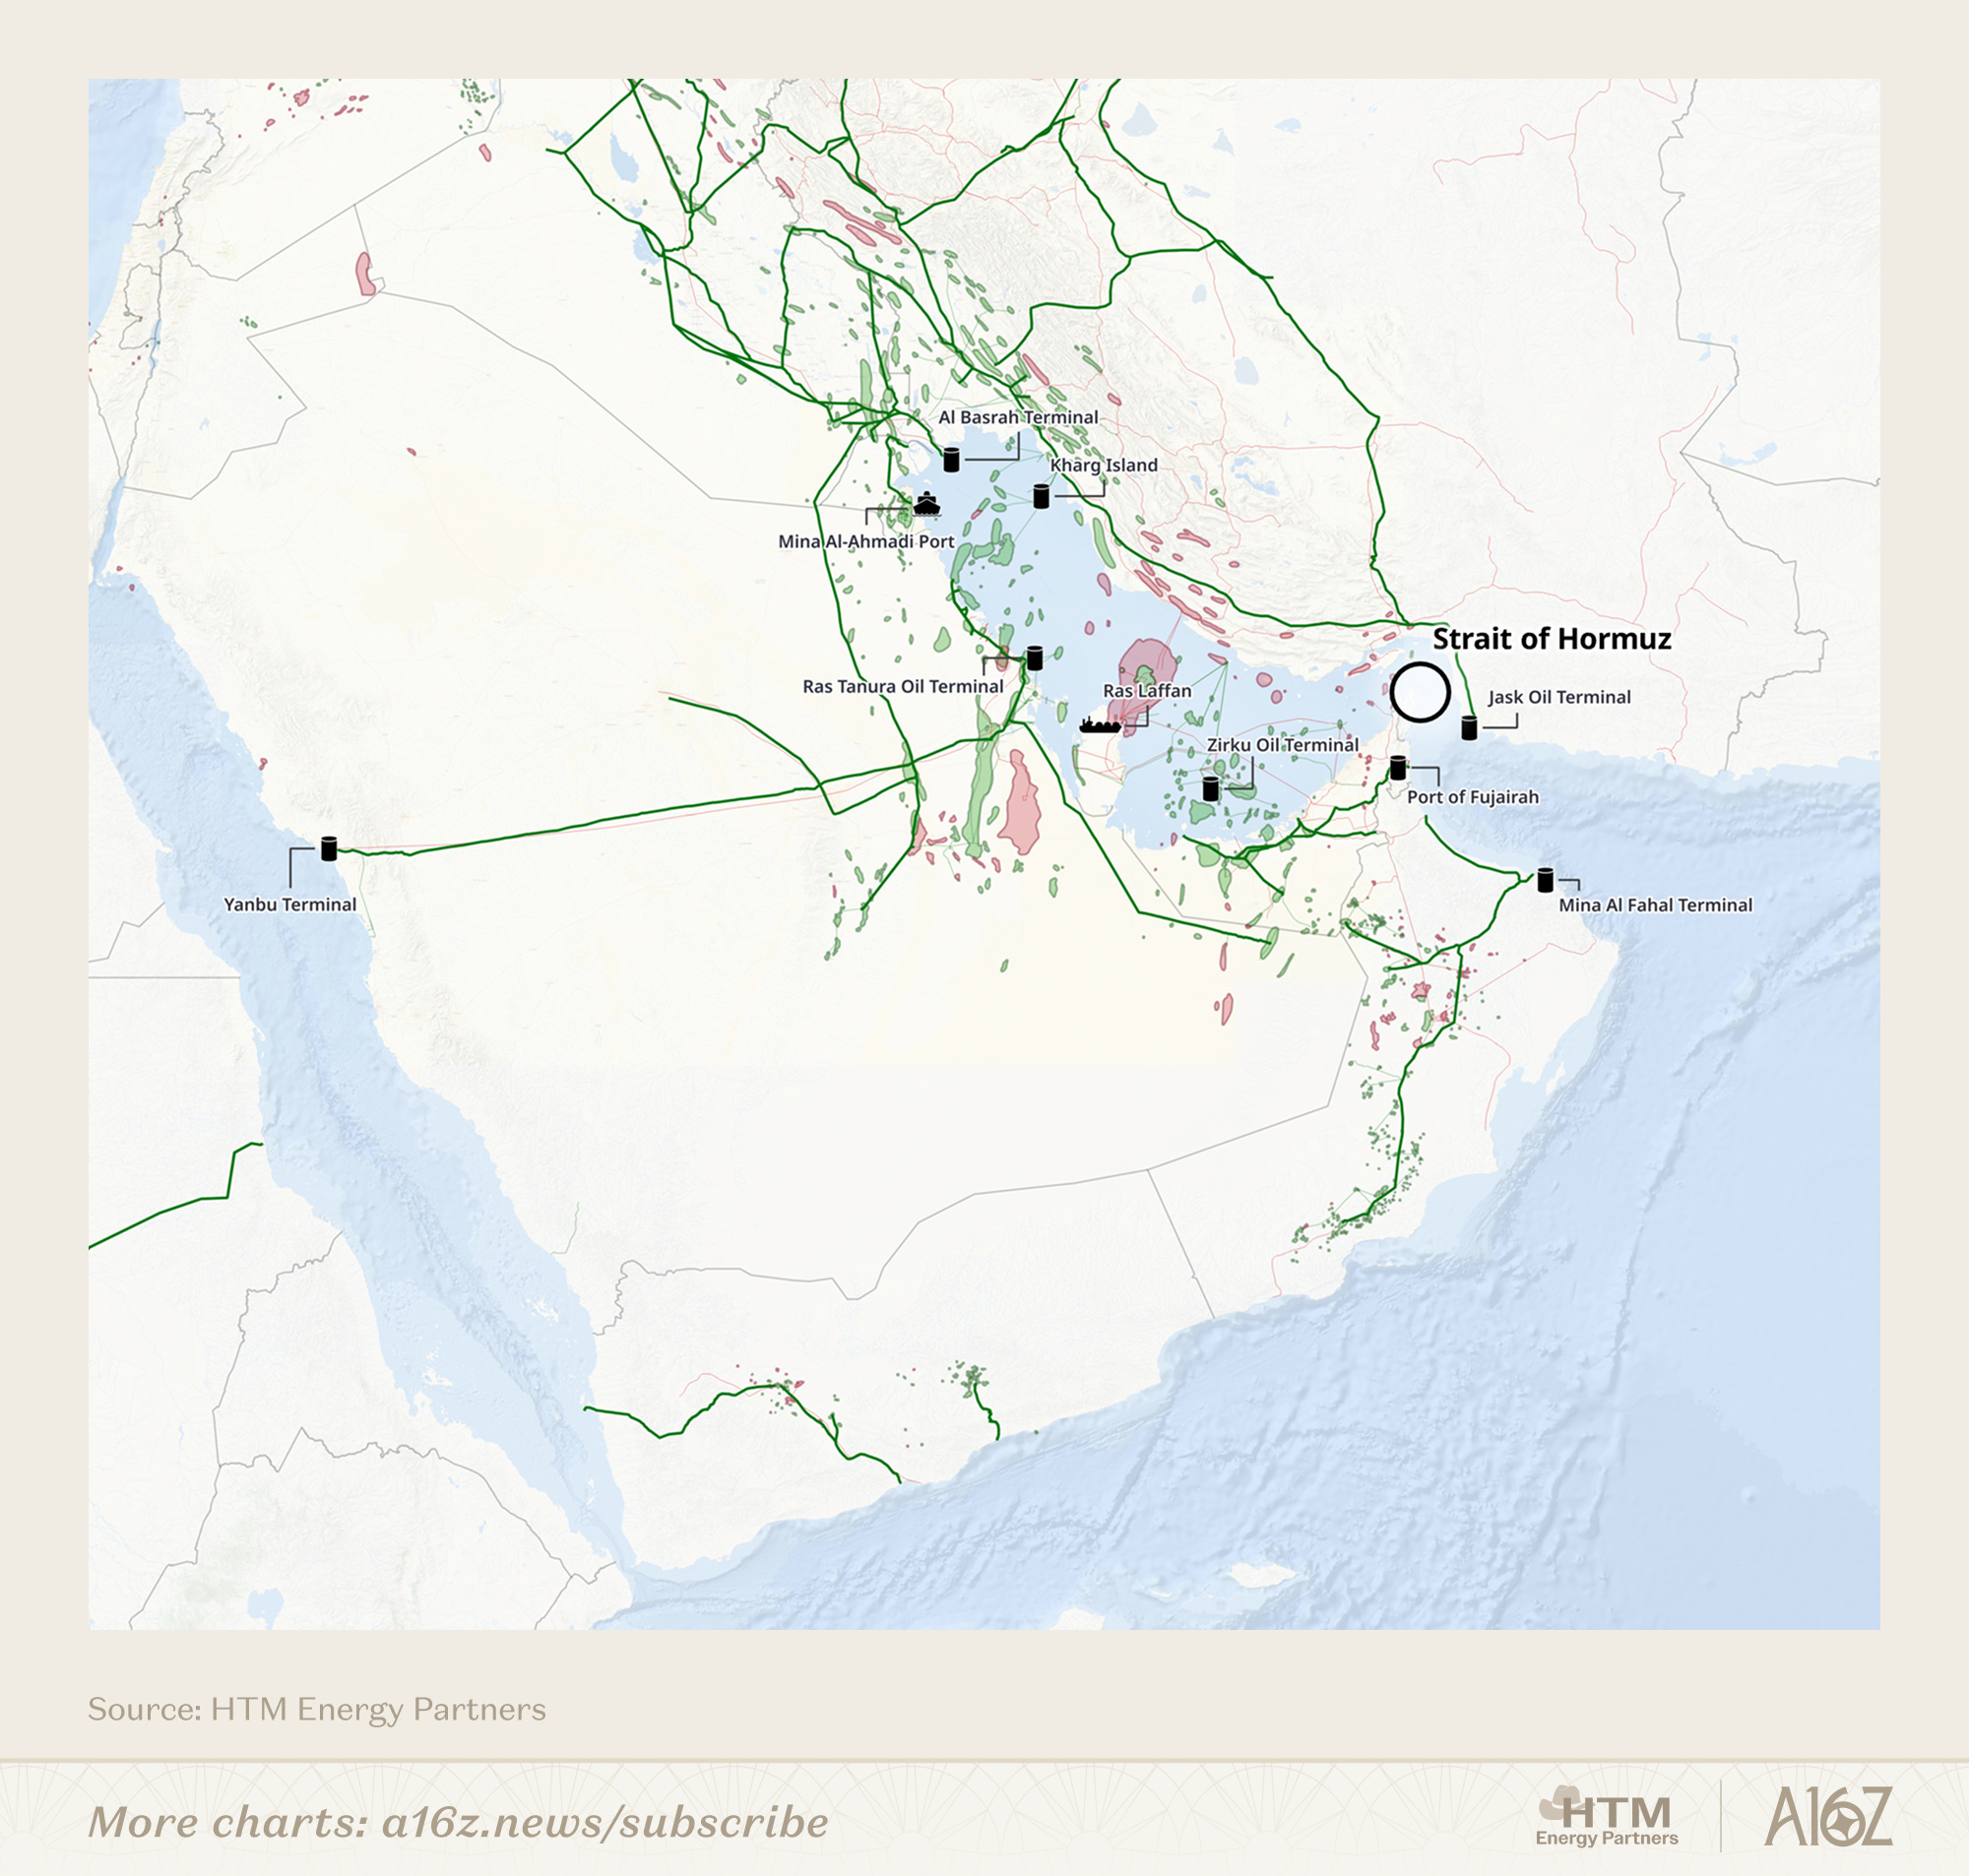
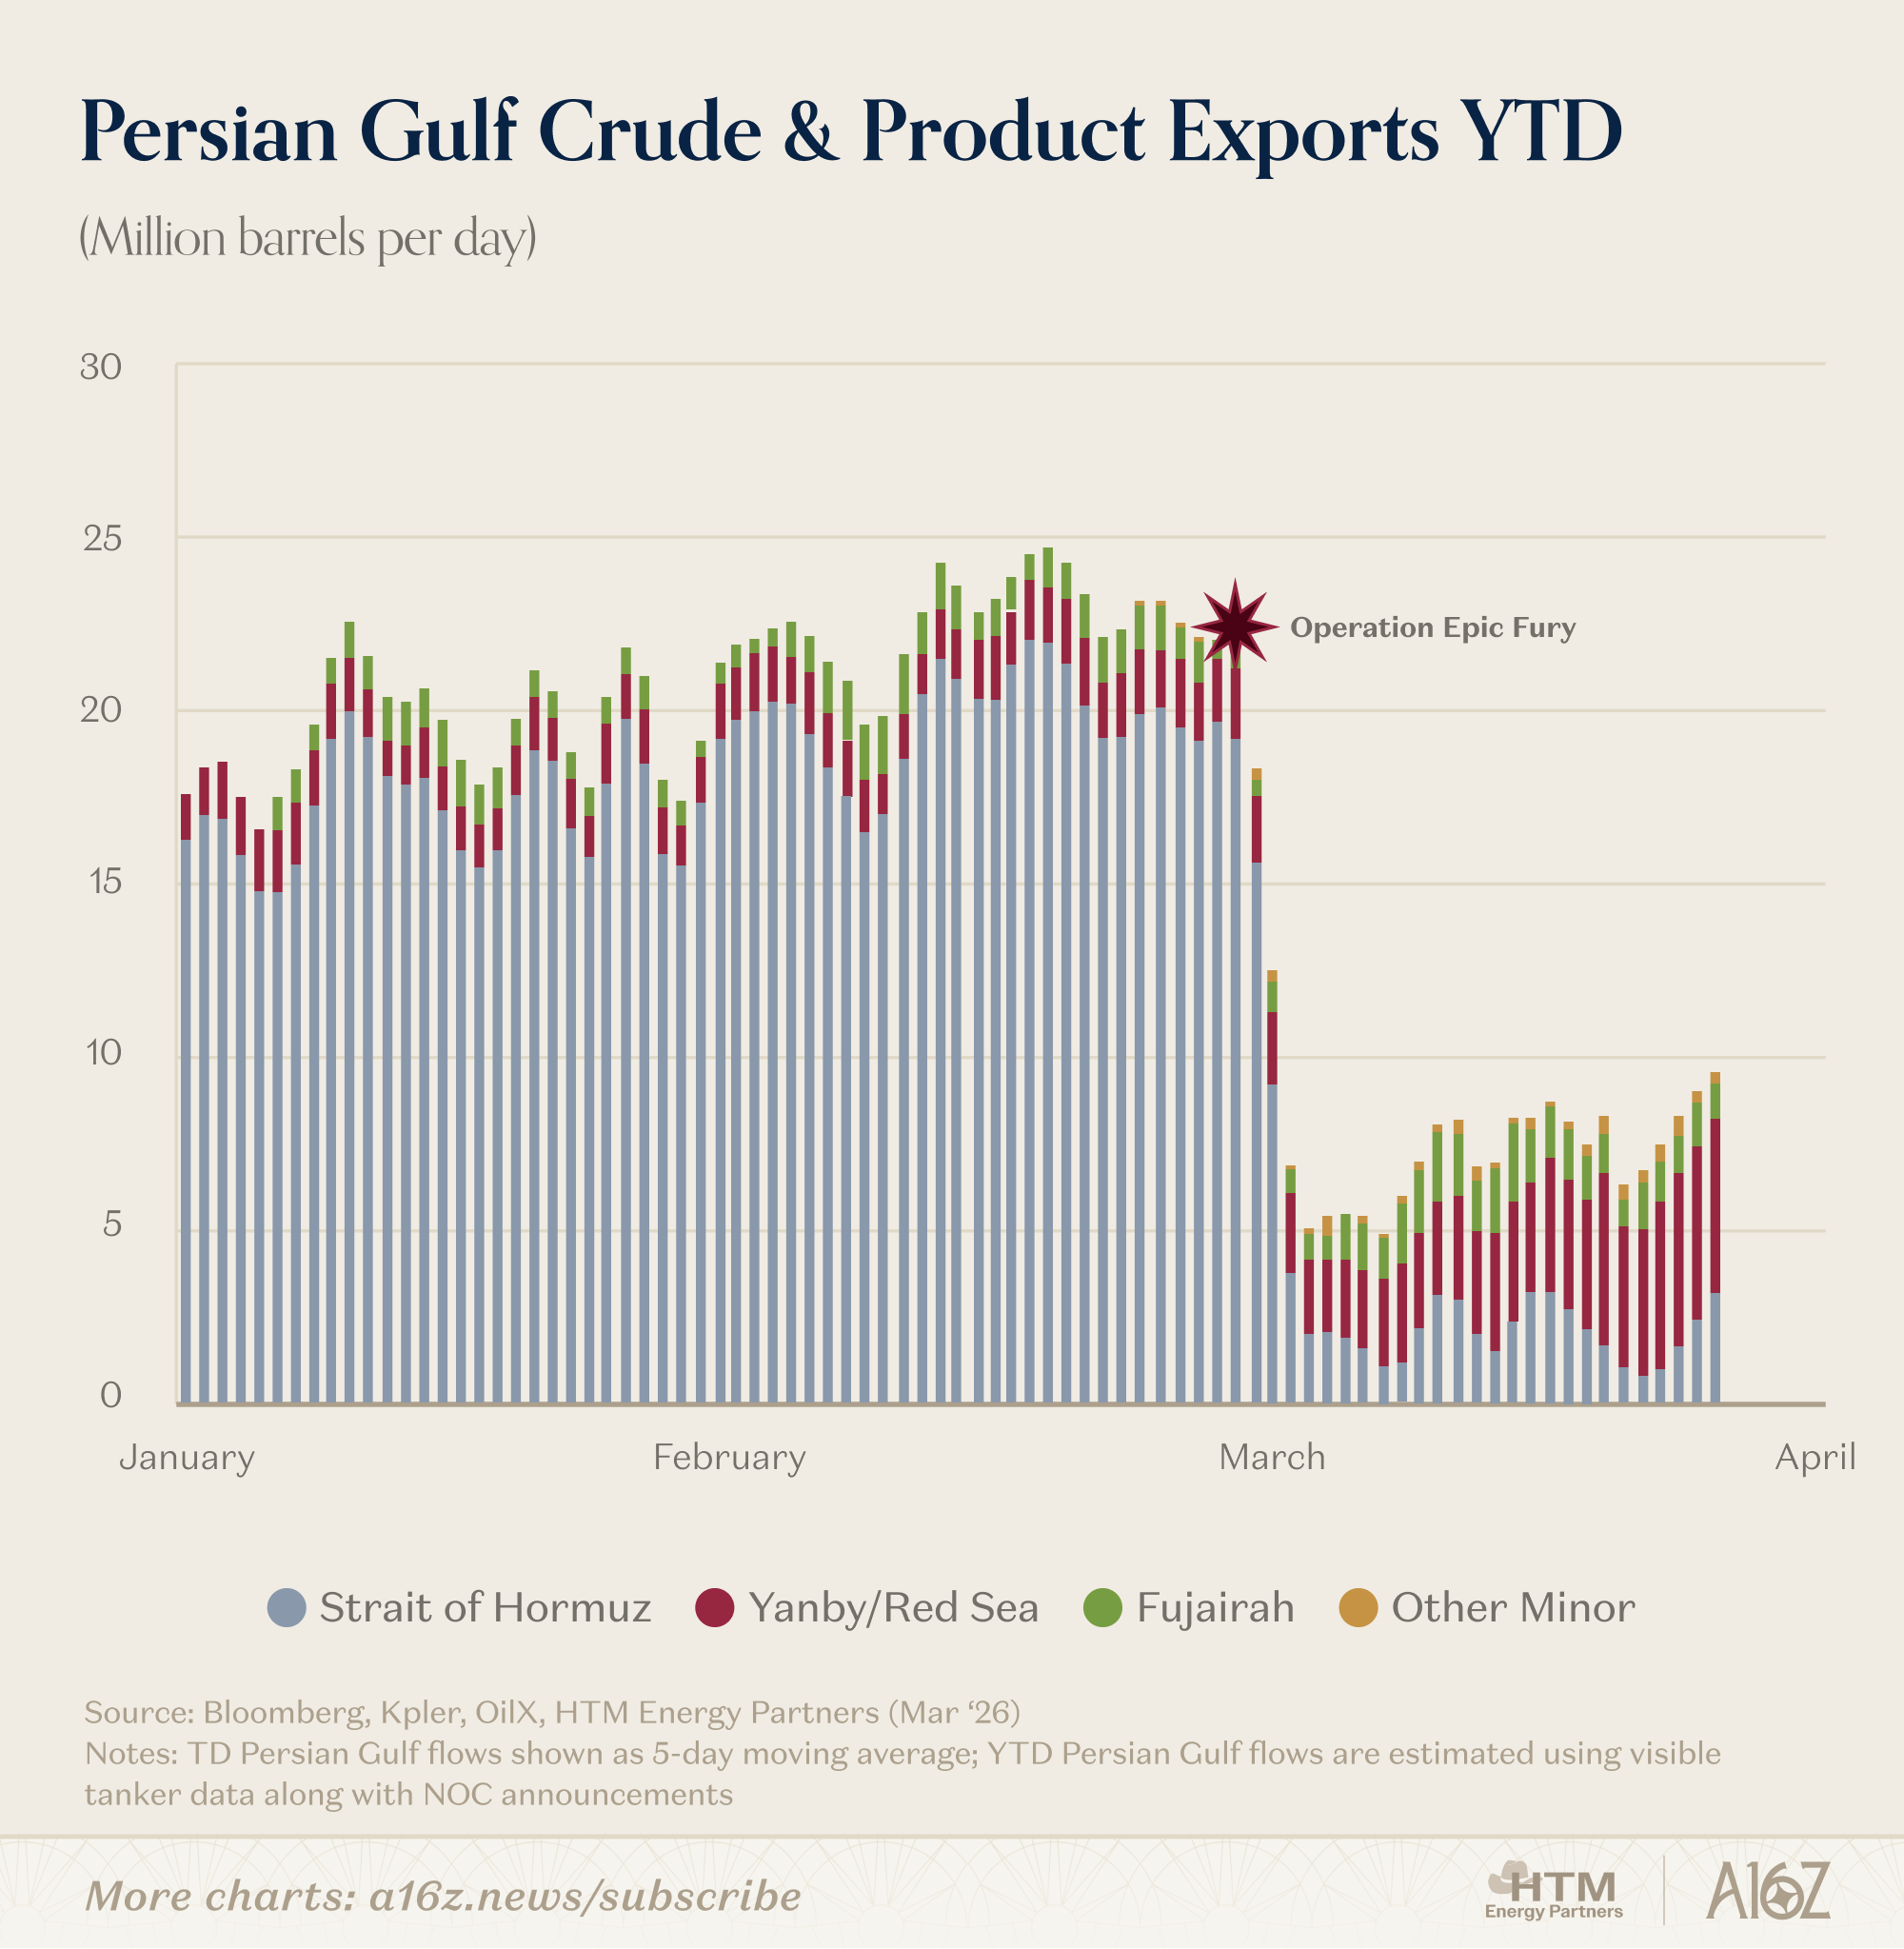
Saudi Arabia is the only country with a meaningful contingency plan by way of the East-West pipeline that runs across the map and terminates in Yanbu. Saudi Arabia has been successful in ramping their Yanbu export terminal to ~5 mmbbls/d, leaving them with ~2-3 mmbbls/d of crude and product exports that are impaired. Aside from Saudi Arabia, the UAE has diverted an incremental ~0.5-1.0 mmbbls/d to their Fujairah Terminal, and Iraq has routed ~0.2-0.3 mmbbls/d of crude through Turkey to be exported.
While the infrastructure on the map below may not look like much, the infrastructure on the map below represents ~15-20% of global liquids supply, depending on utilization, and ~10% of this supply can’t be exported any other way. The Al Basrah Terminal is ~3.8 mmbbls/d, and Iraq’s backup option couldn’t even handle 10% of Al Basrah’s volume. Kuwait is almost completely trapped, the same for Bahrain and Qatar. All these facilities, under normal circumstances would effortlessly load crude piped to the Gulf from inland fields onto tankers making the same, mechanical global laps. To return to normal would mean at minimum, ~20 tankers and gas carriers would have to pass each way (in & out) each day. Today we’re at ~2 tankers moving each way.
Insulated, Not Immune
Beside the price at the pump, the pain of the Strait closing hasn’t been fully felt by the West. Because North and Central America are net exporters of crude oil, liquids, and products, we don’t have barrels that are “unmatched.” But in a world where everyone is desperate for barrels, North America’s export position, and distance, can only act as a natural buffer for so long.
Prompt cargos from the US Gulf Coast have already begun trickling into Asia as the arbs got too generous to pass (that’s the point!). China has begun restricting product exports already, which leaves their buyers (Australia) scrambling. New Zealand, Australia, and Europe began with a broad SPR release which buys them ~2 weeks. The time for the Strategic Petroleum Reserve is indeed now, but it only buys time, and stock draws are not a fix to the Strait’s closure, which still desperately needs to come.
Financial Manipulation or Physical Desperation?
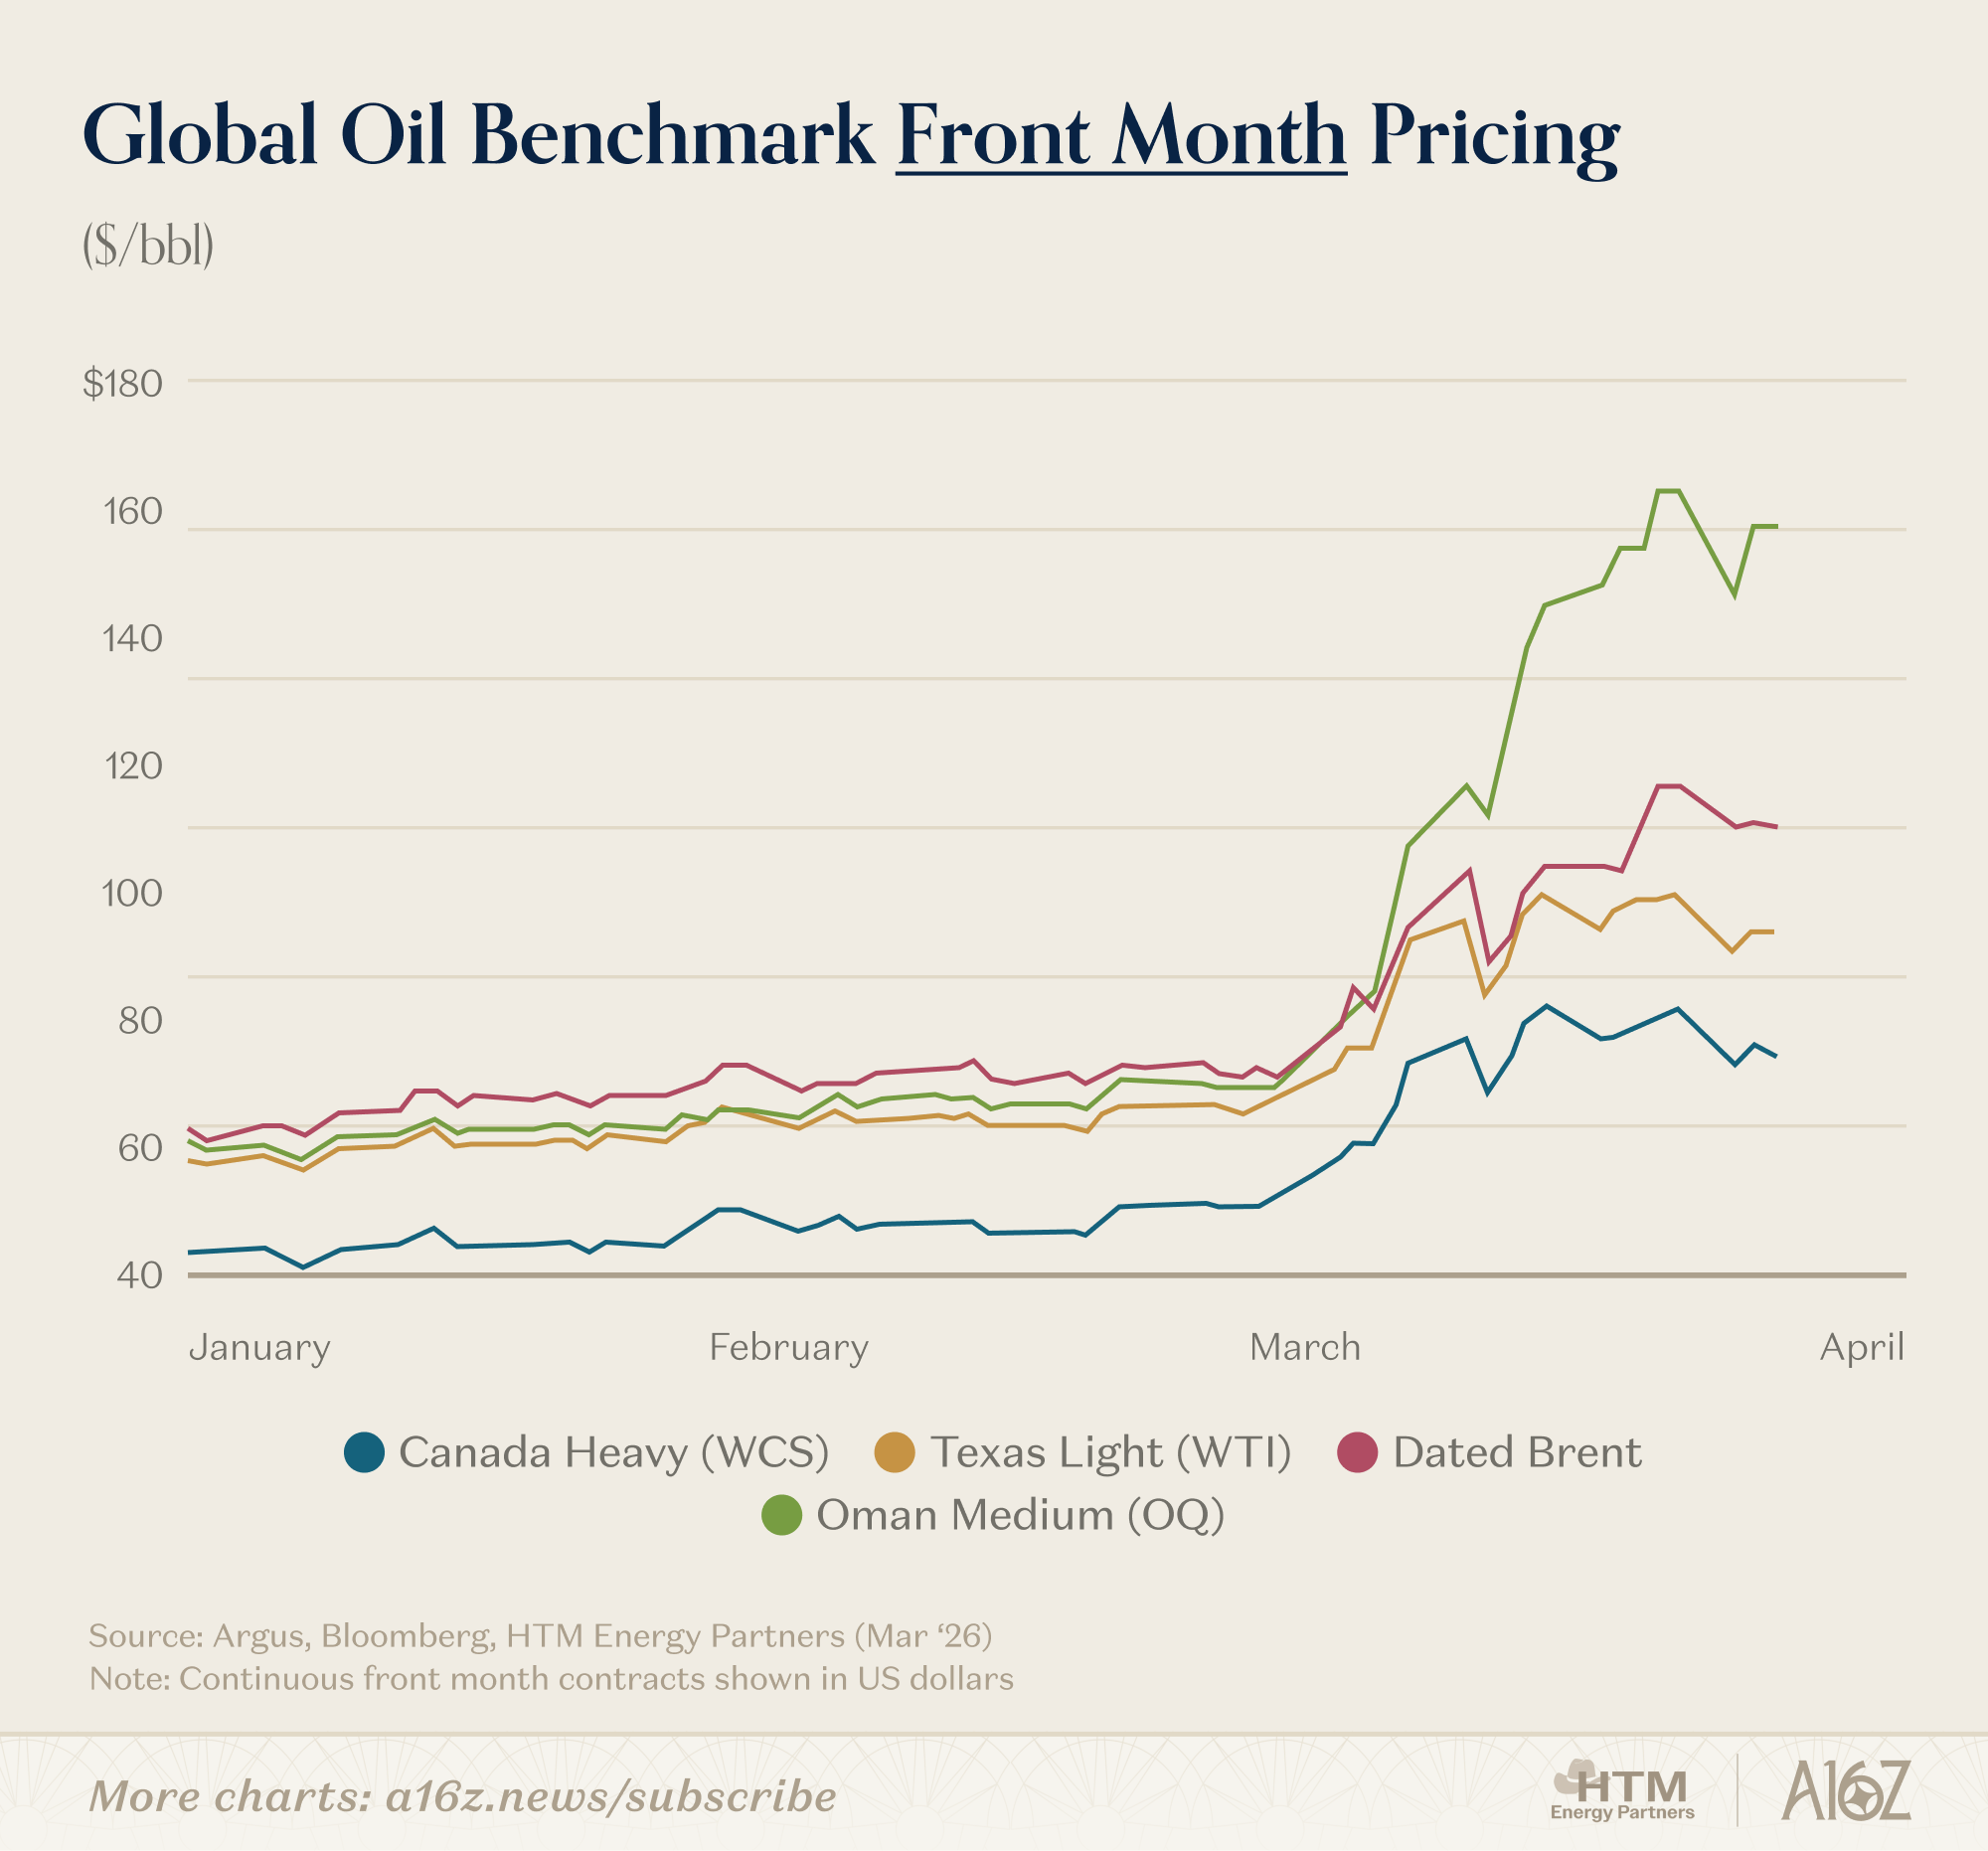
Rumors of the US Treasury intervening in the oil markets have spread like wildfire. Many watchers are questioning why West Texas Intermediate (WTI) crude oil is trading at such a discount to Brent crude (the European benchmark), and Omani crude.
Normally, Brent crude trades at a nominal ~$5/bbl premium to WTI, but last week that spread reached $20/bbl, and Omani crude changed hands at a $60/bbl premium to WTI! While dislocations that extreme might screen as manipulation, the physical crude market is, well… in extreme dislocation. These spreads are indicative of a healthy market, not manipulation – and the explanation lies in delivery timing.
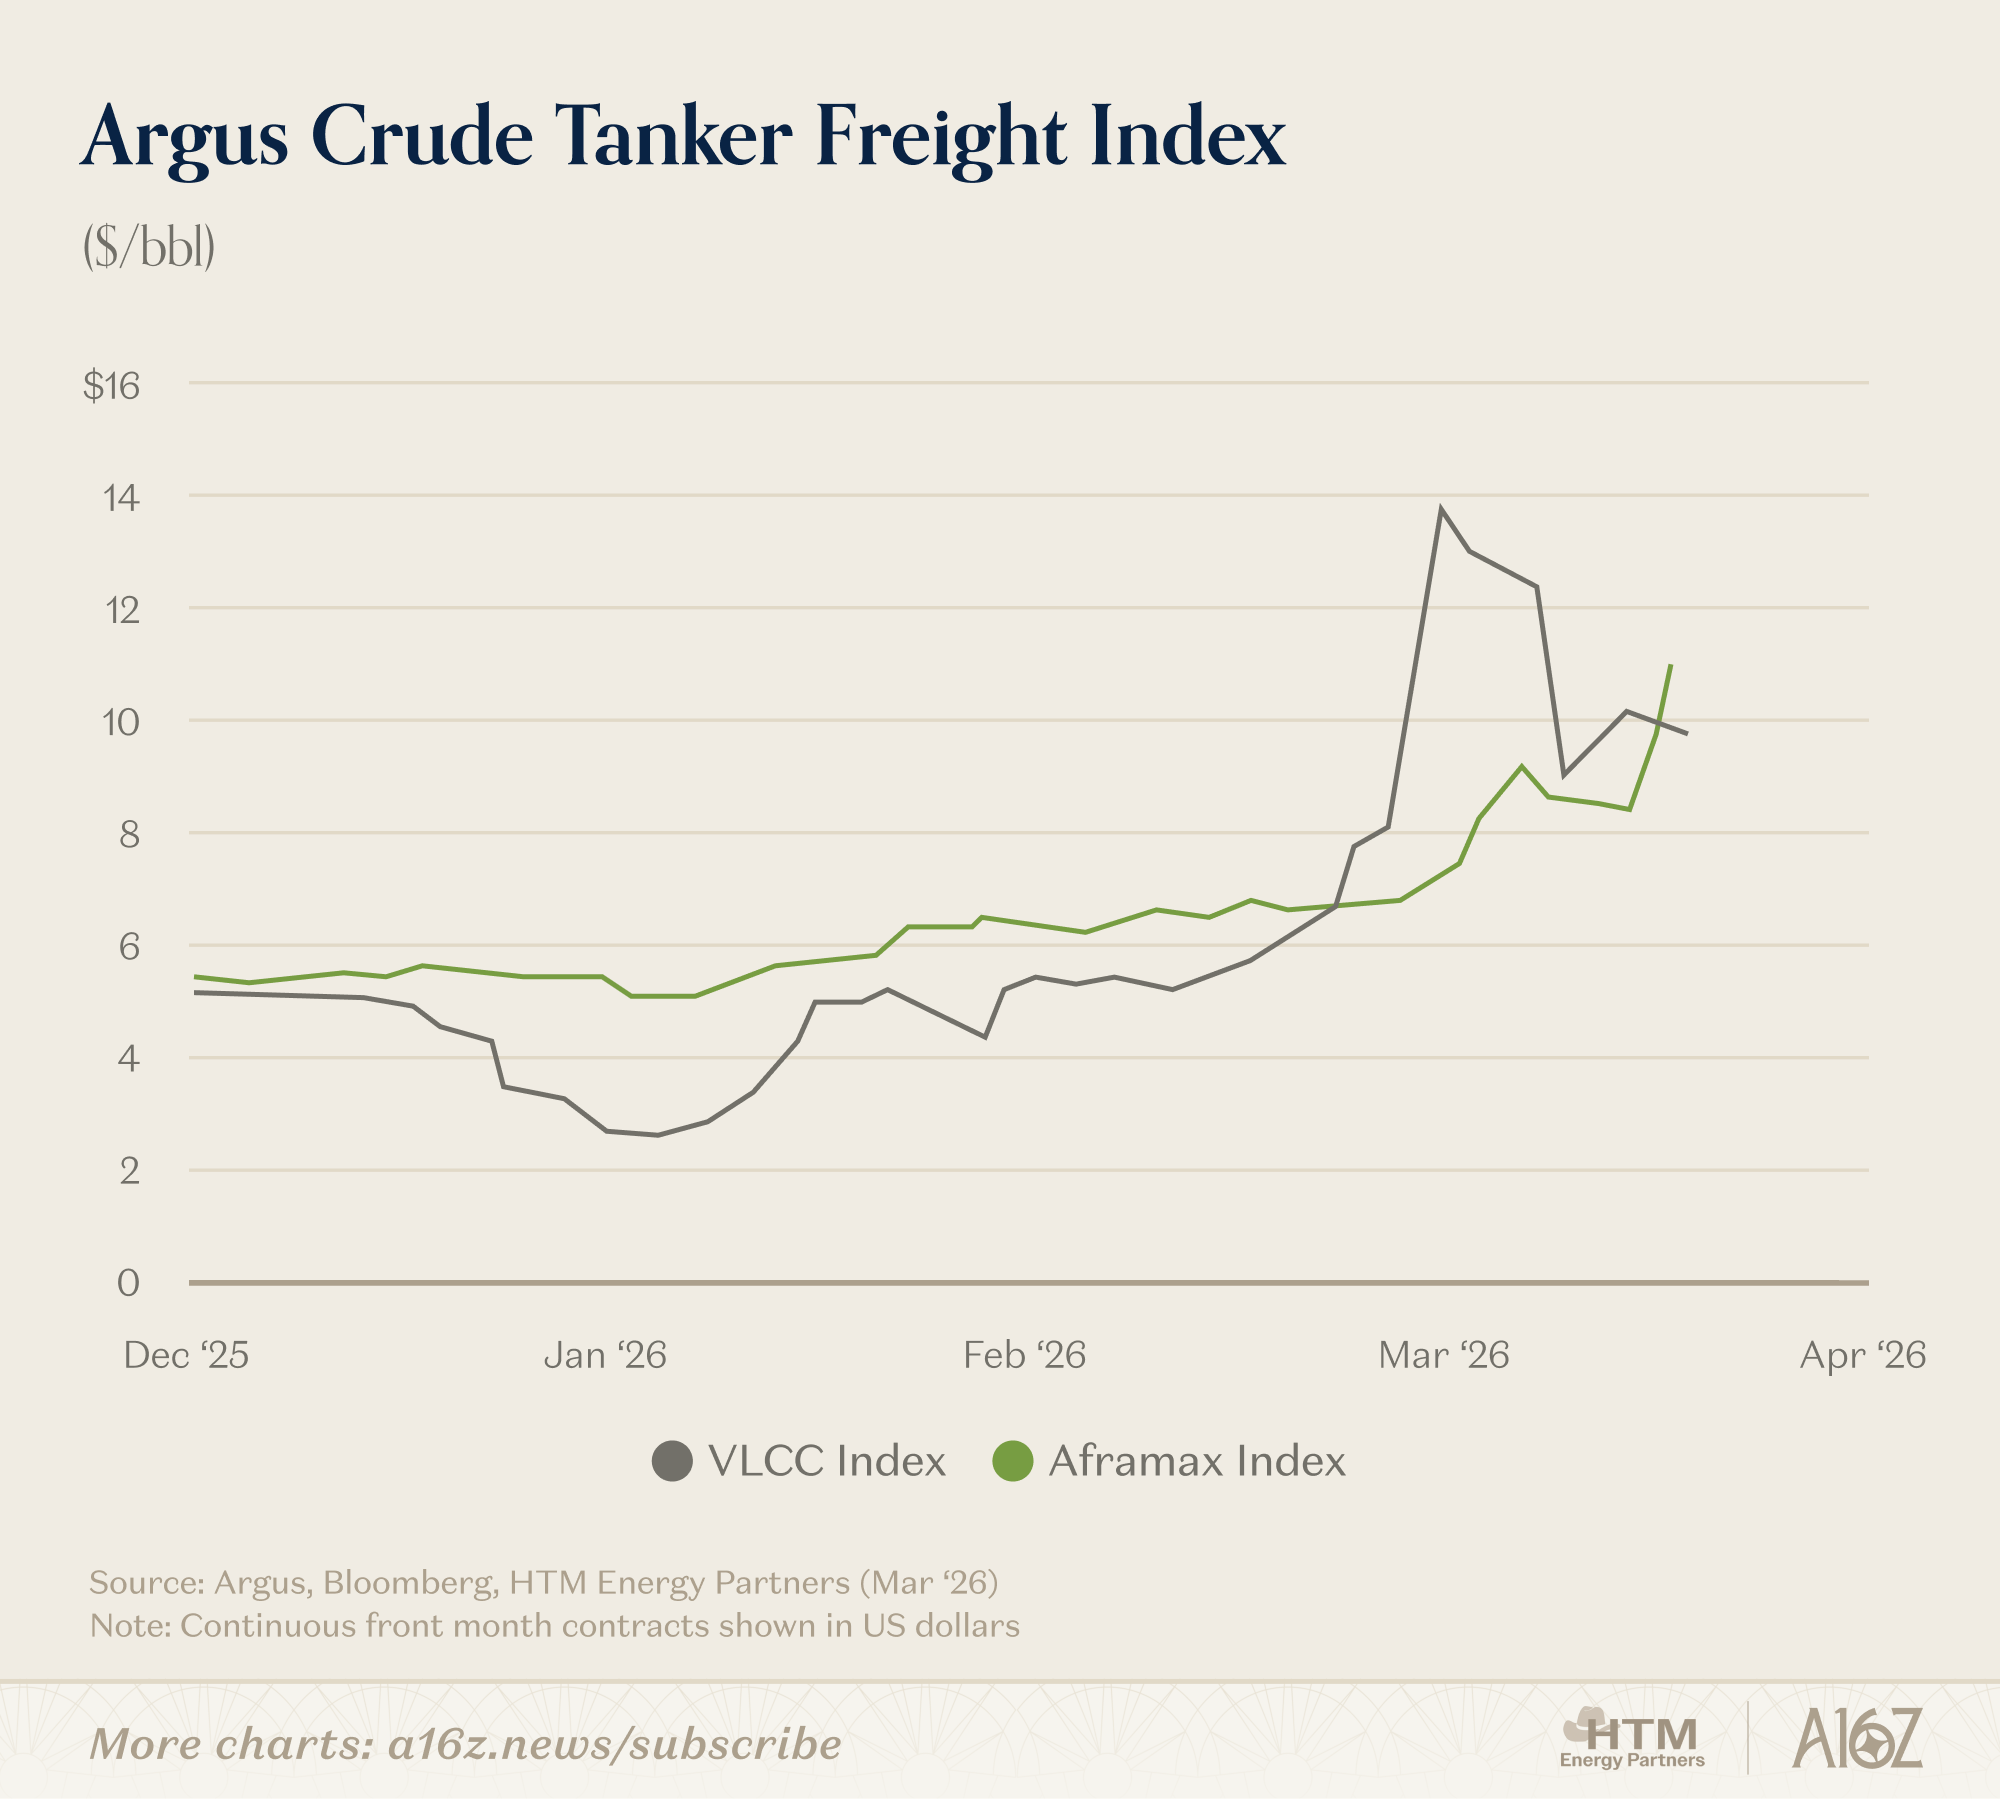
Front-month WTI cannot reach Asia for ~60 days! The delivery window for prompt WTI contracts begins May 1st, and those barrels still lie behind a 25-45 day tanker voyage to reach buyers that need oil today. This has put a significant premium on barrels that can be had sooner. Similarly, as physical flows abruptly change, the cost of freight has surged, with Argus’ VLCC freight index indicates it costs ~$10/bbl to move a barrel of crude today, compared to ~$5/bbl at the end of last year.
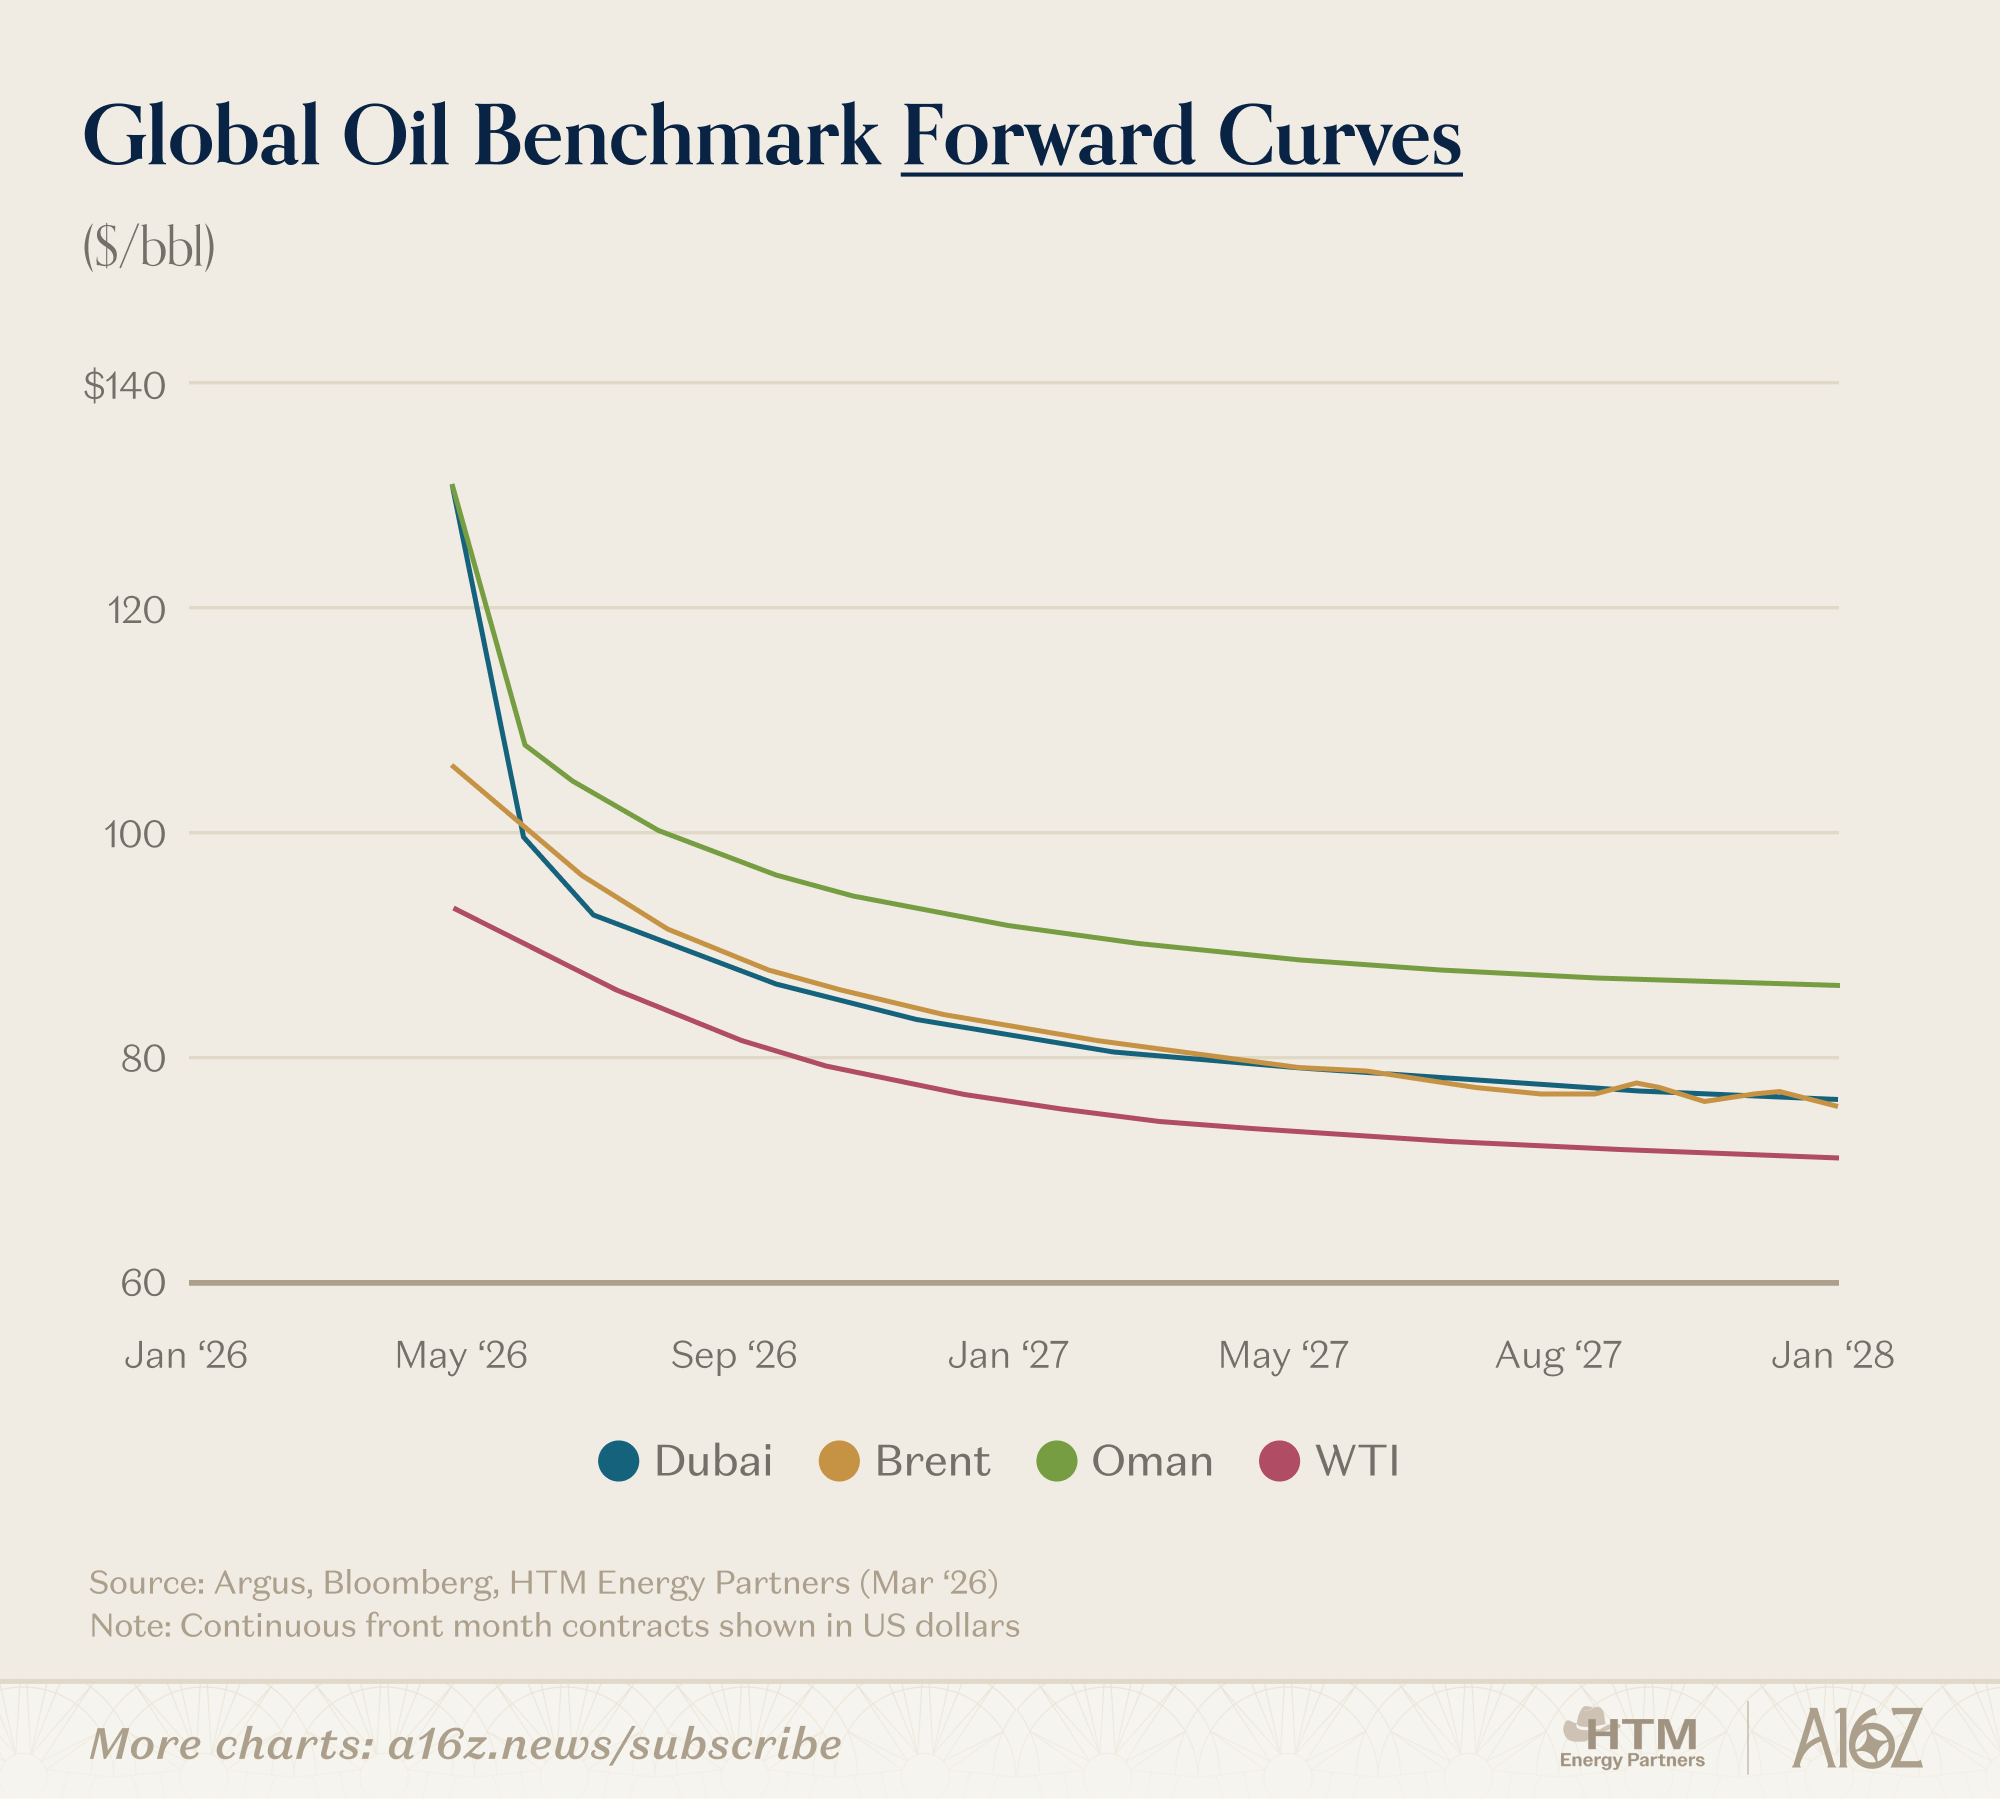
These little trifles make WTI less desirable – worse delivery timing, more expensive freight, and worst of all, a crude oil quality that Asian refiners aren’t designed for. Looking down the forward curve, the WTI-Brent spread normalizes to ~$5/bbl through late-spring, suggesting that prompt-month dislocation was indeed just a symptom of the most vital shipping lane on earth being blockaded.
Omani crude is loaded east of the Strait of Hormuz, and just days away from Indian and Asian refiners. Another hint that desperation is driving the dislocation – the spread between Brent 1st line & Dated Brent reached a 5-year high at $7/bbl. The 1st line spread represents the premium paid for near-term barrels over planned cargos weeks in the future. Logically, it makes sense that when ~15 mmbbls/d of oil production is turned off, people pay a lot for barrels available now.
Disruption Disbelief
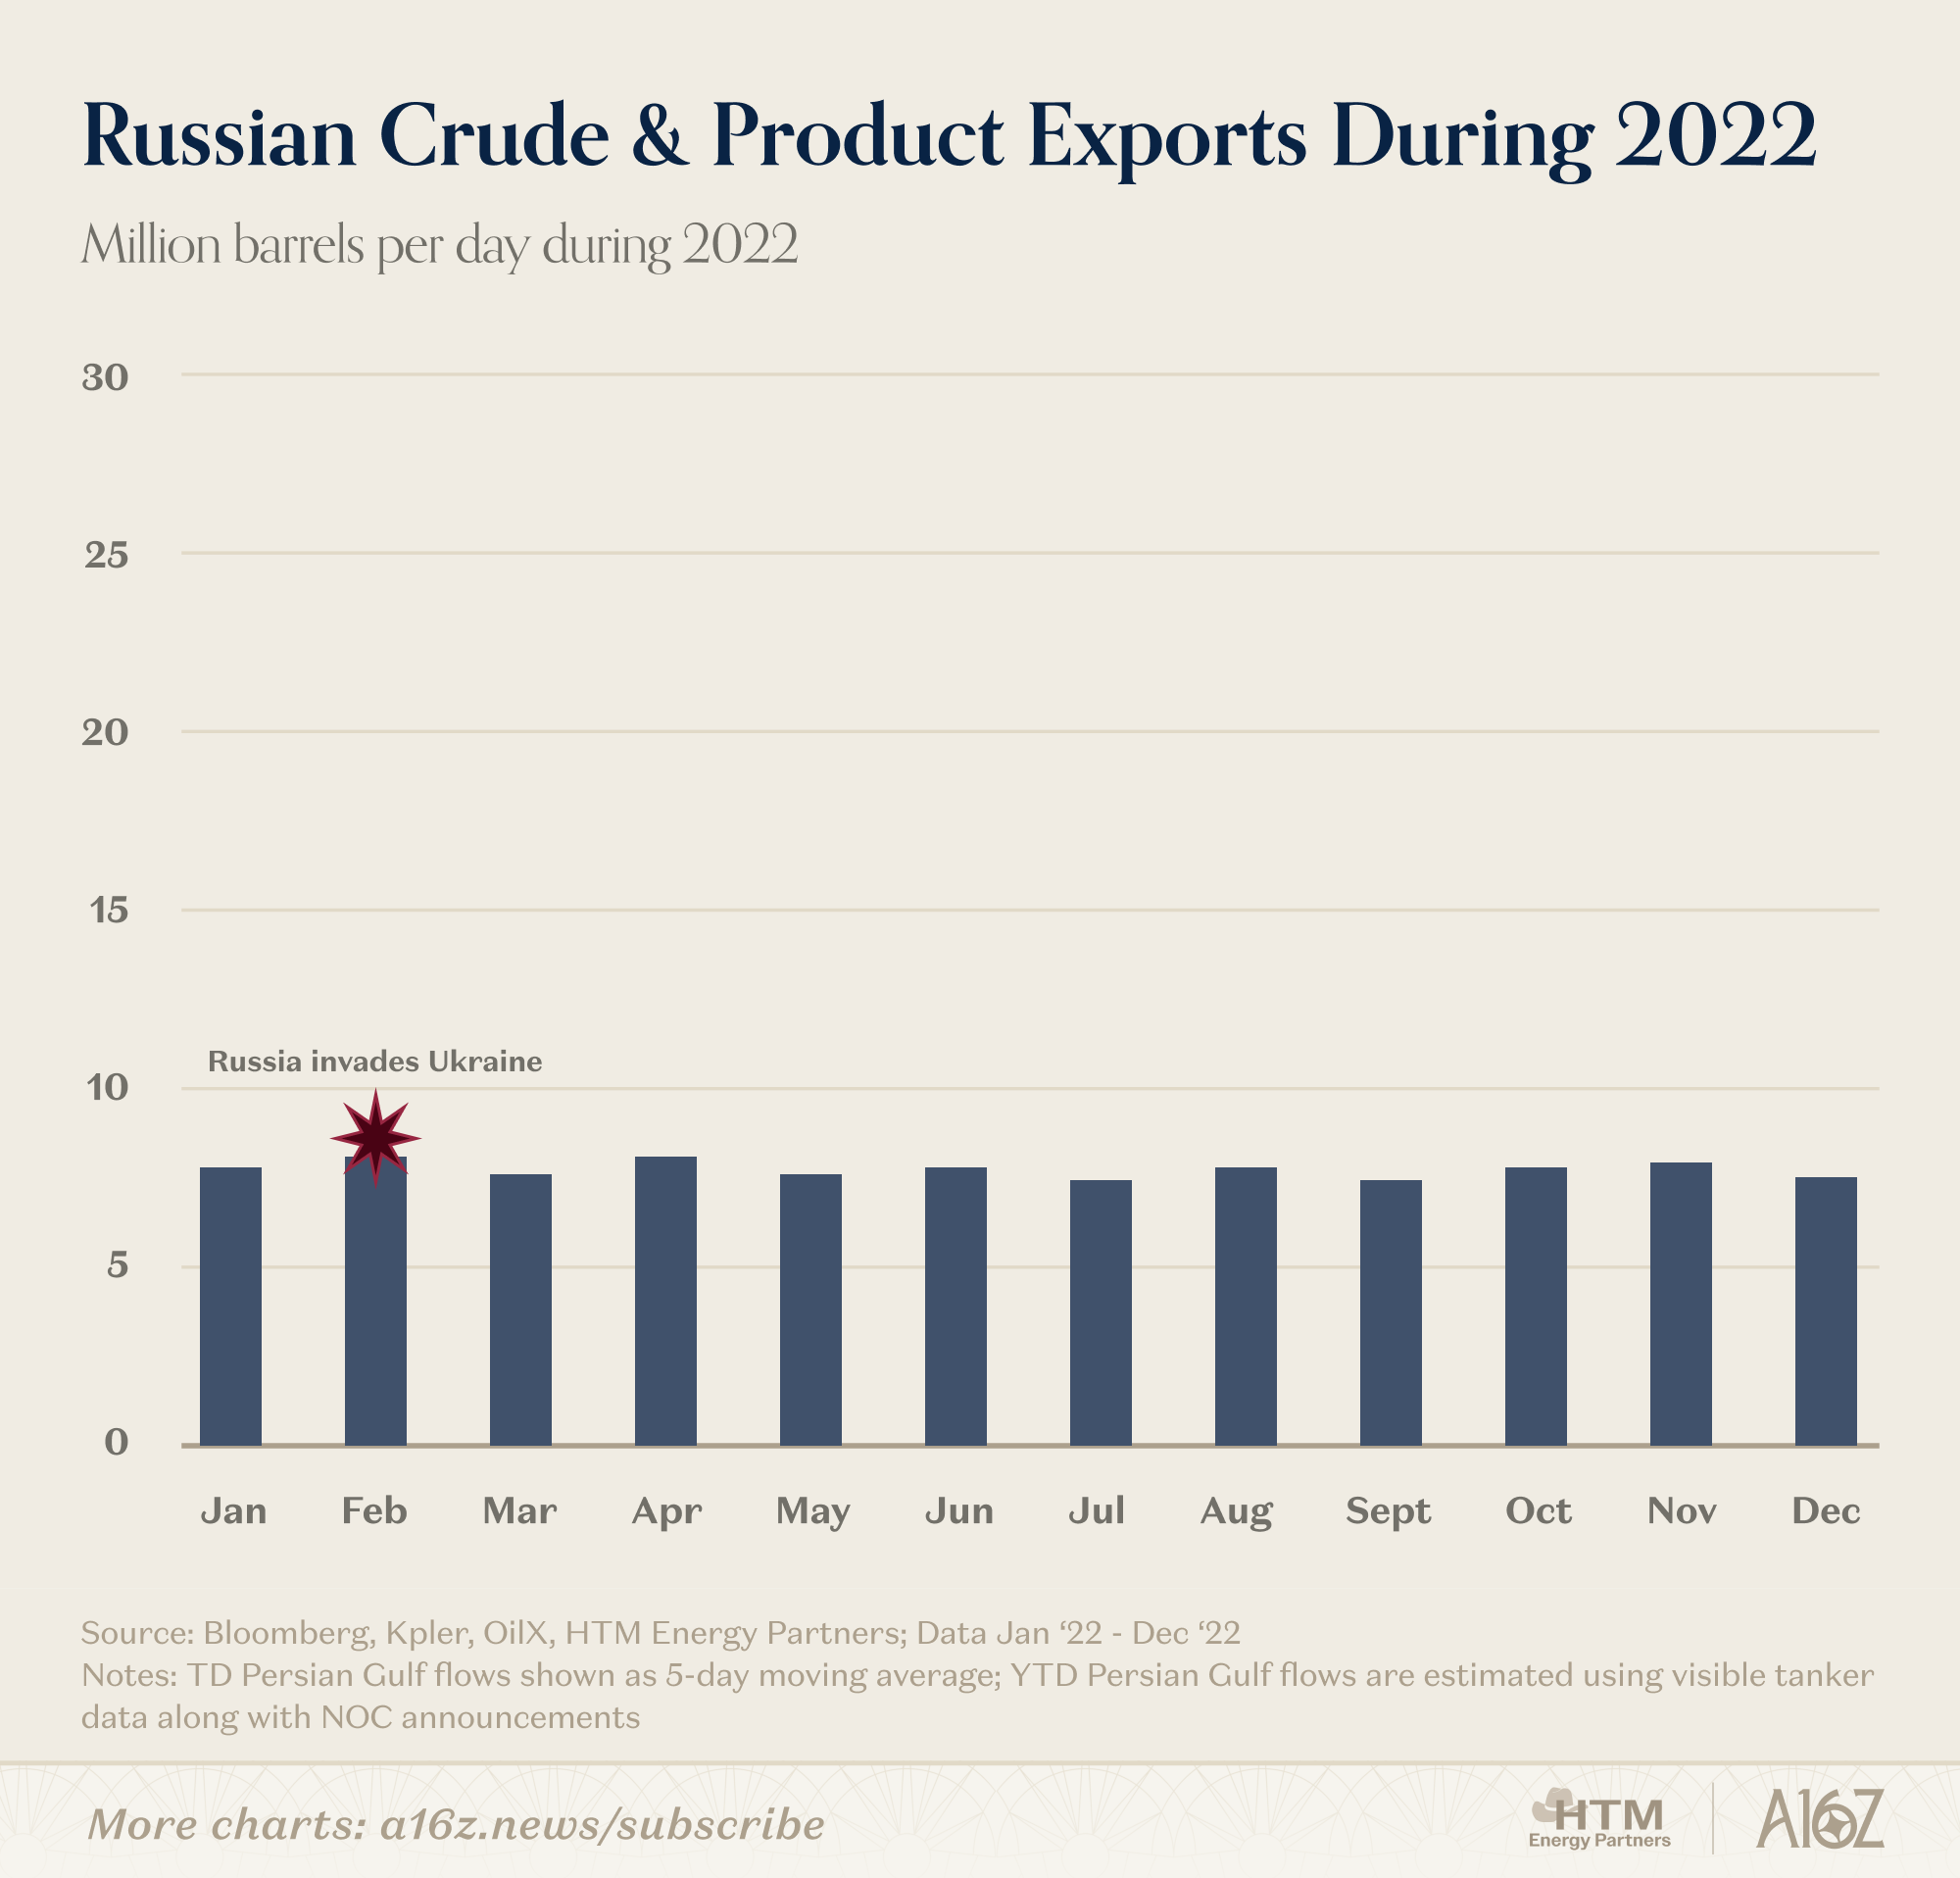
When Russia invaded Ukraine, the market initially priced in a loss of ~2–3 mmbbls/d of global supply (<3%). That loss never fully materialized. Russian exports were rapidly re-routed to China and India, and production recovered within weeks. Physical supply remained largely intact, even as flows were reshuffled. The beauty of the global oil market is that it’s fairly malleable; as long as oil can reach the water, it will be worked into flows.
Despite a near-zero loss of Russian production, WTI crude traded >$120/bbl during the spring of 2022. The difference is duration. Many believed that broad global sanctions would make Russia’s production losses durable, and that Russia would not succeed in evading them. The market was ultimately wrong, and their supply losses were not durable.
Today, there is an observable physical stoppage — a material disruption in both production and exports. Unlike 2022 when production simply found a different home, today there’s a very real 10-15 mmbbls/d of oil missing from the global oil market: a number so large that it’s almost impossible for analysts to underwrite any solution that isn’t a speedy one. Unlike Russia, which easily found buyers for their crude outside of Europe, today’s supply shock is seeing a hostile third party come between the willing exporters of crude, and potential buyers.
While Saudi Arabia and the United Arab Emirates are using their alternative export terminals (Yanbu and Fujairah) to deliver as much supply as possible into the market, Strait crossings still remain impaired. Despite this, the implications of a prolonged closure are so severe that even with an immediate, visible, and unresolved blockage in the Strait of Hormuz limiting >10 mmbbls/d of production, the oil market is, all things considered, remaining relatively calm.
Glut-be-Gone, How the World is Backfilling Supply
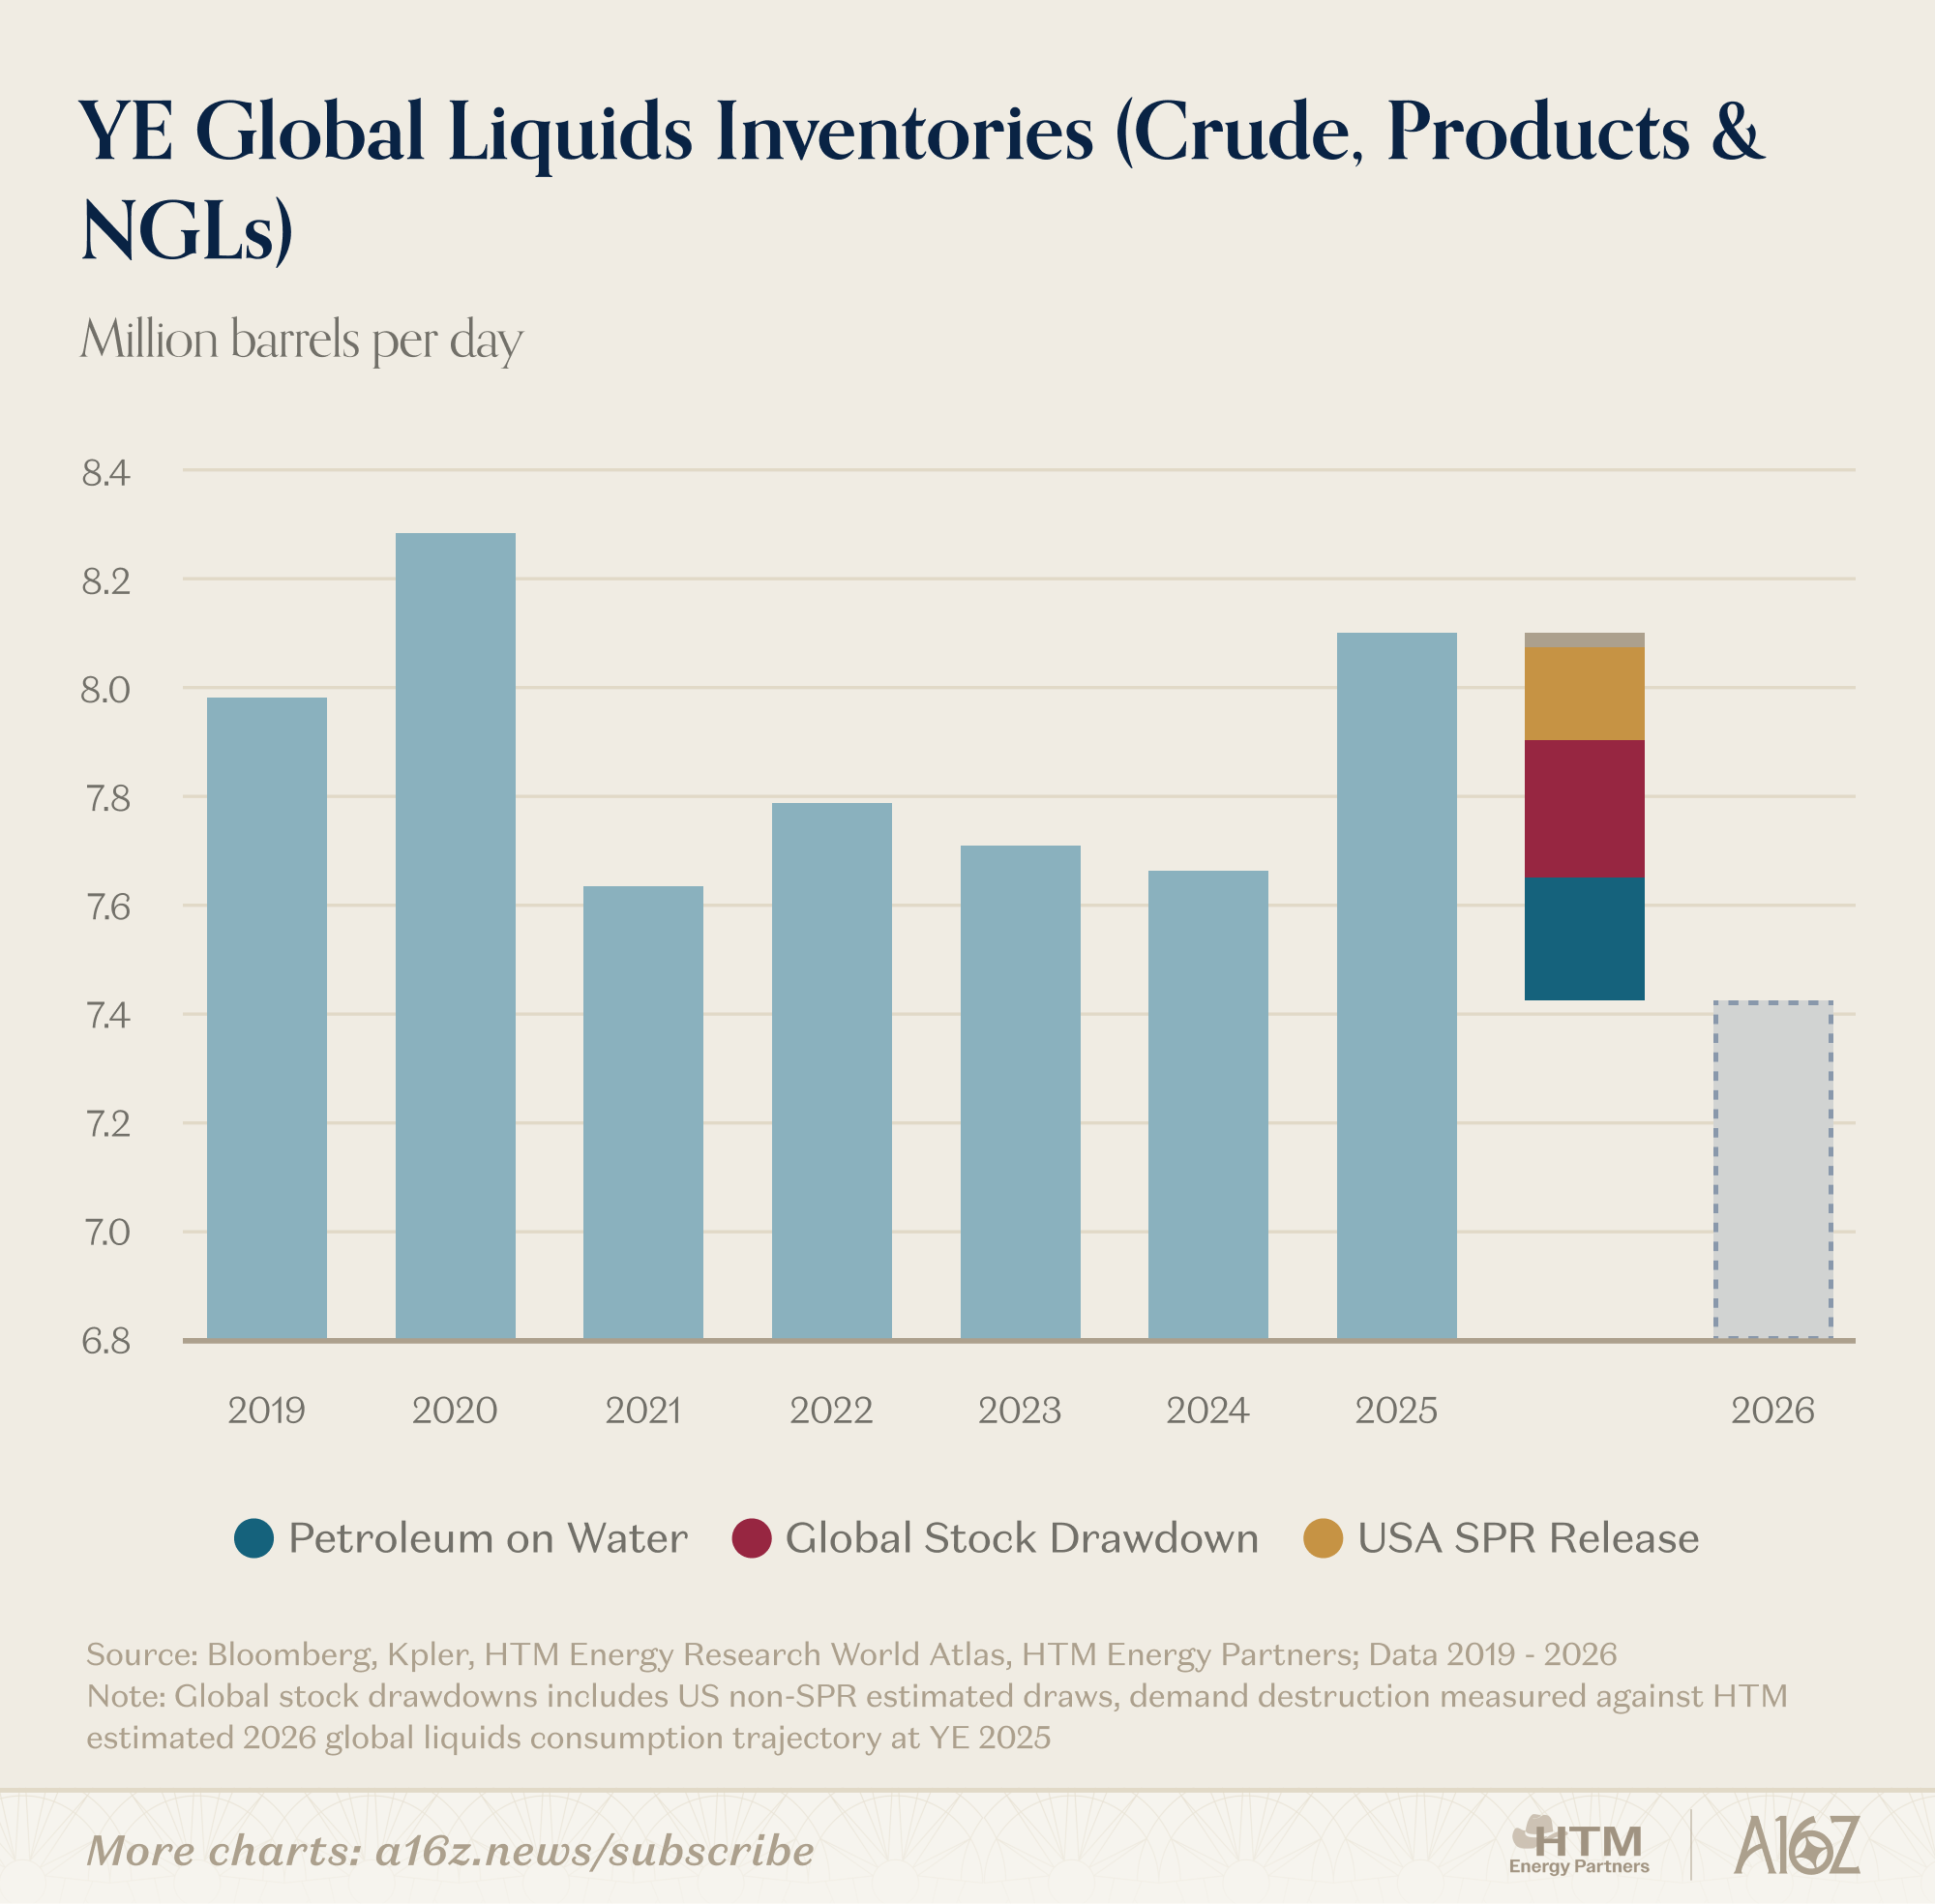
Going into 2026 the US Energy Information Agency (EIA) had expected the global oil and liquids market to average ~2.5 mmbbls/d oversupplied. That narrative has quickly disappeared, and the world is beginning to draw down its strategic crude oil and petroleum product (i.e. diesel) stockpiles.
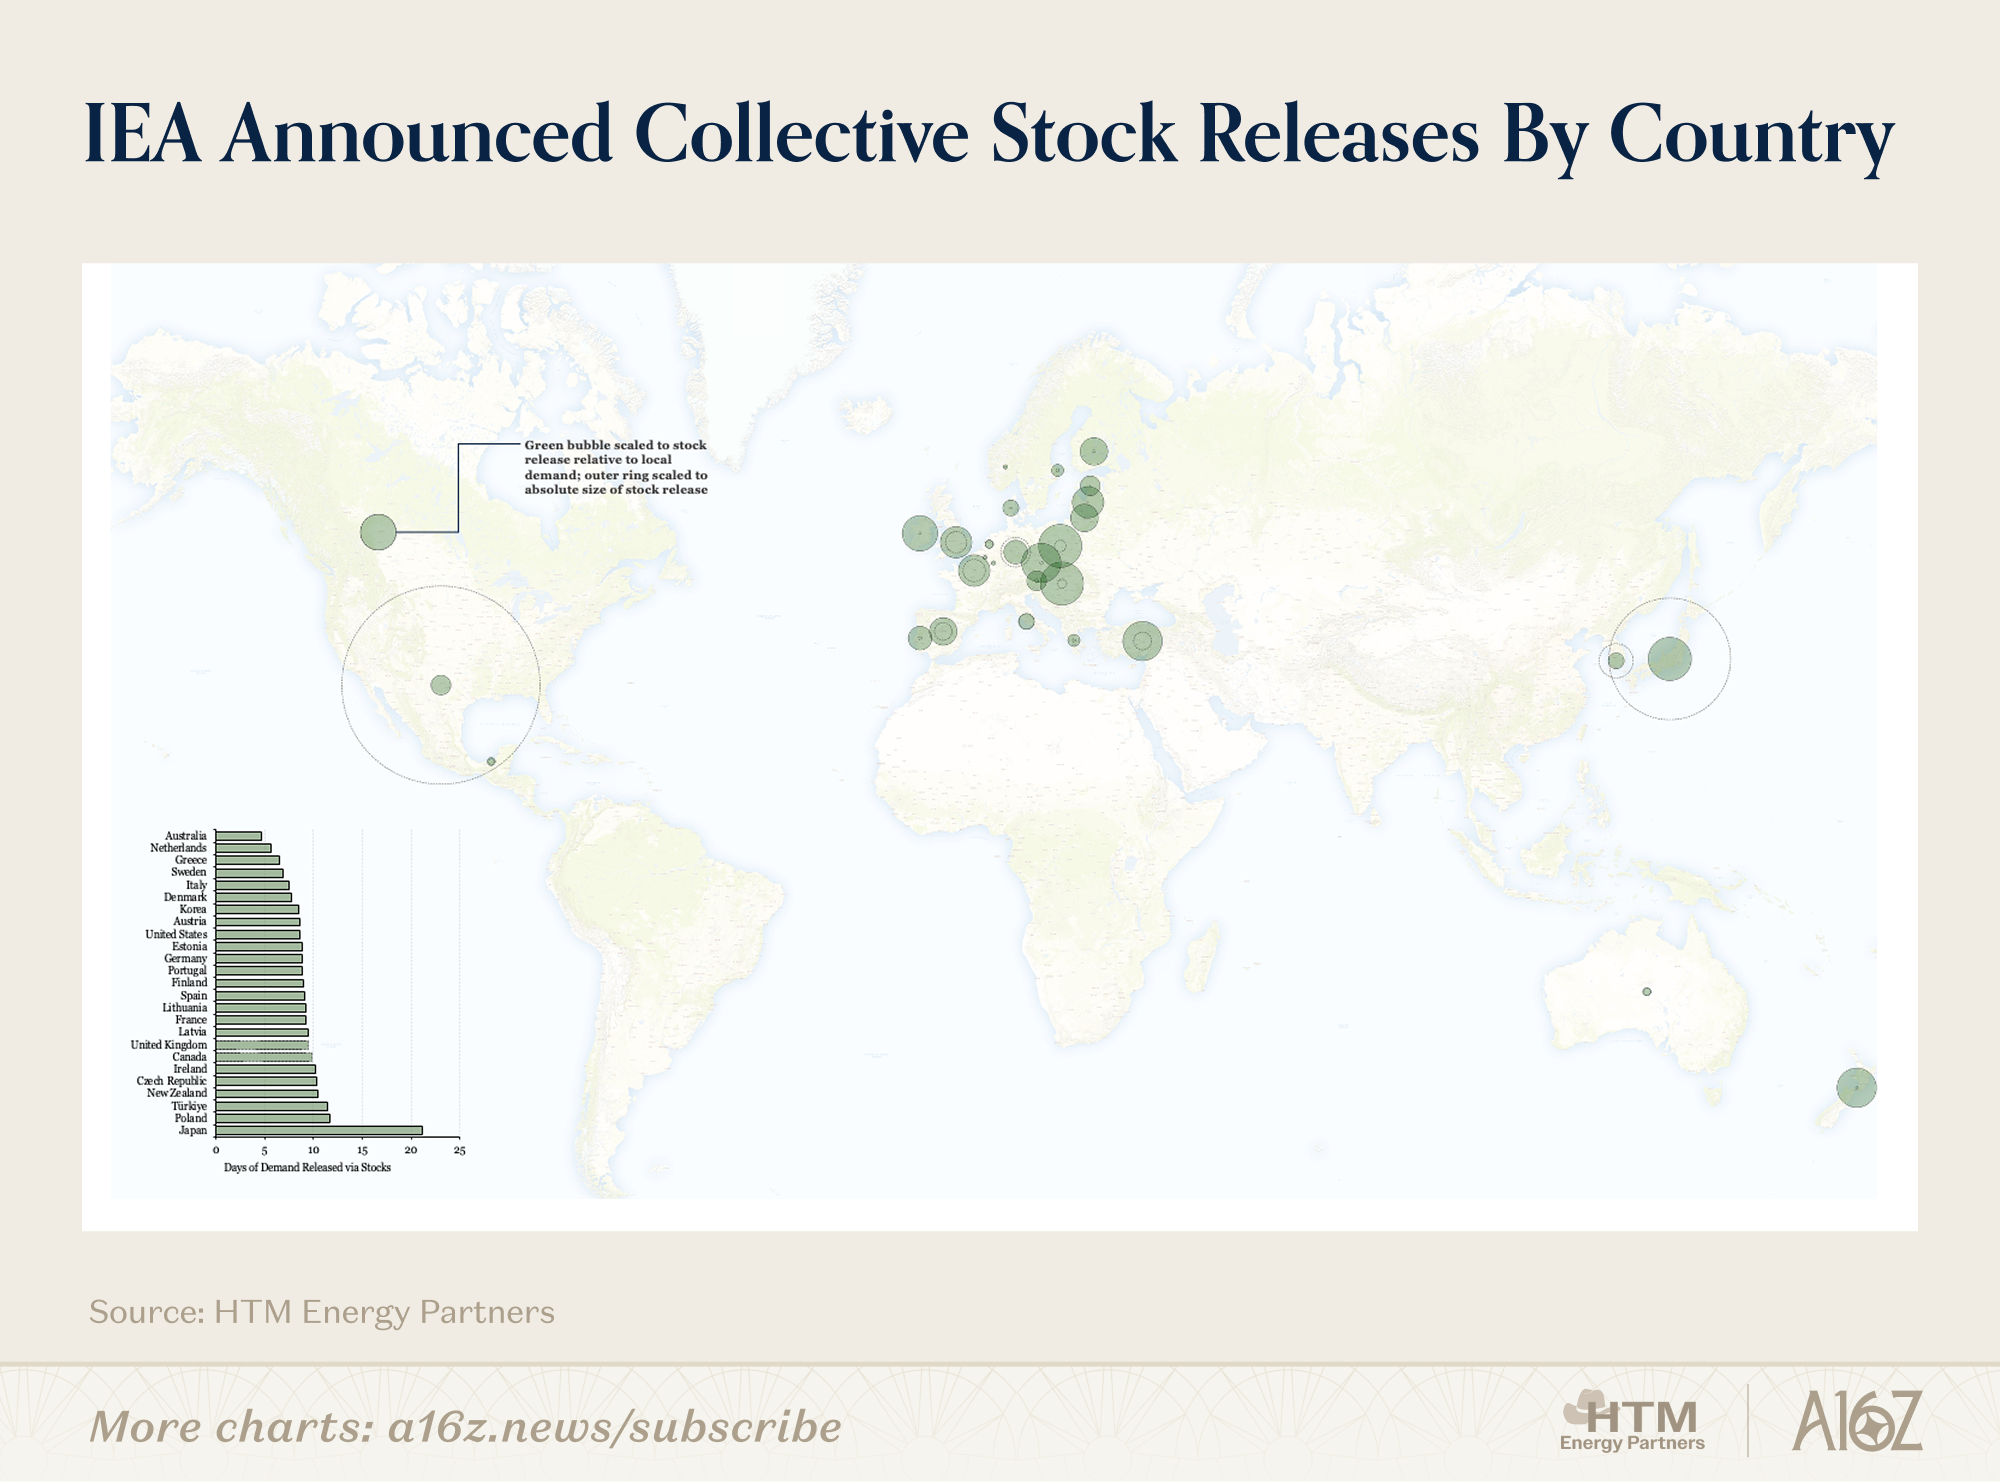
Last week, the International Energy Agency (IEA) announced its member countries would facilitate a collective release of ~400 mmbbls in liquids stockpiles. That covers roughly 1 month of lost Gulf supply. Coupled with the un-sanctioning of Iranian and Russian oil on water (~100 mmbbls), the world has backfilled ~45 days of lost Persian Gulf production (without accounting for transit times).
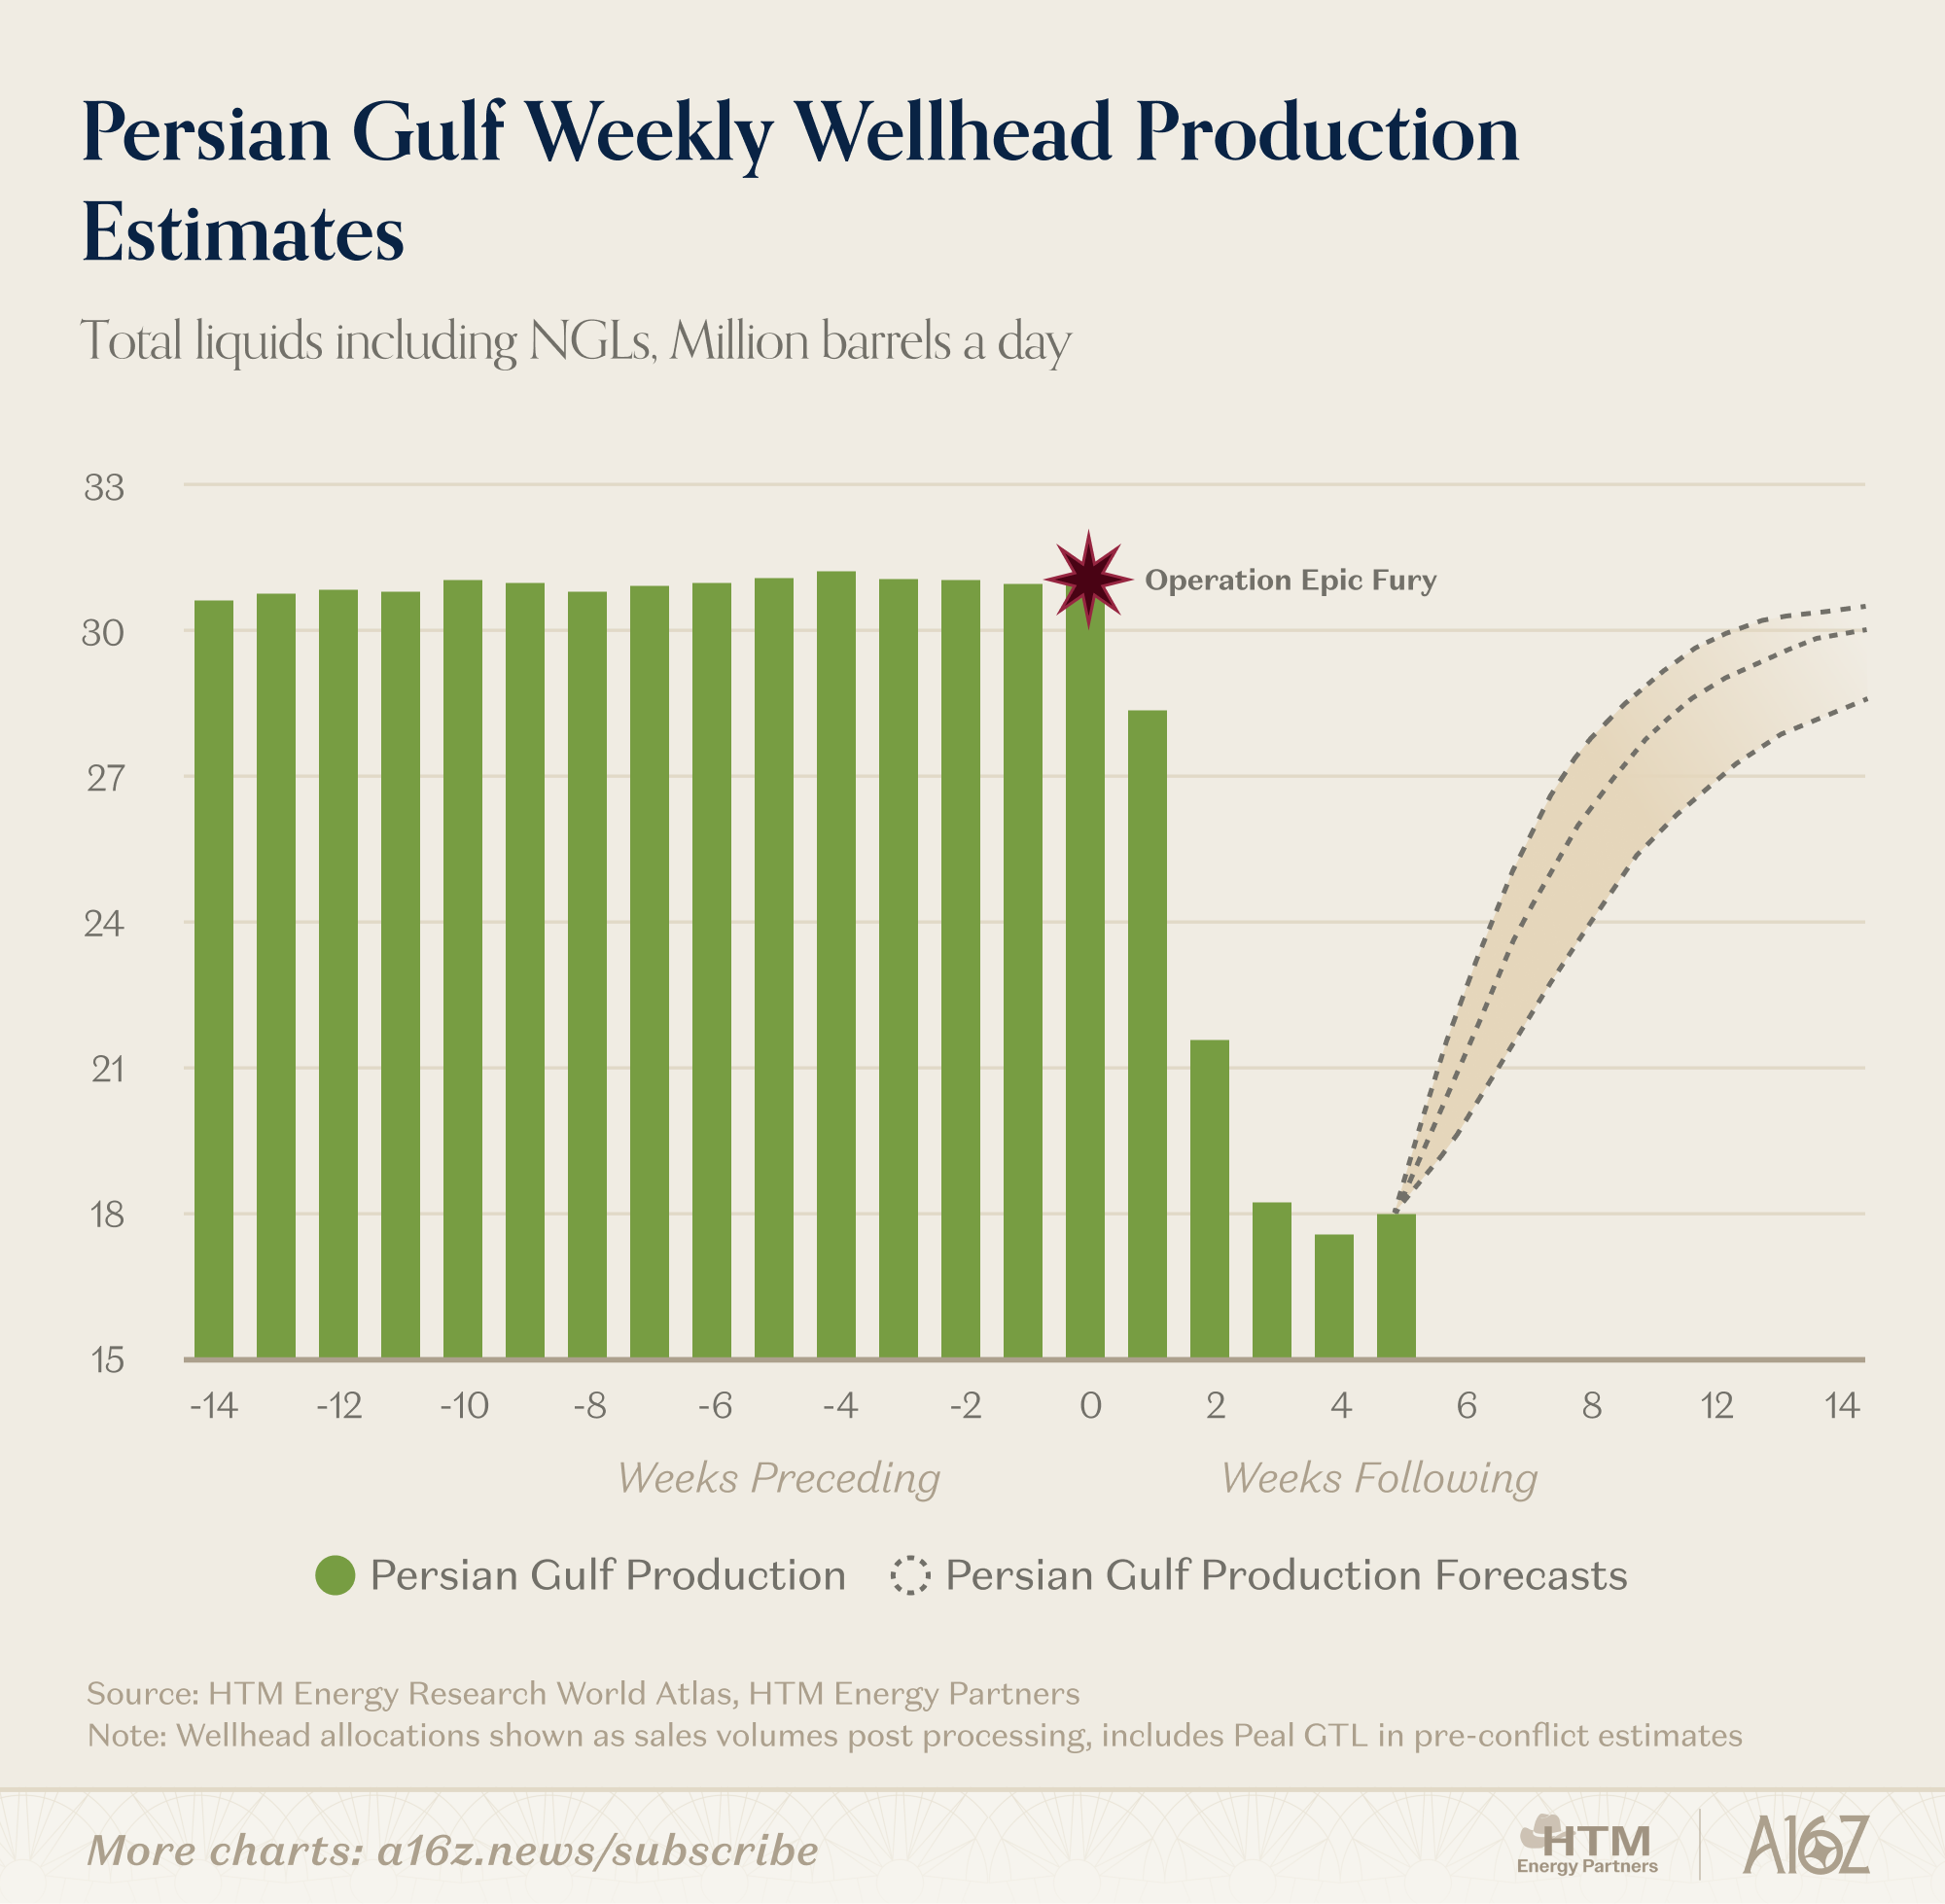
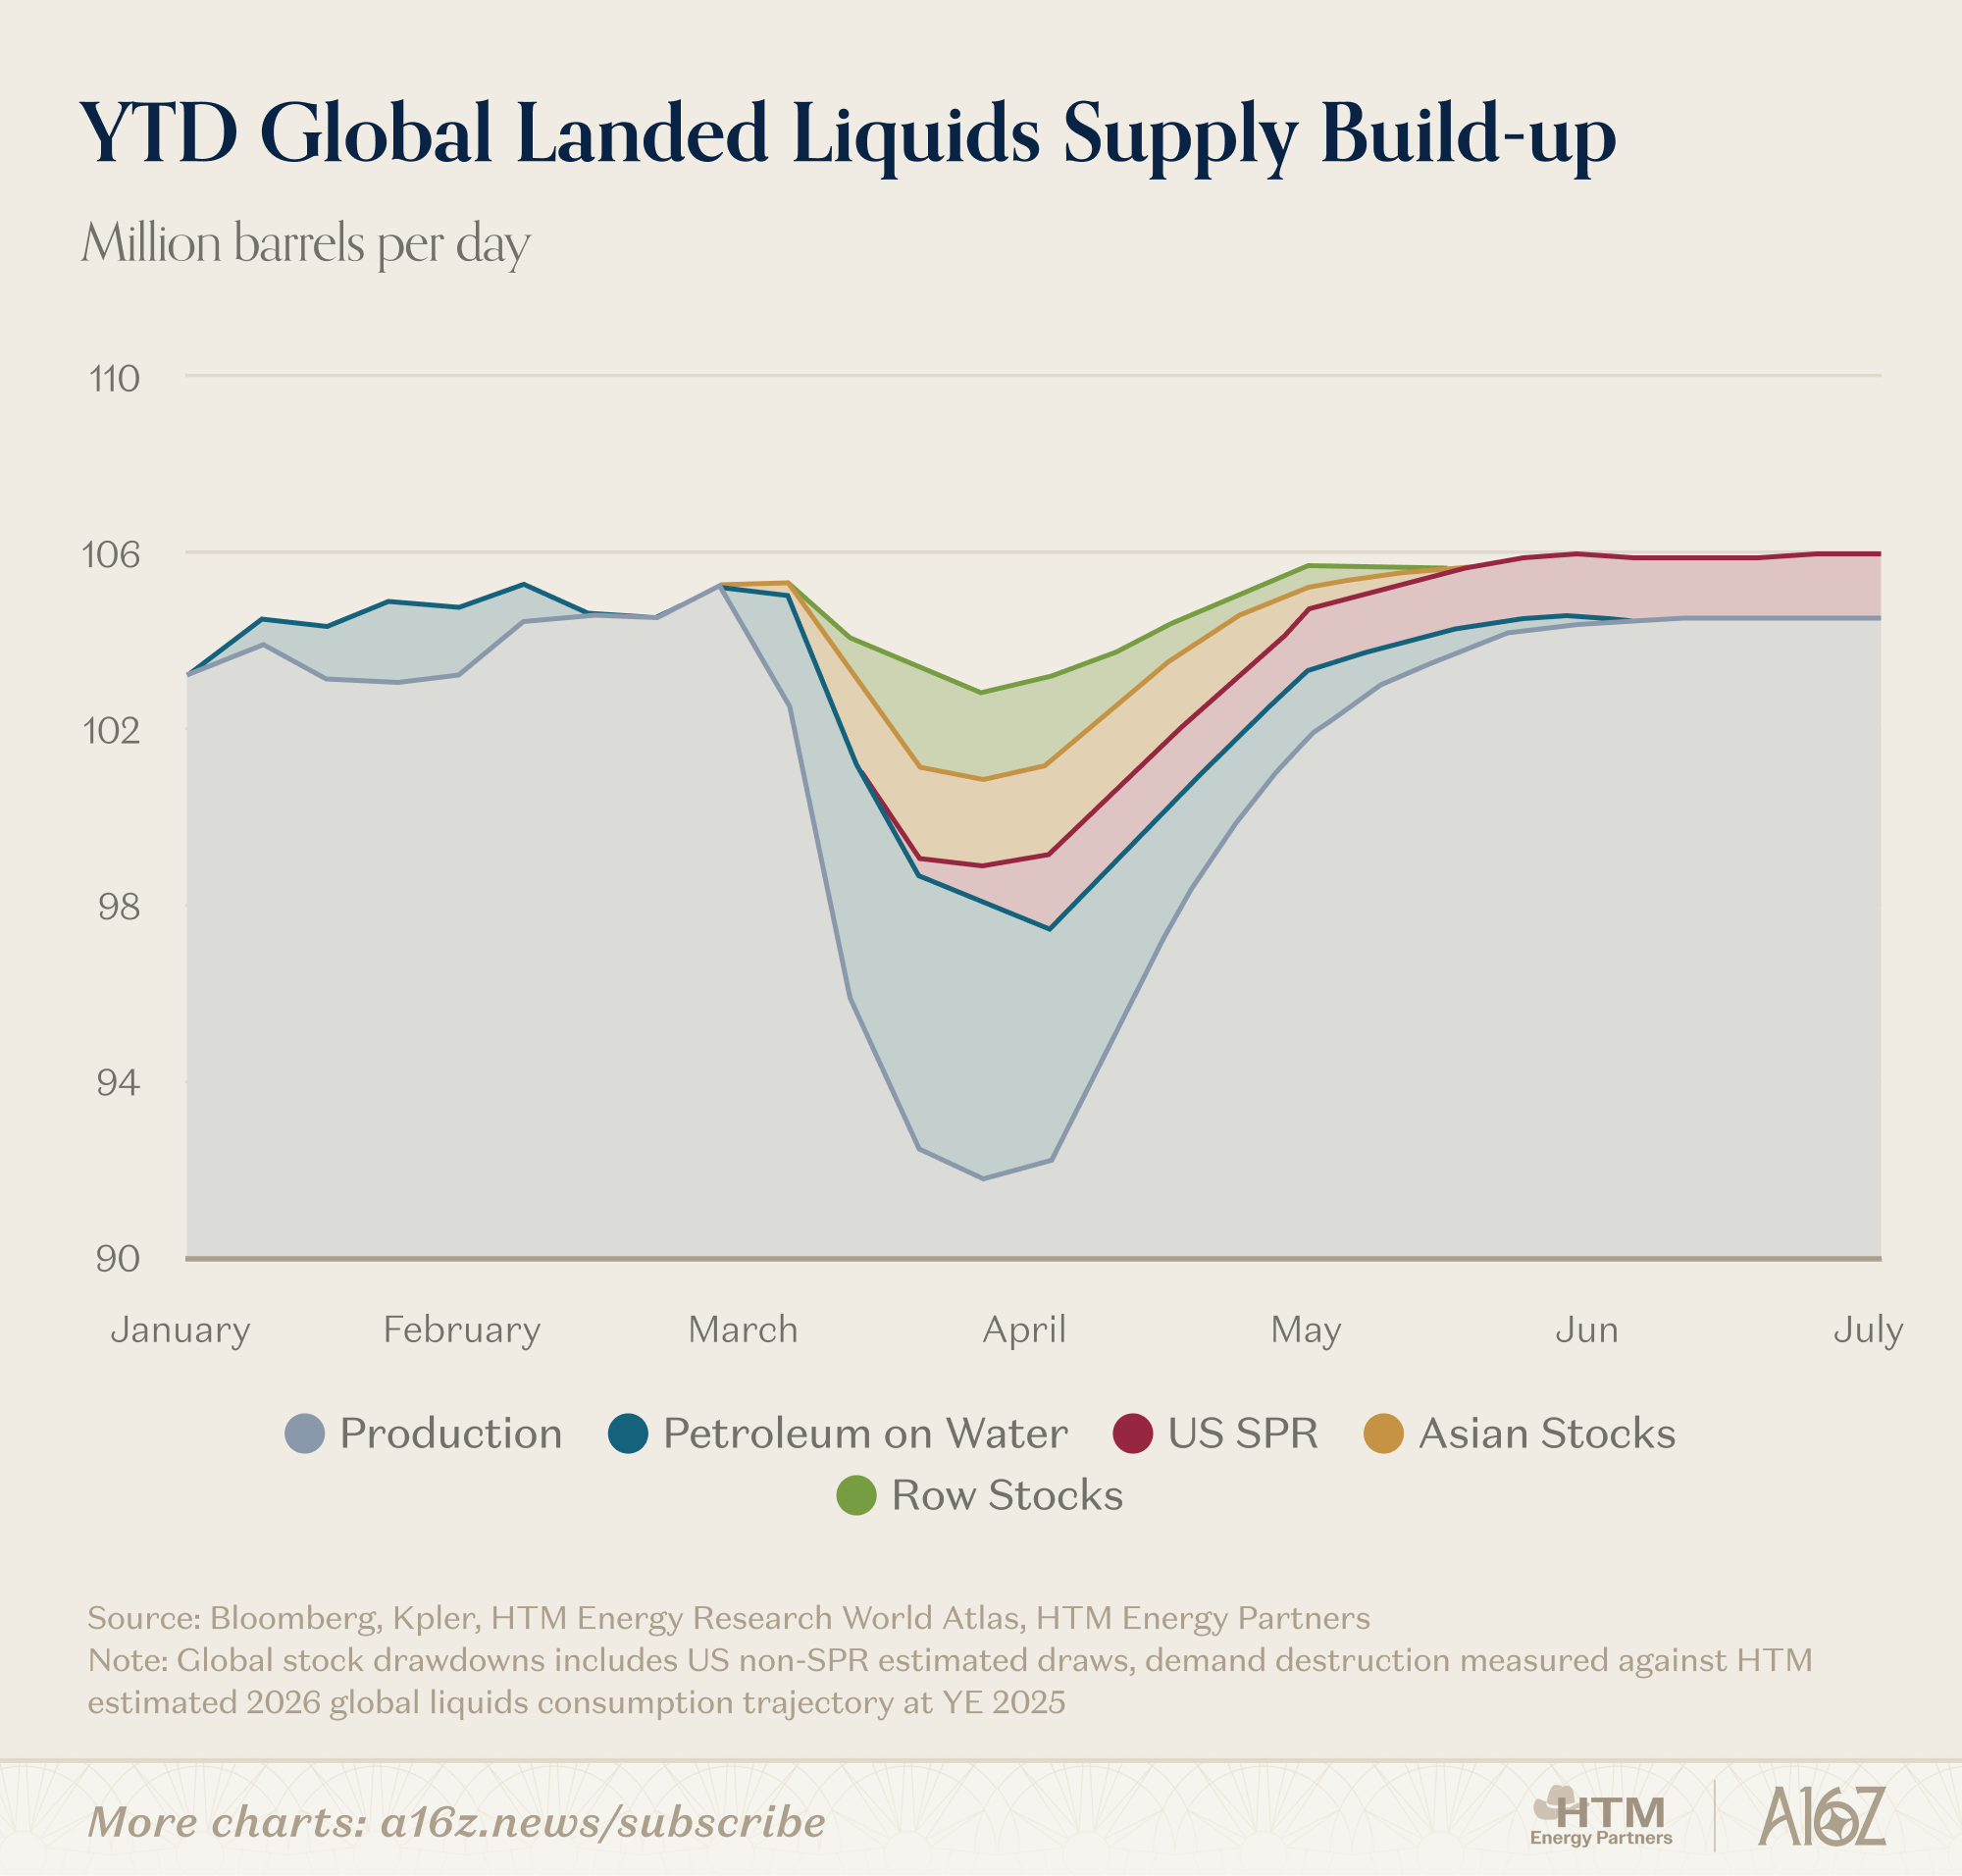
While Gulf producers initially diverted output into onshore tanks and floating storage, full field-level shut-ins quickly became unavoidable. By our math, the Gulf has shut in ~12.5 mmbbls/d of liquids production (including NGLs and refinery gains).
These are field-level losses, not export disruptions — barrels that didn’t come out of the ground. Compare that to 2022, when Russia invaded Ukraine; the cumulative loss of production in the 24 weeks following their initial military action was ~95 mmbbls. Just 24 days into the Iran war, and cumulative liquids production losses already tally ~285 mmbbls. In the forecast scenarios shown below, the black dashed base-case assumes a March 28th resumption of full tanker activity, with our field-level production resumption forecasts moderating ramp times.
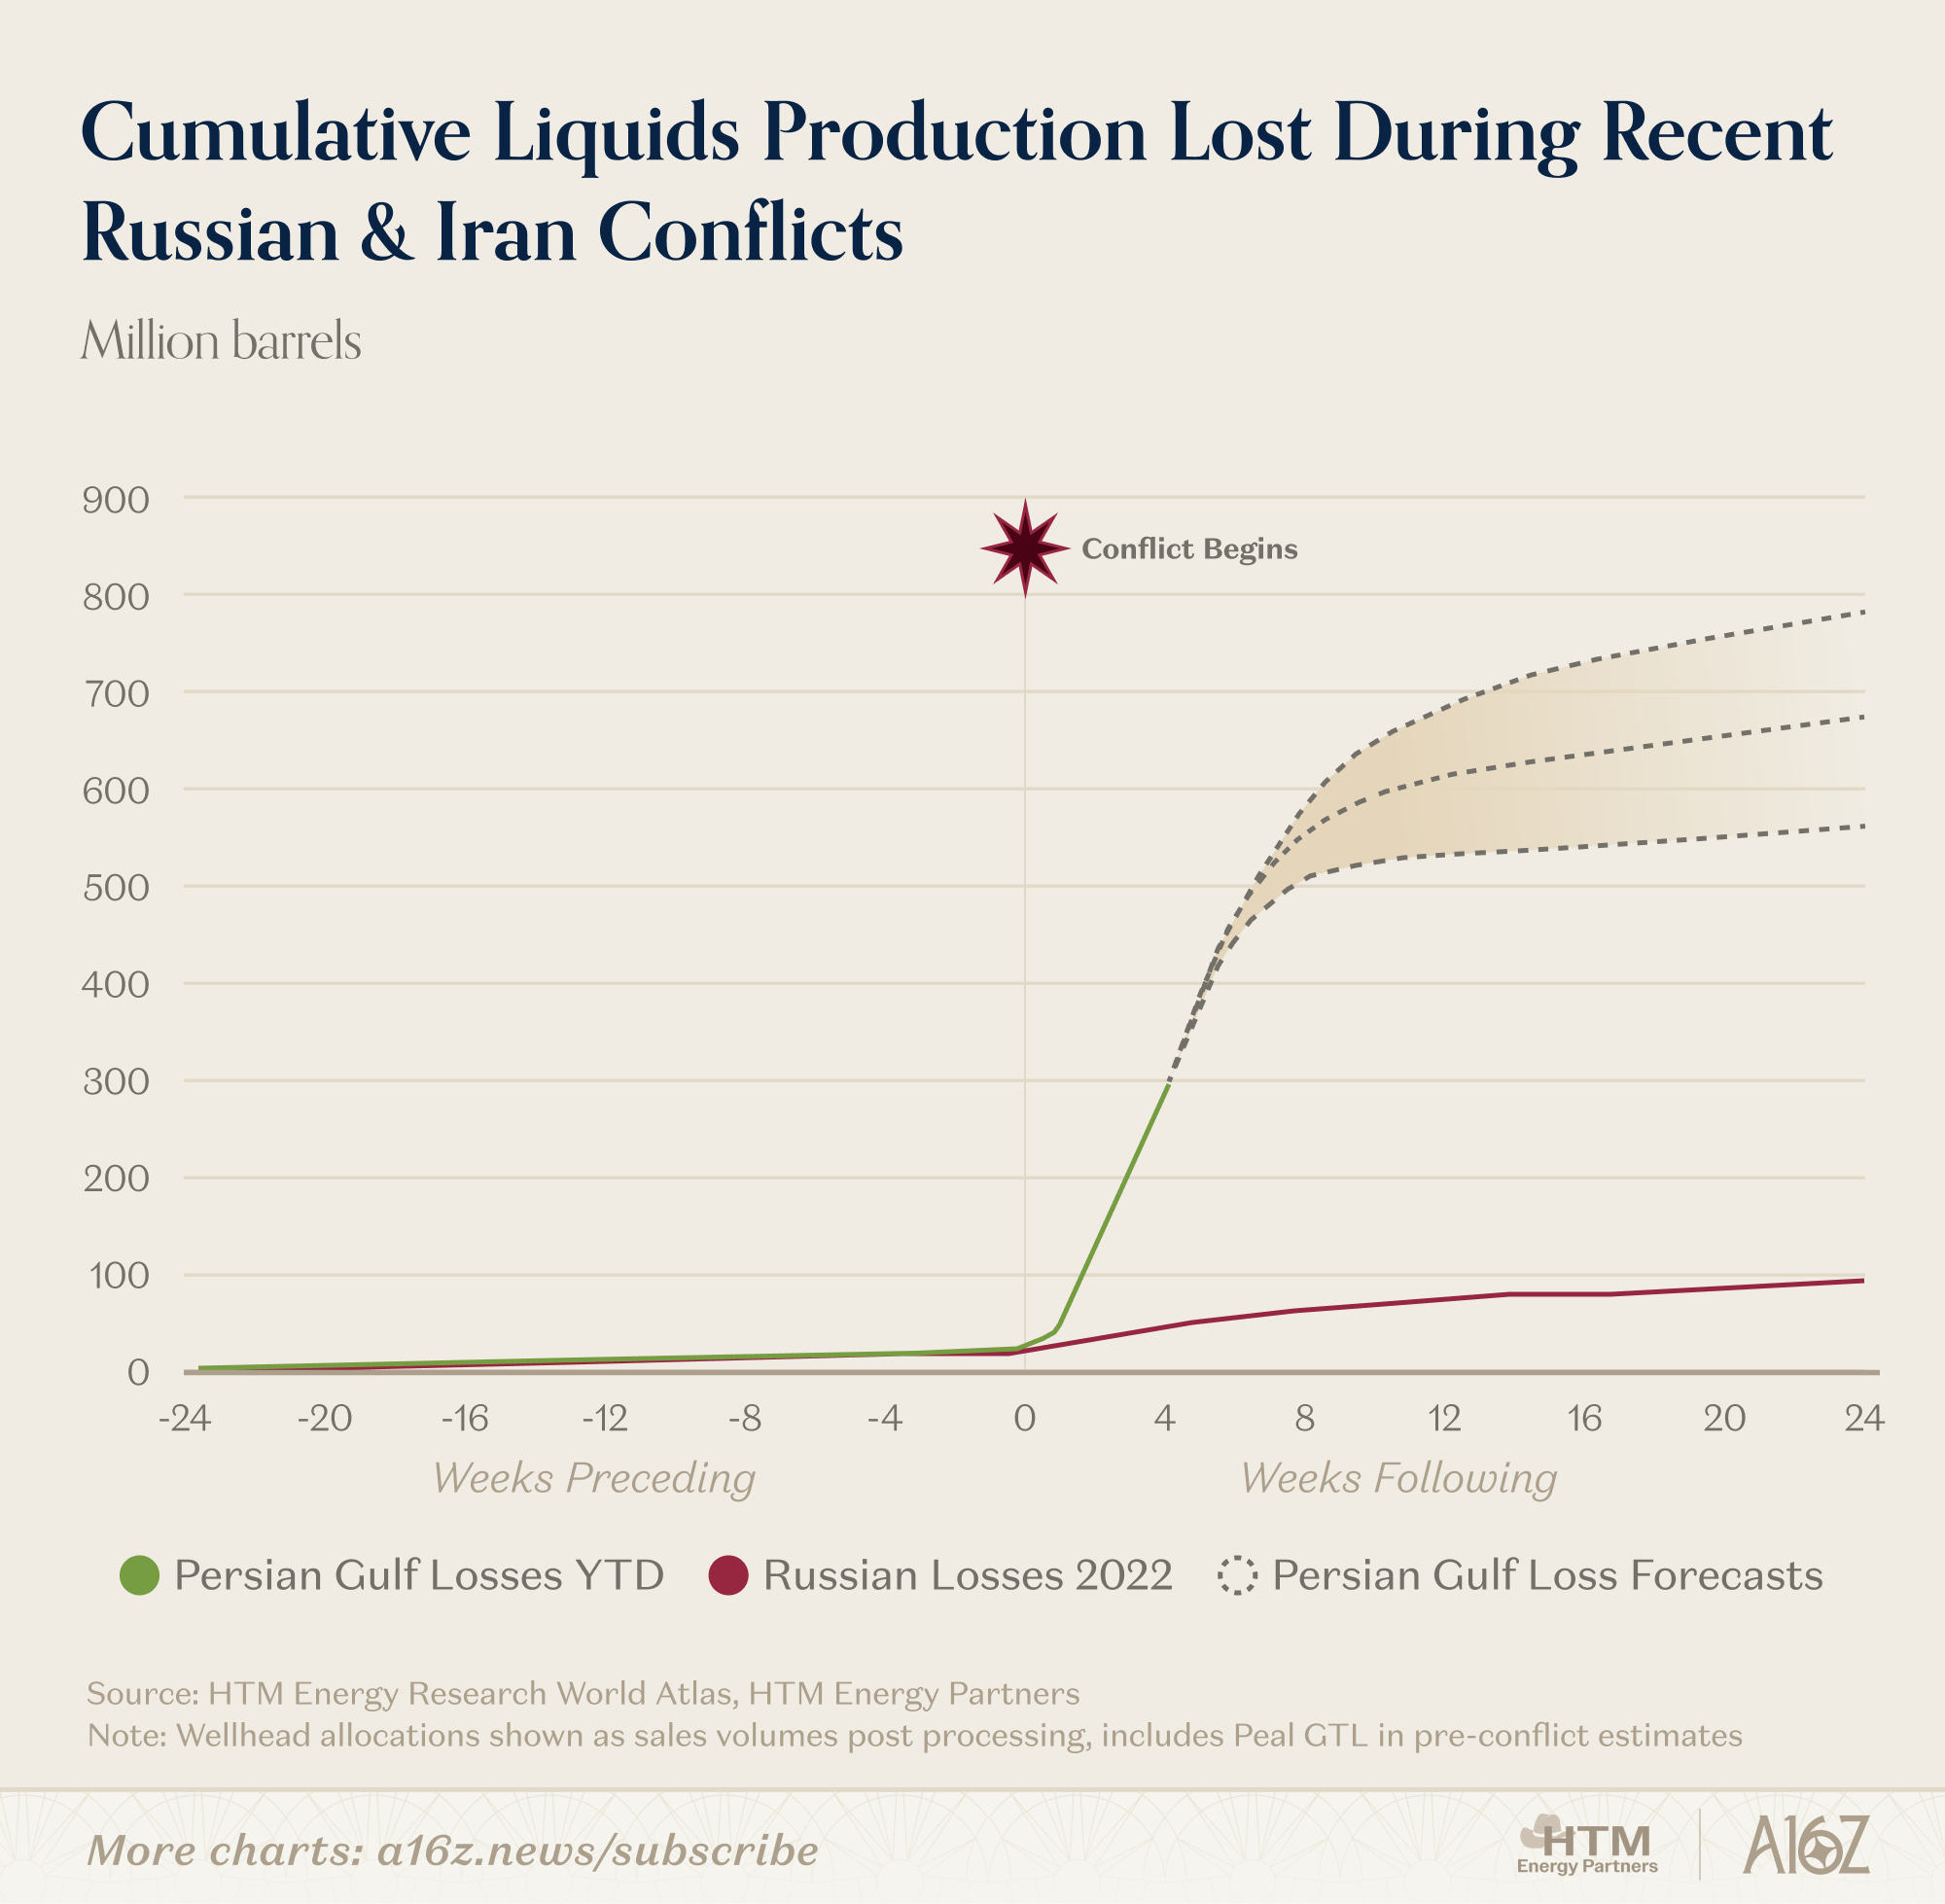
All said, even in a nearly ‘immediate opening’ scenario, where the world normalizes in 24 hours, there will be ~700 mmbbls of liquids that everyone expected to be produced in 2026 but weren’t. Going into 2026, markets expected to exit the year with global liquids inventories building by ~11%, instead, in the best case, inventories will likely decline by ~9%. Every week that the Strait’s opening is delayed, means another 60-85 mmbbls drawn from stocks; or fewer than that, if the world starts to run out of petroleum inventories. The “more worse” case scenarios are fairly mechanical. Every day the strait remains closed means fewer barrels available to consume; and further demand destruction, if not outright higher prices.
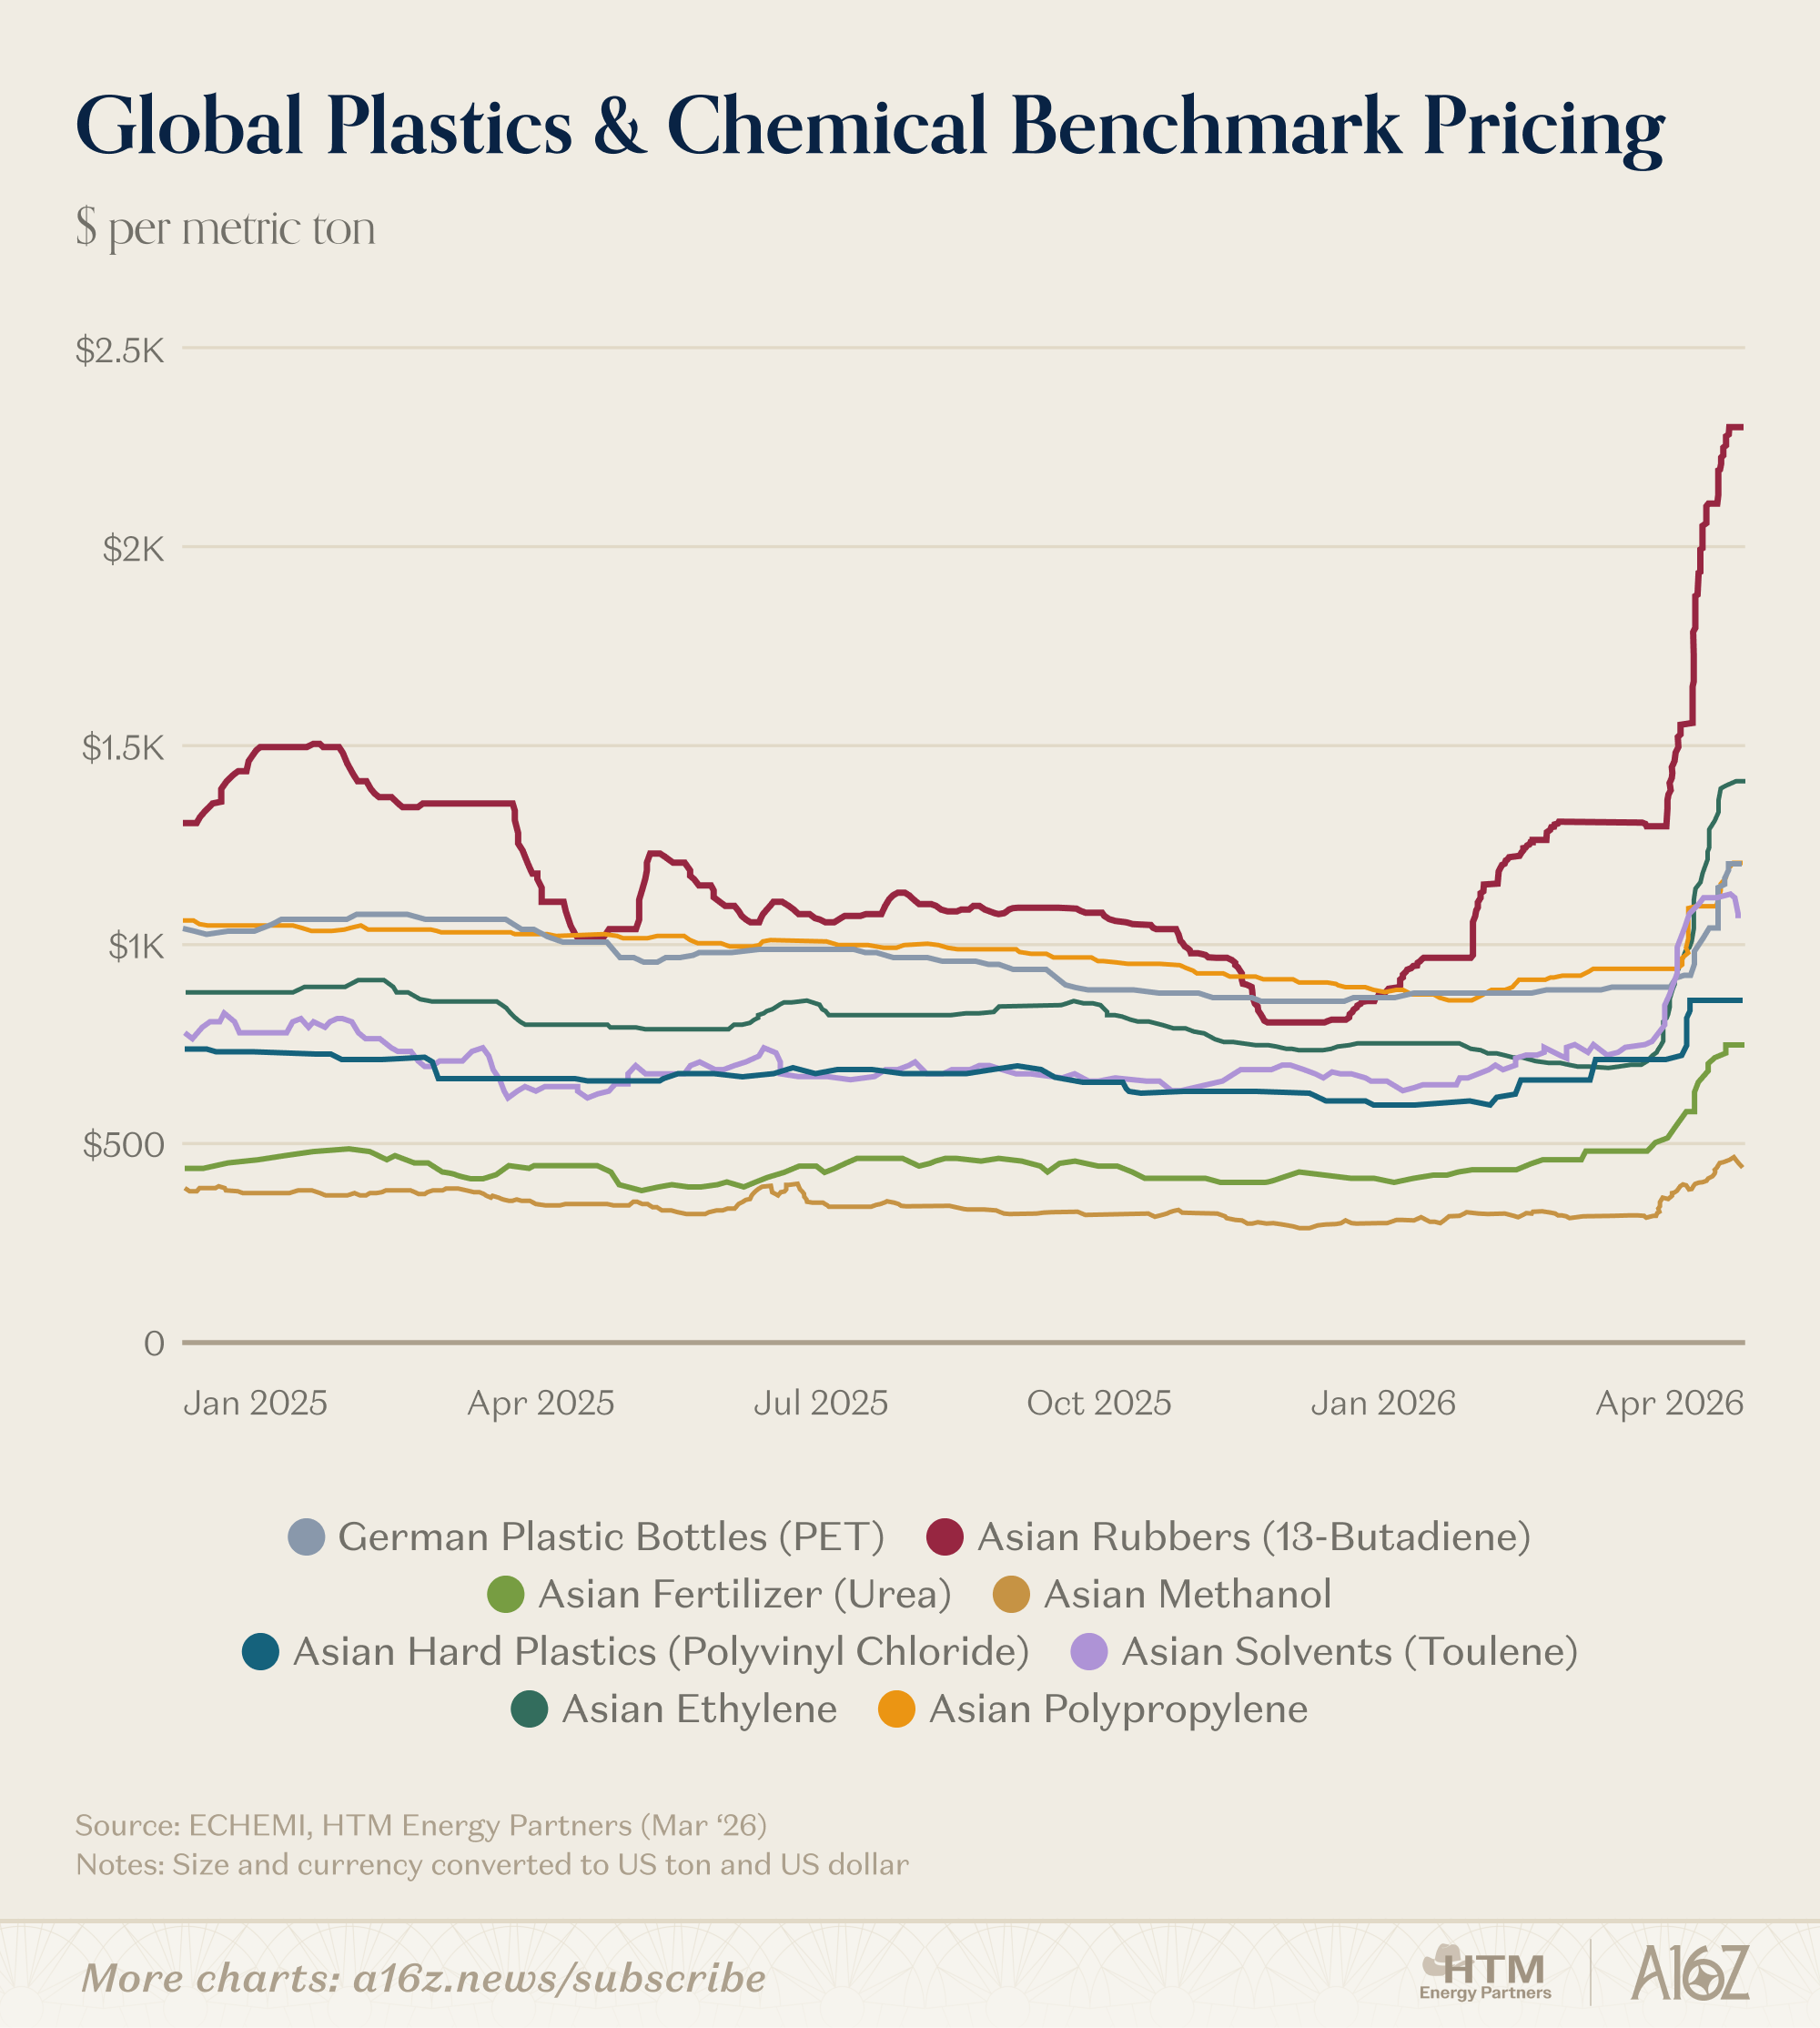
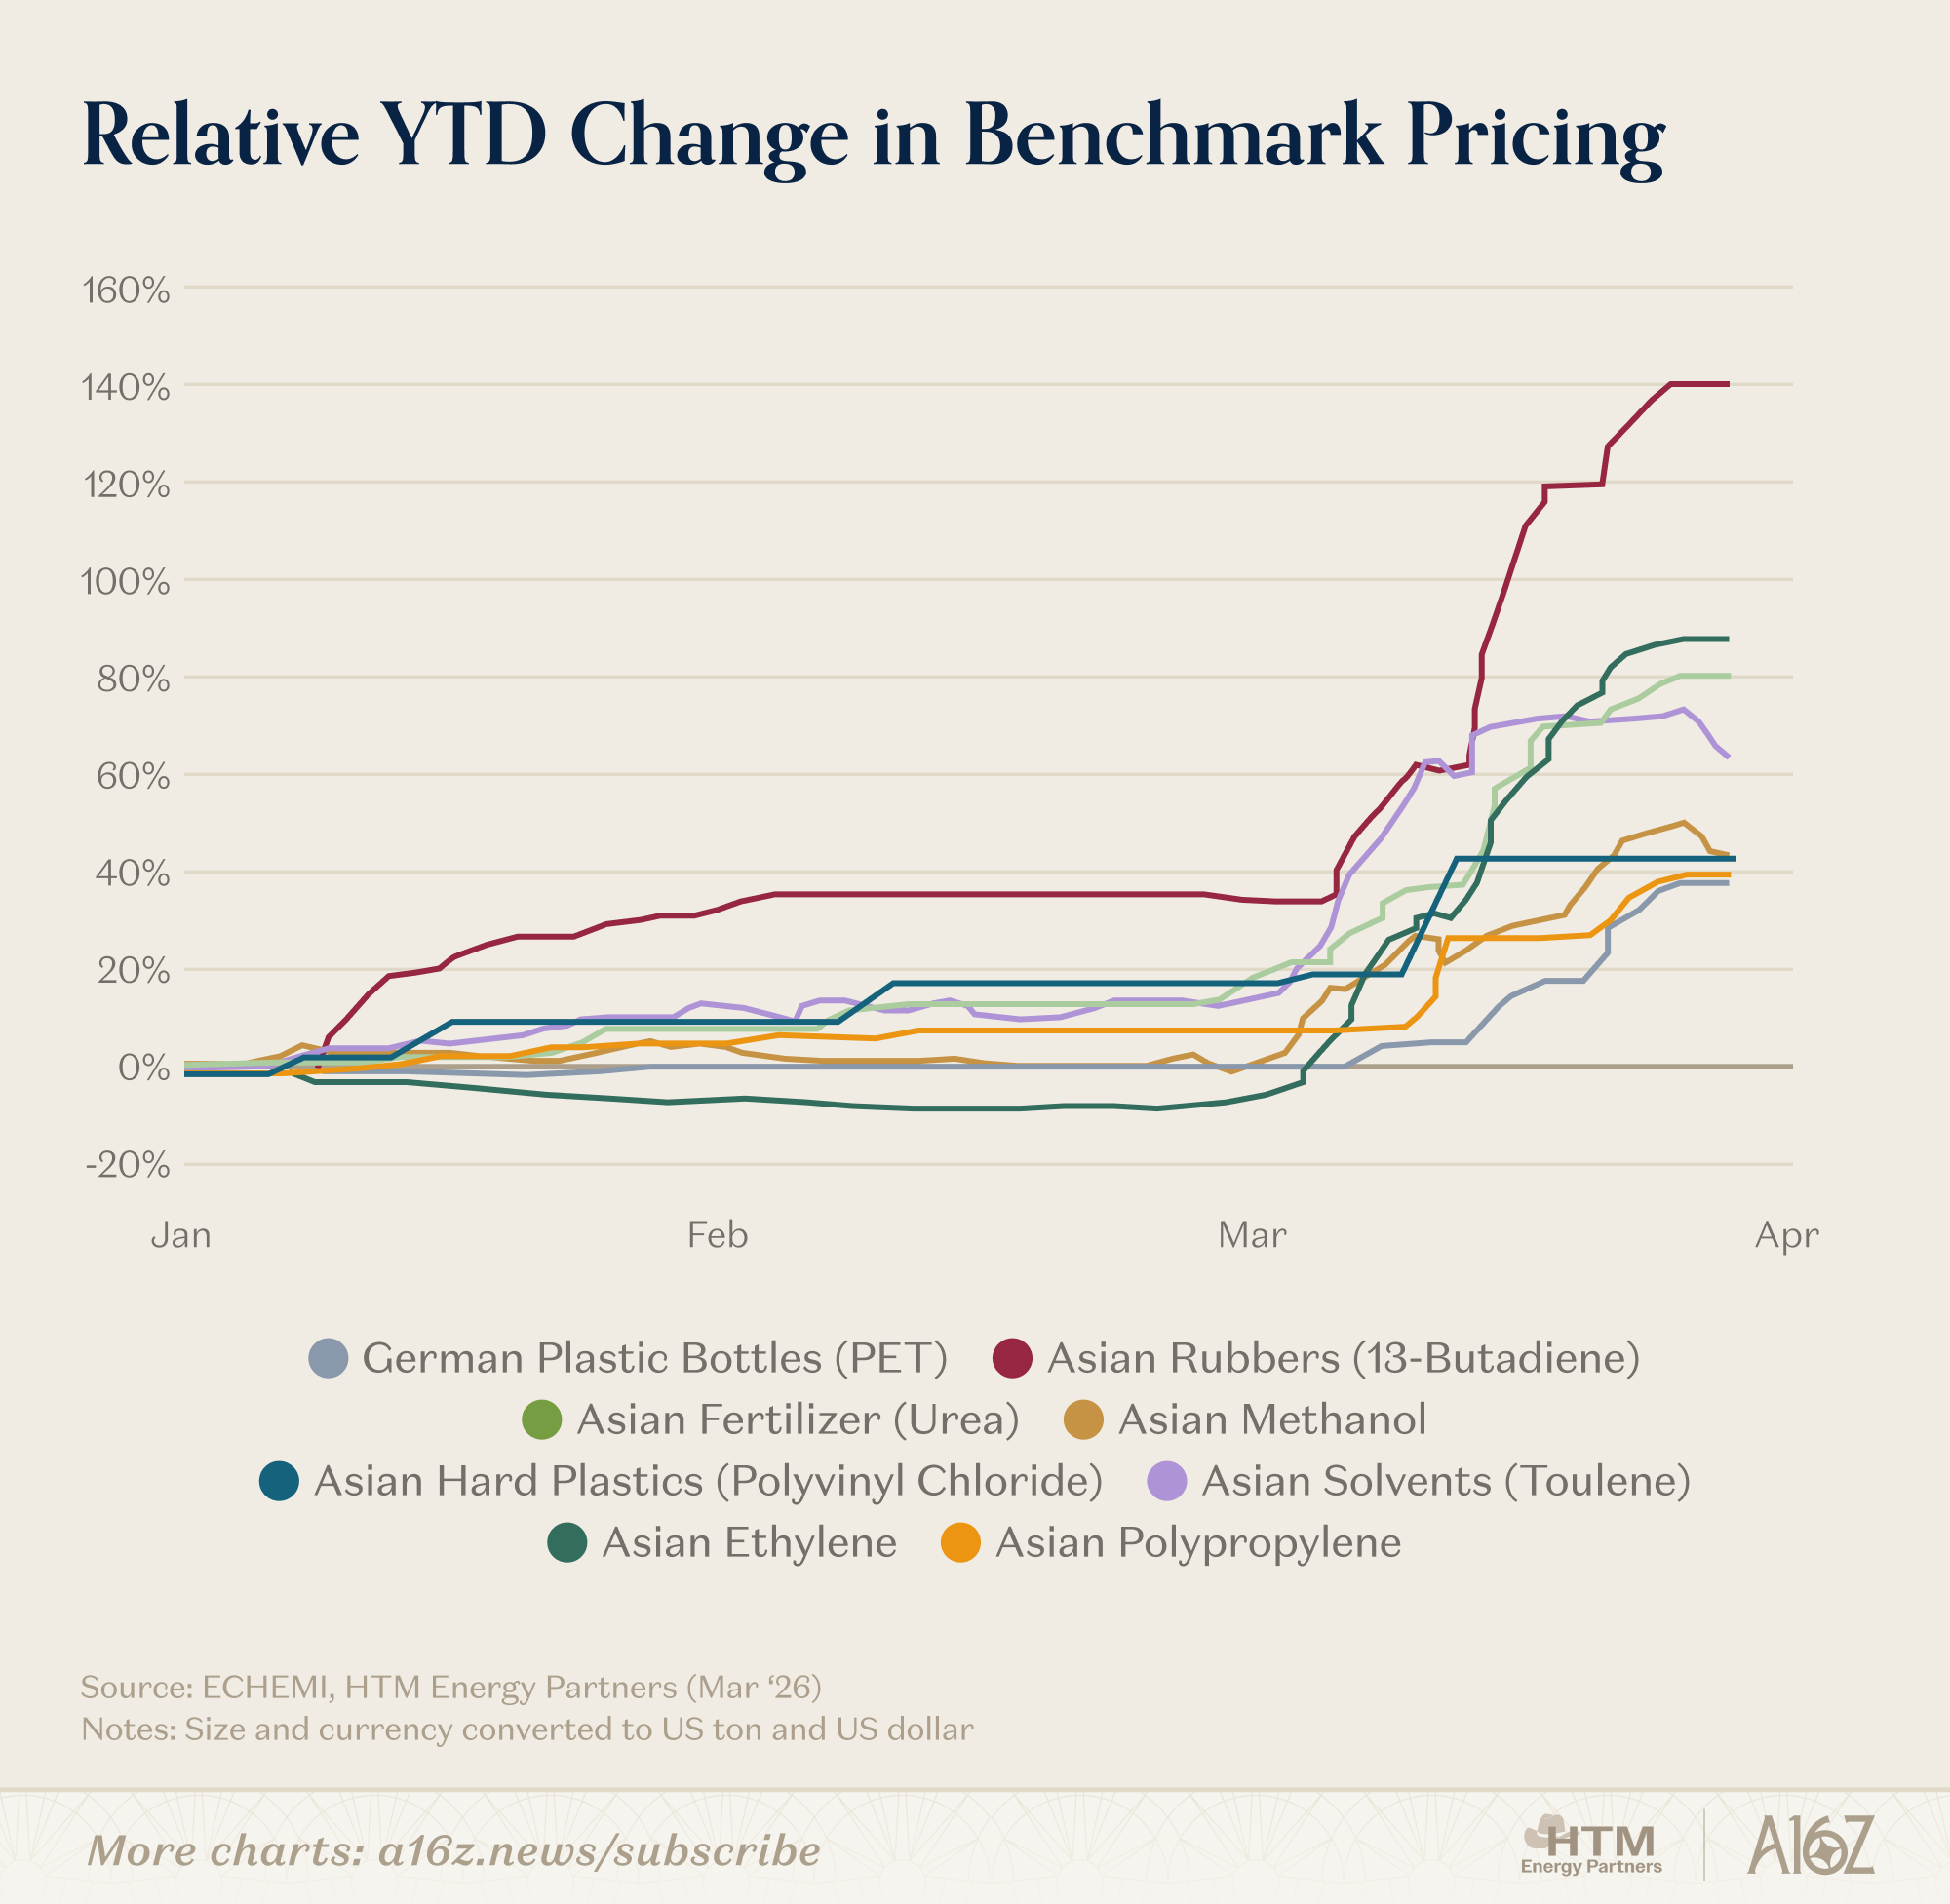
Chemical prices around the world are already going vertical, and with Qatar’s LNG trains offline it’s set to get worse. Condensate, a lighter form of oil, and primarily produced with natural gas, is a key building block in the petrochemical supply chain. Condensates, when refined, produce a high naphtha yield, molecules that then get turned into plastics.
Butadiene, the input for rubbery goods like disposable gloves, garden hoses, or even sneaker soles is up 140% YTD in China. Polyethylene terephthalate (PET), what soda bottles and takeout containers are made of, is up 45% YTD in Germany. Toluene, the base for nail polish remover, and various adhesives is up ~70% YTD in South Korea.
It can be easy to reduce the energy argument down to “oil bad, solar panels good,” but the non-obvious uses of crude oil and liquids are far deeper reaching than many appreciate — and easy to overlook. It’s equally easy to say “we need more energy” (an exceptionally brave take from the conventional energy analyst), but the closure of Hormuz should draw attention to the importance that hydrocarbons play beyond trucking and shipping.
The industrial processes that we rely on to be executed safely elsewhere rely on Gulf energy. The food that keeps the world alive relies on Gulf energy. Syringes, sequin blouses, antifreeze, car bumpers, LEGO® bricks, carpets, diapers – these consumables are all downstream from crude oil production; and together account for more than 15 million barrels per day of petroleum consumption.
While the developing economies in Asia have the most exposure to the Strait of Hormuz, the developed economies of the West have certainly become used to the cheap manufacturing and other consumable exports from Asia. The early signs that higher petroleum prices are going to ripple through the system are showing up in plastic and other chemical feedstocks in Asia. As fertilizers get more expensive, and barrel deficits become more obvious, if the Strait of Hormuz doesn’t open, the carnage will no longer be contained to the East. The world’s petroleum trade is international, and with enough time, desperation, and lost barrels – global liquids flows will crisscross in response to the highest bidder. Today, time to ship between the US and Asia has been an effective circuit breaker. But when a fuse does blow, price eventually becomes the only clearing mechanism.
If you want to chat about energy projects, powering data centers, or anything else on topic, you can reach Michael at michael@htmog.com.


This newsletter is provided for informational purposes only, and should not be relied upon as legal, business, investment, or tax advice. Furthermore, this content is not investment advice, nor is it intended for use by any investors or prospective investors in any a16z funds. This newsletter may link to other websites or contain other information obtained from third-party sources - a16z has not independently verified nor makes any representations about the current or enduring accuracy of such information. If this content includes third-party advertisements, a16z has not reviewed such advertisements and does not endorse any advertising content or related companies contained therein. Any investments or portfolio companies mentioned, referred to, or described are not representative of all investments in vehicles managed by a16z; visit https://a16z.com/investment-list/ for a full list of investments. Other important information can be found at a16z.com/disclosures. You’re receiving this newsletter since you opted in earlier; if you would like to opt out of future newsletters you may unsubscribe immediately.
Develop a stomach for war and a Business head for war; the long peace is over.
“The Persian Gulf is the us-east-1 of the global energy trade” — best line I’ve hear today. Made me chuckle. That’s cool that you guys are getting into the oil crisis.