

Gas-Fired Intelligence
Everything you need to know about the resource powering AI


| America | Tech | Opinion | Culture | Charts |
Today and tomorrow, we have a double-feature special: everything you need to know about the US natural gas industry that’s powering Artificial Intelligence.
If you’ve followed anything about the AI datacenter buildout, you’ve probably wondered how we’re going to power all of this stuff. When we spoke to Sam Altman last month, he gave a candid answer: “I expect in the short term, most of the net new in the US will be natural gas.” Natural gas has become a crazy story in the past few years, as it’s central to not one but two huge capex builds with geopolitical implications: AI and LNG. We asked Michael Spyker of HTM Energy (one of my favorite follows on Energy Twitter) to help get us educated fast, and we’re delighted to share it here. - AD
It’s time to care about natural gas, for maybe the first time ever
There’s a very common trope that folks bag-holding energy stocks like to cling to – something like “you can’t make anything in the world happen without energy”. We usually tell ourselves something like this as we watch the QQQ reach all-time highs while the WTI crude quote ambivalently bobs between a $50- & $60-handle. Of course, this is simply weapons-grade cope manufactured and perpetuated by the very people that have dedicated their lives to producing oil and gas.
Unfortunately, having dedicated my own life to the energy sector, I fall squarely into this delusional category – thus I have the pleasure of explaining the key parts of the natural gas market to you over the next 20 minutes, and my firm’s view on how gas and power markets should interact with new LNG and AI demand. In effect, I’m here to say the 3 words that can ruin a man’s life if said prematurely – “this time’s different”.
The natural gas and power markets have been fairly unexciting for years. Among industry specialists, the upstream outlook tends to bifurcate into extremes – those who think there’s unlimited natural gas and prices can never go up, and those who believe prices will only go up. It’s hard to look at historical data and be optimistic about the gas market, knowing how much E&Ps love to grow.
For the past decade, price-insensitive gas growth has dominated North American supply. In the early shale era, companies grew quickly to capture market share; then, effectively $0-breakeven associated gas from the Permian Basin compounded downward pricing pressure. This barrage of supply made the last 10 years miserable for gas E&Ps, but great for consumers.
Today, both the Permian Basin and the dry gas E&Ps (the two largest US supply buckets) have matured and, on a go-forward basis, very much do care about economics. The US has churned through almost all of its low-cost inventory, and despite that, domestic demand growth from data centers and LNG exports is re-accelerating in the face of declining price-insensitive supply.
What is natural gas?
For the uninitiated, natural gas in its purest form is methane (CH₄). It’s an energy-dense fuel used to generate electricity, heat homes, and produce fertilizers and other industrial chemicals. Natural gas burns cleaner than coal and heavier petroleum-based fuels and, on a per-unit energy basis, is just as cheap, or cheaper, than other fossil fuels. It has been produced at commercial scale for over two centuries, with the power/utility sector being its largest consumer.
The two demand factors that dominate the market are LNG export growth, and power generation growth to service new data centers. Over the next decade, we could see up to 45 Bcf/d of demand growth between new power demand, and LNG exports – but the fact that makes the gas market today exciting – one year ago, nobody expected domestic US consumption to grow at all.
The world loves natural gas because it’s cheap, reliable, energy dense, relatively abundant, and far cleaner (in terms of emissions intensity) than other fossil fuels. Natural gas power plants are ~50-70% cleaner than coal-fired plants, and in the US, it’s cheaper to use natural gas as a fuel input over coal or petroleum products. When used to generate power, natural gas provides extremely reliable baseload generation, as well as very dispatchable peaking generation. When developed in tandem with renewables and batteries – natural gas contributes the foundation for a high-reliability, low-cost, and low-emissions grid. (1)
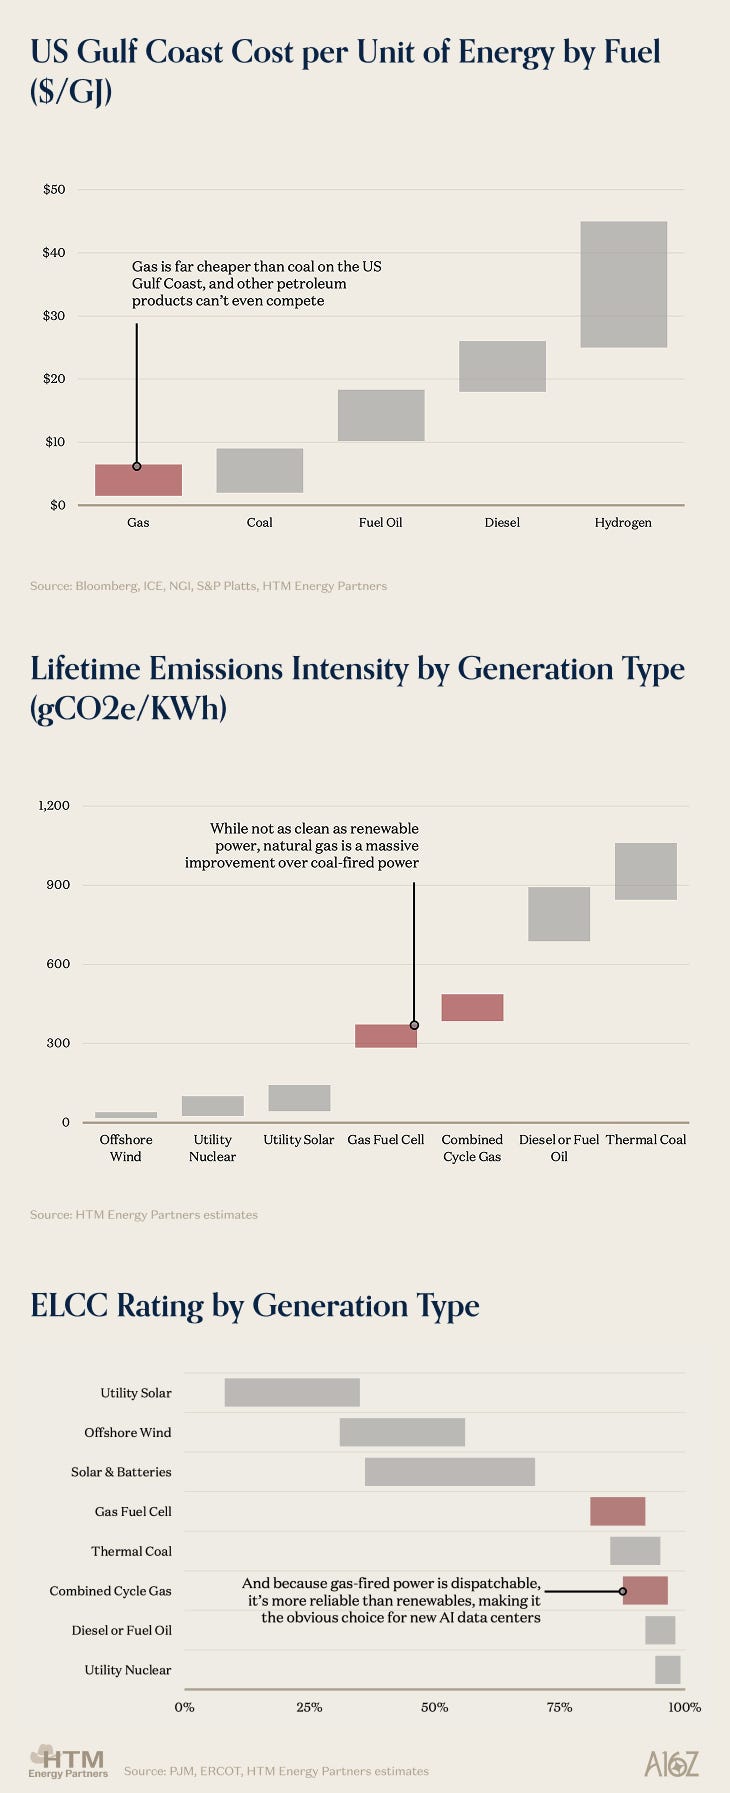
ELCC measures how much a generating asset can reliably contribute to the grid’s peak load as a fraction of its nameplate generating capacity, and while it’s not a perfect proxy for reliability, especially over long periods, it assesses how grid operators ‘risk’ different generation types. The higher the ELCC rating, the higher the probability that the full asset’s potential can be accessed (i.e. the reliability of the incremental MW), the higher the expected uptime, and the higher likely utilization factor.
Most can appreciate that oil is refined and turned into the liquid products that we use every day – like gasoline for our cars, or jet fuel for planes. Natural gas on the other hand, despite its abundance, is much more opaque. Natural gas also needs to be refined and transported, though it’s more difficult to transport than oil and petroleum products given… it’s a gas. The natural gas market is easy to understand if you break it into 4 ultimate consumers – industrial, power generation, residential & commercial, and LNG exporters.
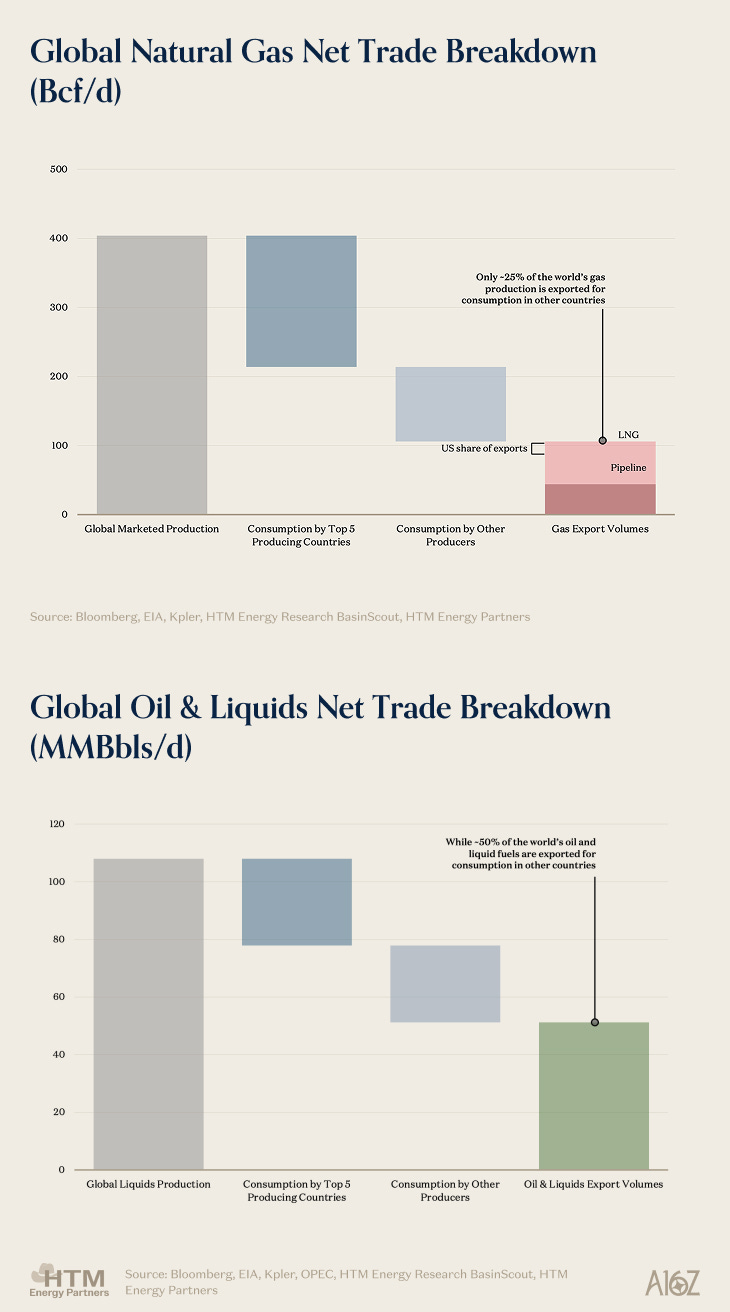
Below is a flow chart that shows how gas moves from the wellhead to the consumer. Once gas passes through a processing plant, it’s considered “marketable gas”, and from there, big long-haul transmission pipelines, like Williams’ Transco move molecules from production hotspots to downstream demand. These transmission pipelines crisscross the country, and intermediary parties like local utilities or power plants, can tap into these large pipelines and take the gas they need to service the ultimate consumers. Upstream production is ~110 Bcf/d today, and ~20% of that is used for heating, cooling, and cooking, 40% for electricity generation, and ~30% for industrial purposes (including the oil and gas industry itself). The rest (~20%) is exported abroad. Really, it’s that simple – the US uses natural gas to heat & cool homes, generate electricity, and make chemicals – the rest we export for other countries to do the same with.
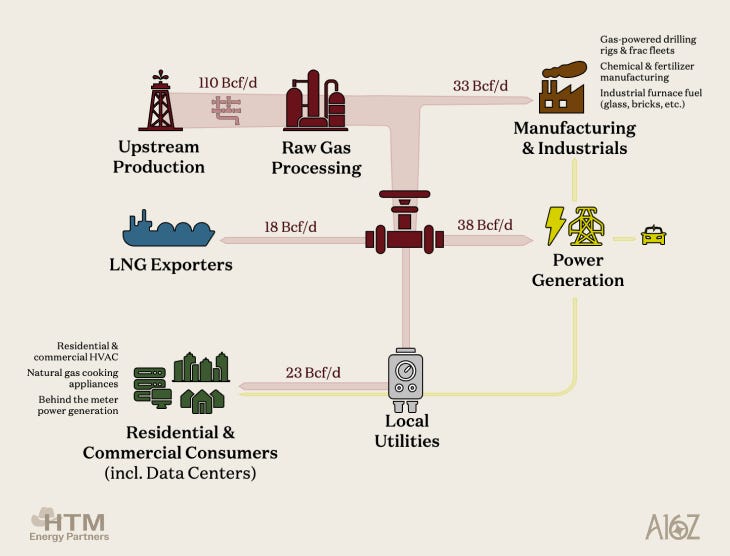
Within, we’ll focus mostly on the power generation and commercial consumption part of the demand equation – but to understand the emerging dynamics of the gas market discussed within, it’s important to know these 4 simple pillars of US gas demand.
When it comes to generating electricity from natural gas, the tool of choice is a gas turbine. Natural gas is exceptionally good at generating electricity. There are many types of gas turbine generating setups – though the most common are simple cycle and combined cycle gas turbines (SCGTs & CCGTs). Both simple cycle and combined cycle turbines continually feed highly compressed air and natural gas through a combustion chamber, where, once ignited, the air/gas mixture reaches over 3,000°F. As the hot air expands, it rushes through the turbine, spinning the blades, which in turn generates electricity. SCGTs then vent the hot air into the atmosphere, but CCGTs capture that hot air and use it to make steam, which then spins a second steam turbine to generate more electricity – hence the name, combined cycle.
These CCGT power plants are unbelievably efficient at producing electricity – and given their efficiency and reliability, they have become the de facto choice for baseload generation growth in the US. Even before anyone knew what ChatGPT was, the US was consistently deploying ~5 GW/yr of new CCGT capacity, with CCGT power plants being the single largest source of domestic generation. For new data centers, smaller SCGTs have been the go-to; they’re less efficient but can be quickly deployed – and for data centers that aren’t fully grid-connected, these SCGTs are better at responding to load variability than their CCGT counterparts.
This insatiable demand for new power and compute in the short term has led to almost all new data centers relying on natural gas to train models and serve inference – both indirectly through the grid, or via dedicated behind-the-meter (BTM) generation – a phenomenon that we call gas-fired intelligence.
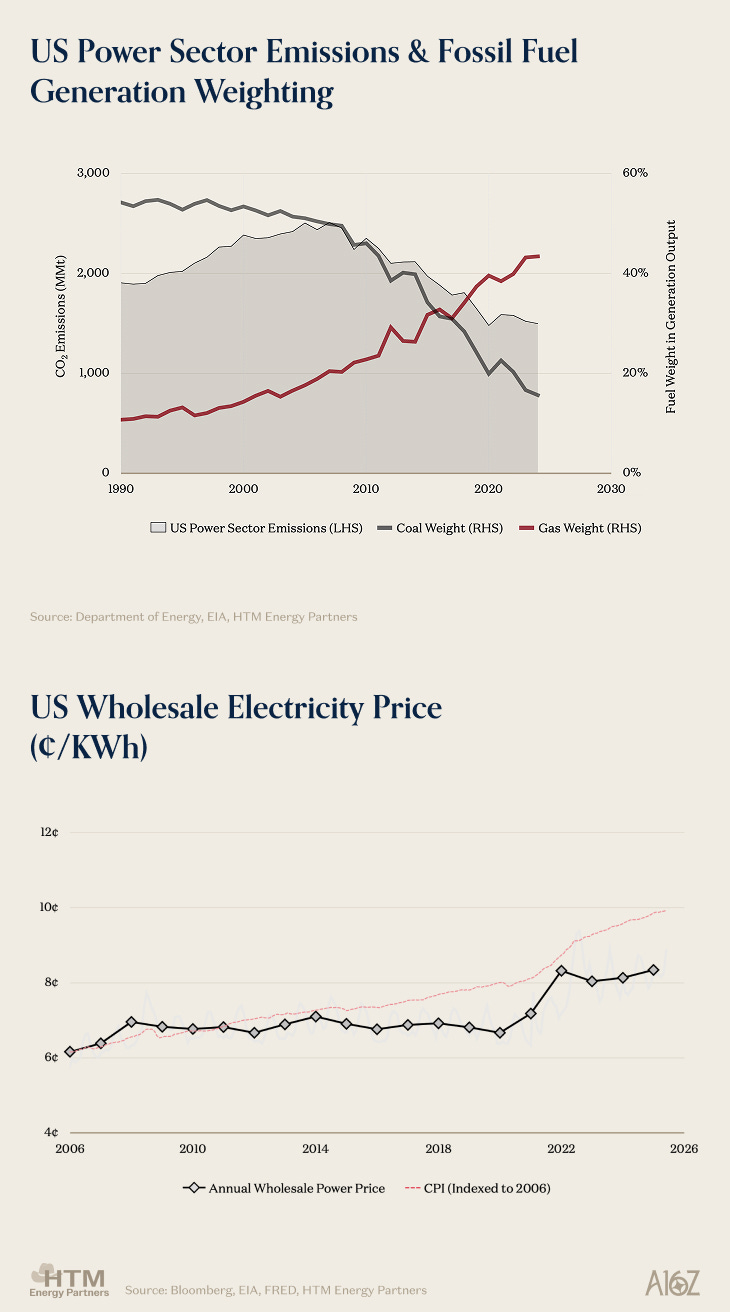
Natural gas and renewables have helped the US achieve a cleaner grid, displacing coal, and lowering sector emissions by ~1 billion metric tons of CO2 annually (over 2004-2008 levels) – all while power prices trended flat-to-downwards, with wholesale electricity prices underperforming inflation by a wide margin over the last 20 years. While renewable energy and battery storage technologies continue to improve – natural gas power is shockingly cheap, and it’s a mature generation technology today (and will continue to be important for many decades). Gas generation is equally as reliable as coal, while burning cleaner than coal; bringing developed nations closer to their climate goals without sacrificing the reliable access to energy that leads to the high quality of life that Americans are blessed with.
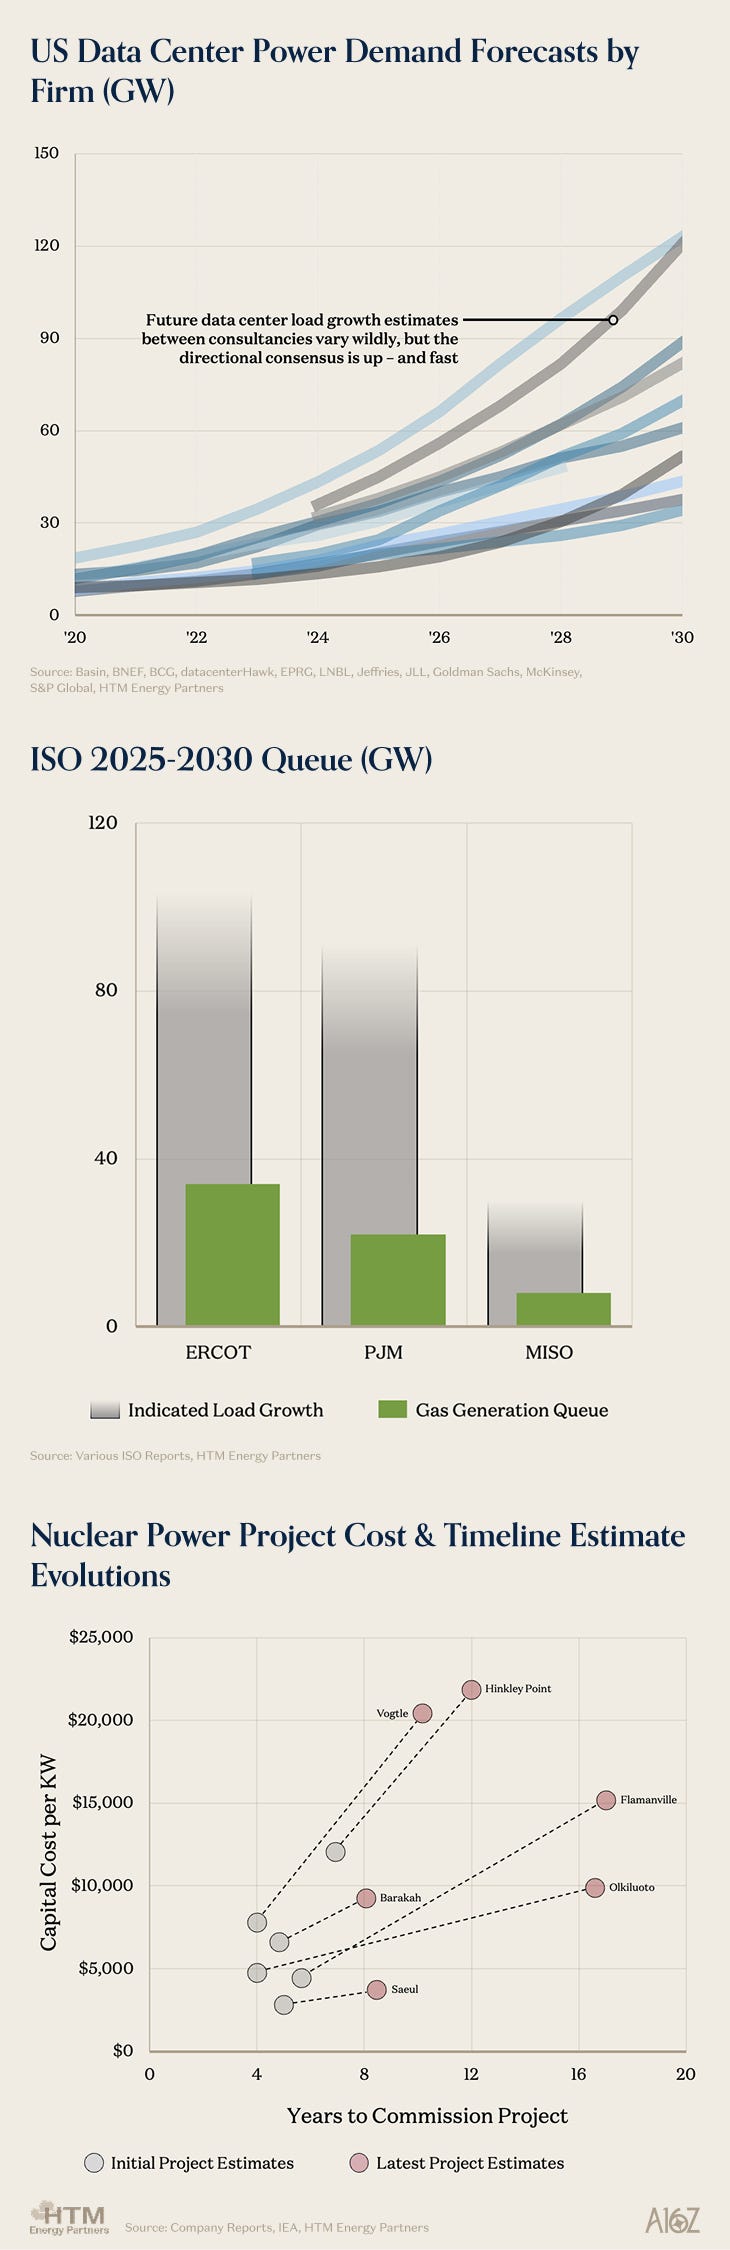
No matter how we power artificial intelligence, and eventually superintelligence – everyone can agree we are going to need a lot more power. Nuclear is cheap and reliable, but long-lead. Renewables are cheap and fast, but not reliable. Though natural gas – it’s cheap, reliable, and can be had sooner than the alternatives. We have no problem with nuclear or renewables; but we think a pragmatic approach to long-term grid planning (from a non-merchant viewpoint) prioritizes building gas generation now, then layering in heavy renewables as the system expands. Effectively, the US should focus on growing first, and pruning later – rather than try to optimize in parallel with rapid growth.
Smaller natural gas power plants can be deployed in a matter of months (xAI built their Colossus facility with an array of simple cycle Solaris turbines within 4 months), and larger, highly efficient plants can be built in ~2 years. With supply chain expansion from the turbine manufacturers (which require commitments from the hyperscalers), these timelines can continue to hold, or improve. When compute demand “hockey sticks”, like many expect, the grid needs generation that can be built quickly, and generate reliably. If the cost of losing AI is trillions of dollars, the cost of one hour of downtime is tens of millions. Natural gas is almost without compromise.
The charts above show the quantum of data center demand that is expected to materialize in the US through 2030. The left chart shows various installed data center capacity forecasts, the middle chart shows the expected gross load growth by system operator through the end of the decade, and the right chart shows the execution of new nuclear projects worldwide, and how cost & timeline estimates have evolved to the point that new generation capacity may be over a decade out; while gas generation capacity, even with supply chain strain, can be delivered inside of ~3 years.
So it’s a good thing the US loves producing natural gas
The reasons that the US is the only country with a thriving Venture Capital industry are the same reasons that the US is the only country with an active shale oil and gas industry. Nowhere on earth has the same culture of risk-taking, unrelenting competition and access to speculative capital. Other countries have shale resource, like the Vaca Muerta in Argentina – but nobody does it like the US. Despite being more economic than the Permian Basin, it took the Argentines 6 years to add 500,000 Bbls/d of oil production after they began ramping the Vaca Muerta. When the Permian began ramping in 2017, it was adding 500,000 Bbls/d every 205 days. In Canada, despite having world-class rock, the Montney still hasn’t broken 500,000 Bbls/d after 14 years of growth.
It was this ethos that encouraged the shale oil and gas industry to grow with reckless abandon. These companies were not growing to add economic value, but to beat their peers in a perverse race to the bottom – and the capital markets were standing by to bet on the winner while punishing anyone that wasn’t clearly in first place.
For the gas producers, this meant directly competing with the Permian Basin where the breakeven of new gas coming into the market was below-zero – it was an impossible game. Whether it’s software, lemonade, or dry gas – when the market price for your product is $1.00, and it costs you $2.50 to make – it’s quite hard to make money. Nevertheless, dry gas companies continued to grow. This may be hard to believe (maybe not really), but gas producers have historically been very not-good businesses – since 2010, the cumulative free cashflow generated by the handful of remaining pure-play gas producers has been negative $6 billion. Now that pricing is creeping higher, expect them to revel in the positive free cashflow for a little while.
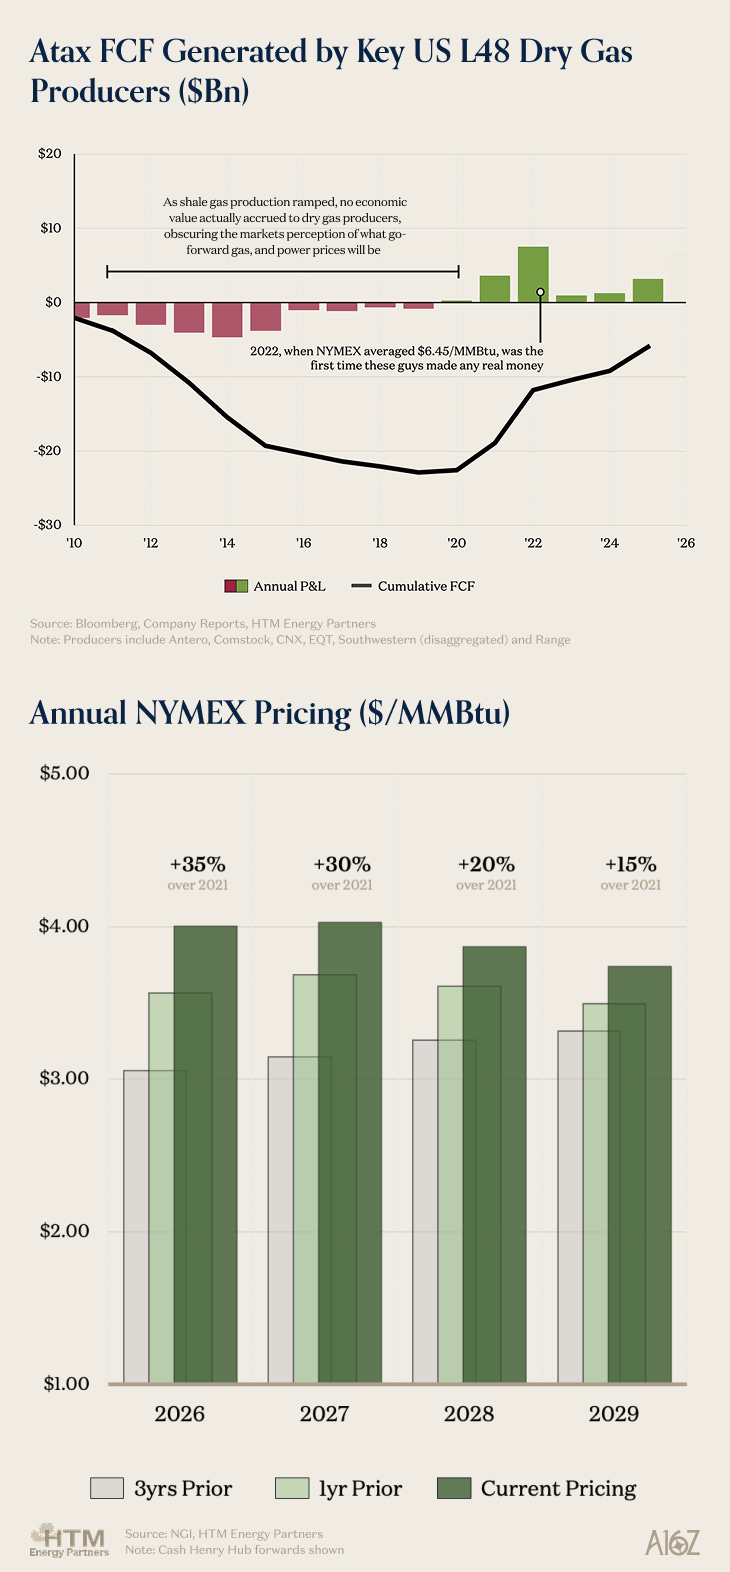
The charts above show how tumultuous life has been for a dry gas producer. The left chart shows lifetime free cashflow for 6 companies, which, after over 10 years, is still negative. The right chart shows the progression of Henry Hub (NYMEX) pricing, which has slowly responded to the constant growth in demand with very little change in the supply outlook trajectory.
This is an important part of the shifting dynamics of the gas market – the nearly exponential growth 2015-2020 was not driven by economics, but by fierce competition and cheap capital. Neither of those two conditions exist now that the industry is running low on inventory, and more consolidated – so even if prices move higher, it’s very hard to underwrite the same quantum of gas growth the 2010s brought about by an almost surreal period in capital markets. Even if Henry Hub rises meaningfully, declining geology, higher costs, lower capital velocity, and egress challenges (pipelines now cost 5-10x more) would make it nearly impossible to deliver the same results. Even if we wanted to keep growing, we’d only be shortening inventory lives (i.e. how long the industry can keep production volumes flat), hurting our future selves.
But before we go any further, it may be helpful to have a feel for where gas comes from across the country. The lines on the map below (which look more like blobs) represent individual wells. The darker green lines mean the individual well will recover more natural gas over its productive lifetime. Nearly all of the US’ gas comes from the 5 plays highlighted on the map.
Appalachia produces 35% of the US’ gas – half of Appalachia’s gas is consumed in the northeast, and the other half is sent via pipeline throughout the country. Texas, Louisiana, and Oklahoma produce ~50% of the US’ gas – within the Gulf Coast region, the Permian accounts for 20% of US supply, the Haynesville ~15%, and the Anadarko/Midcon & Eagle Ford both ~15%. Outside of these (really, just two) regions, there is minor supply that can be seen on the map throughout New Mexico, Wyoming, and Colorado – though they are not overly relevant to high-level discussions about the gas market.
You may notice that some of the highlighted plays are almost all green, while others have a mix of green, orange, and red (meaning, the gas-weighting of the individual wells vary). Natural gas that is produced from orange and red wells is considered “associated gas”, whereby the well also produces oil, making the drilling economics less sensitive to the price of gas. The Permian, Anadarko/Midcon, and Eagle Ford are largely associated gas basins, producing large amounts of oil, NGLs, and natural gas.
Conversely, the green-heavy plays produce almost 100% gas, with no oil production to lean on when pricing is weak – this is considered “dry gas”, as it doesn’t have the liquids (i.e. oil) that associated gas does, and it means that dry gas economics are extremely sensitive to gas realizations. Appalachia and the Haynesville are dry gas basins.
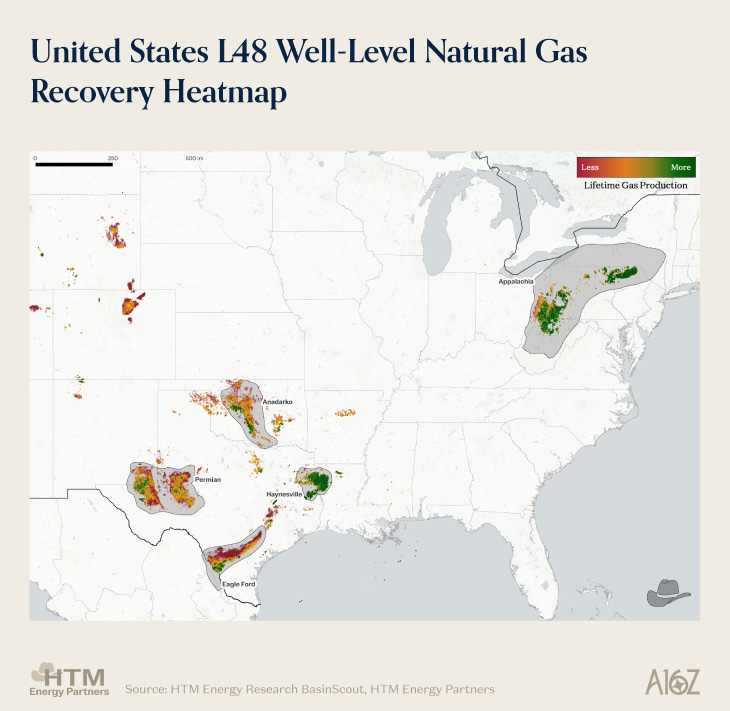
The map above shows all horizontal wells drilled in the US, colored by the amount of gas they will recover over their economic lifetime. Green wells are “better at producing gas” (i.e. will recover more gas from a single well than average), and orange/red wells are less weighted to natural gas and may also have oil and other liquids in the production stream.
Since shale really came into its own around 2010, it has stamped out all conventional production growth, with the regions highlighted on the map above accounting for over 75% of the US’ marketable gas production. Production has grown in an almost straight line upwards, first led by the dry gas (red) plays, then the oil-weighted associated gas (green) plays.
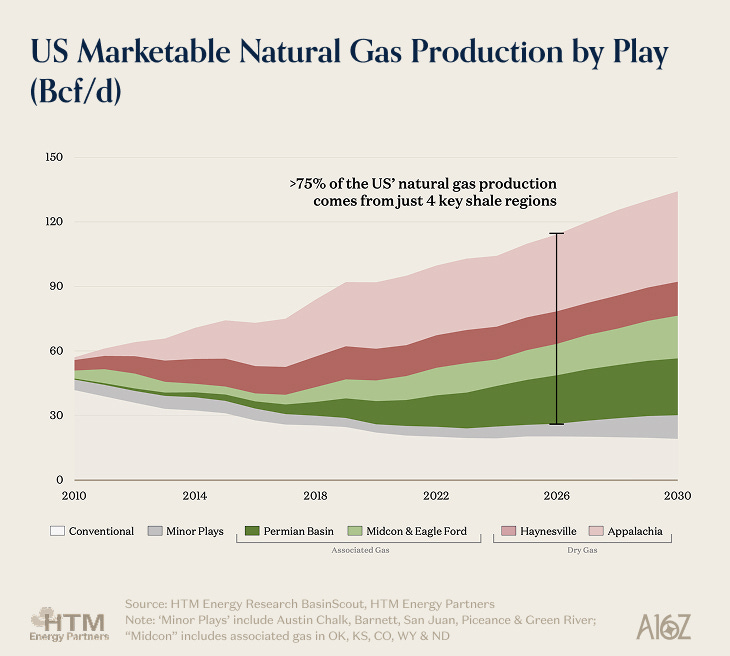
Gas production by key US play/region. The red shaded plays are dry gas (i.e. price-sensitive), and the green shaded plays are associated gas (i.e. not sensitive to price). The grey shaded plays are conventional gas, or not key growth drivers.
Dry gas plays led early-time growth because they are really good at one thing – producing gas. They can be turned on and off with relative ease to respond to upwards (or downwards) price signals. As a rule of thumb, dry gas plays are very deliverable – you can bring a lot of dry natural gas online in a very short period of time (provided there’s infrastructure and the desire), and similarly, you can turn a lot of dry natural gas off in a short period of time – making production very elastic to price.
Associated natural gas is the opposite – it can’t be turned on or off, it can’t be accelerated, slowed, or really moderated in any way. It’s completely price-insensitive and the growth trajectory of associated gas is dictated by the growth trajectory of oil production. Associated gas doesn’t respond to price signals, it’s almost perfectly-inelastic supply. This is great for downstream customers when there’s too much supply, and producers are willing to give it away (i.e. the last 10 years), but when there’s not enough supply, relying on associated gas plays for growth can have very negative consequences (spoiler: we’re relying too-heavily on associated gas plays for growth).
When you break out US gas production growth even further, a fairly concerning trend appears. While nationwide production is still chugging up and to the right, most of the production growth over the past 5 years has come from the Permian Basin. Despite not being particularly good at producing gas (recall on the map above, there’s a lot of orange and red), the Permian Basin produces so much gas because its gross hydrocarbon production is just so massive.
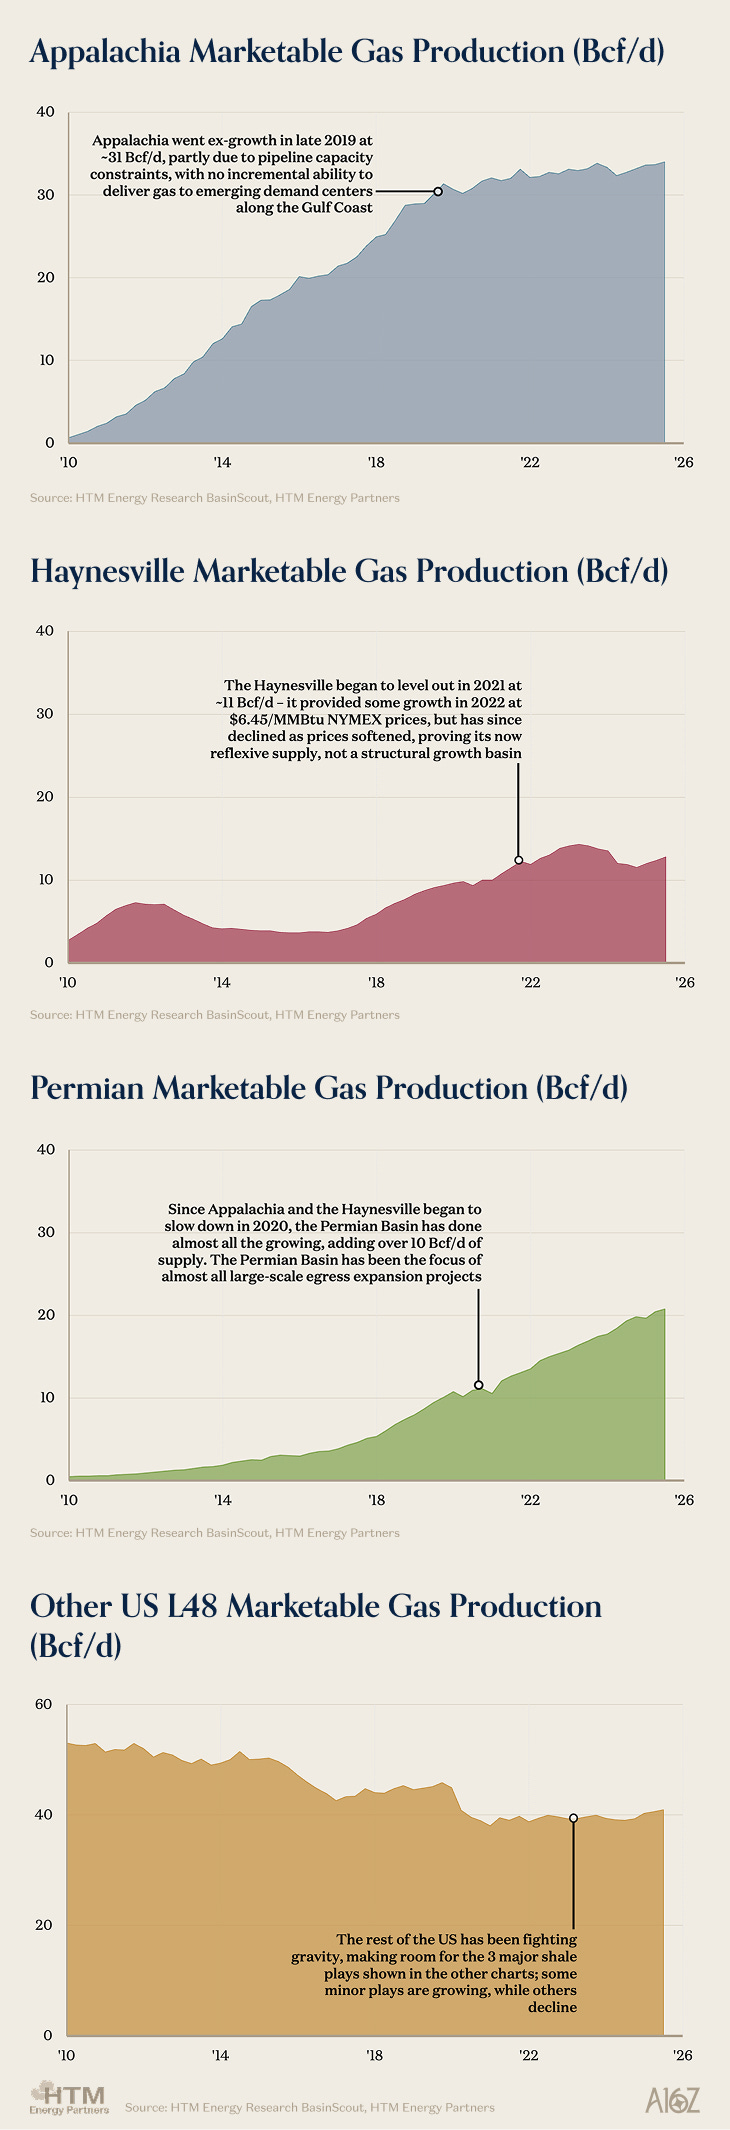
For almost no growth from the pure-play dry gas basins, there sure is a lot of demand that’s lining up over the next decade. Production from the dry gas plays is now clearly price-led (i.e. at $6.45/MMBtu Henry Hub, the Haynesville grew, but gave up that growth the next year when prices softened), or limited by egress – and the Permian doesn’t have the firepower to provide enough low-cost growth to satiate all the demand we see emerging over the next 20-years.
There’s one small problem with AI demand – the US already decided it wanted to use our gas win at LNG
See, the only problem with gas-fired intelligence (and it’s a really big one) is the US has already built a nearly $500Bn LNG export industry on the Gulf Coast to take advantage of the US’ ample cheap gas – and there certainly isn’t enough resource to split between the hyperscalers and the exporters. If all currently-communicated export projects end up being built, the US would be on-pace to export ~35-40% of its production by the late-2030s – at least that was the plan before data centers came about.
This obsession with LNG is all because, despite our best efforts, the United States’ demand for natural gas outside of the power sector has been effectively flat for all of the 21st century. It’s very hard to “demand more natural gas” when you already have it. While you might be more inclined to take a road trip if gasoline is cheap, US demand for natural gas is generally very inelastic. You turn the heat on even if Henry Hub prices are high, and when Henry Hub prices are low – you can’t heat your home harder, or cool your office more no matter the price – so even after the shale revolution made natural gas extremely cheap and abundant; that endlessly cheap supply hasn’t actually catalyzed much incremental domestic consumption. The black line on the chart below shows US natural gas demand if there wasn’t an effort to absorb excess domestic supply (i.e. no coal retirements, or LNG terminals).
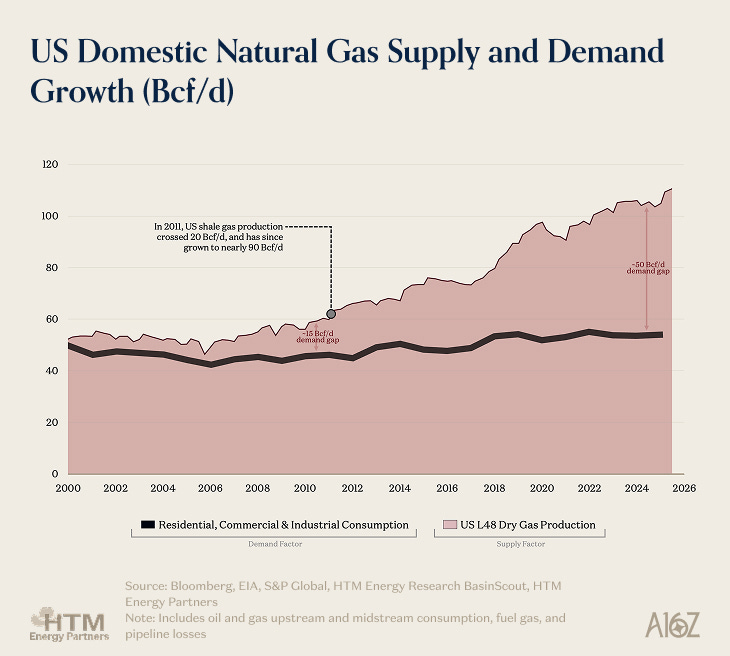
Domestic natural gas consumption, excluding gas used to generate electricity, along with total domestic dry gas production; it illustrates the massive demand gap that has emerged between non-fungible/structural US consumption, and domestic supply, as US shale plays have grown output rapidly but demand simply is unable to respond as US consumers don’t need more gas no matter the price.
It’s a good problem to have – the US’ extremely high living standards mean we just didn’t really need to consume more natural gas, but because we are so good at producing it, there was enough margin to support massive capital projects to help “absorb” excess supply (i.e. to somehow put all that extra gas to use). So, the US did what any sane capitalist institution would do – we began exporting gas for consumption elsewhere, while replacing domestic coal-fired power plants with gas-fired generation instead. These two industries wouldn’t exist without an abundant supply of cheap gas – thus we classify them as “supply-led”, as it was an oversupplied gas market that ultimately led to their existence. We’ve poured hundreds of billions of dollars into capital projects to absorb all our excess gas, and as we speak new LNG export terminals are being planned, and as shown below – our gas exports are hitting all-time-highs.
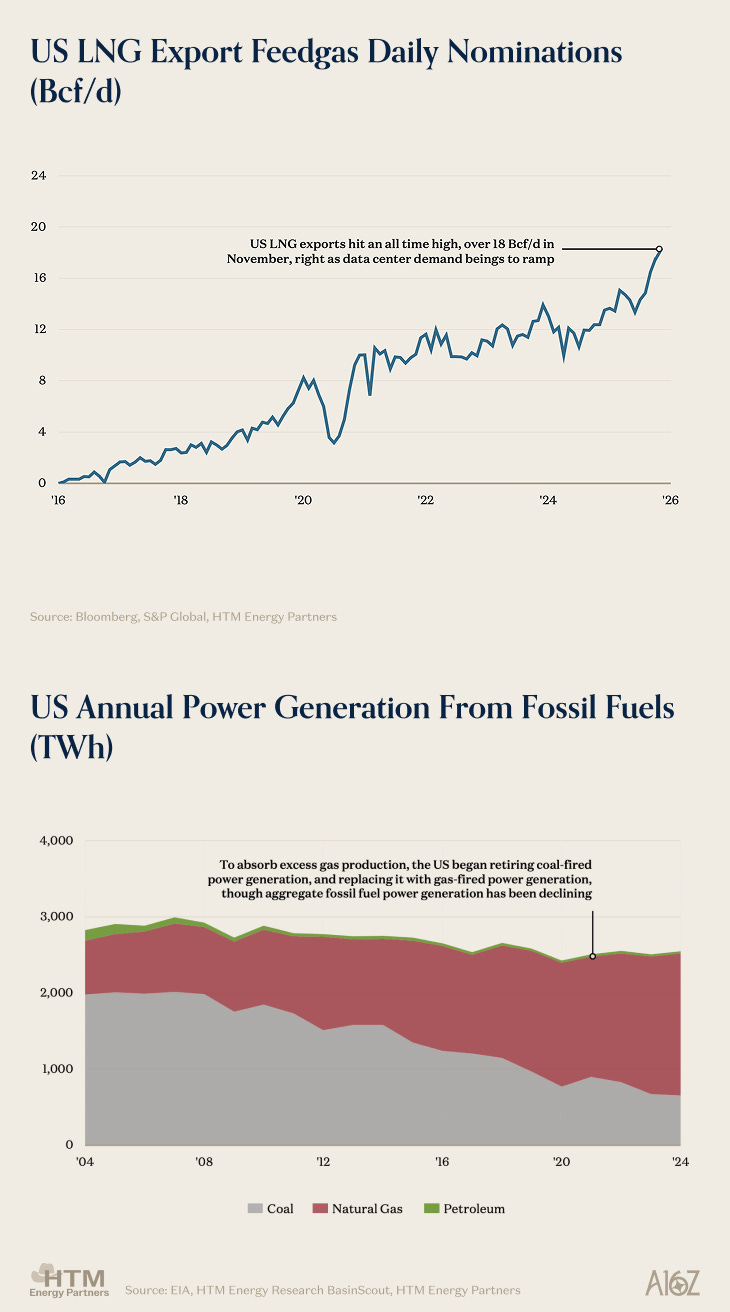
US LNG export feedgas (left), which has recently reached an all-time high, and US power generation from fossil fuels (right); where, despite total fossil fuel generation shrinking, natural gas has displaced coal-fired generation as it’s cleaner, and equally cheap. There are increasingly few coal generating stations that can be easily replaced, which has led to a slowing of natural gas demand growth for power generation.
So in the 2010s, when midstream infrastructure developers realized that US producers had all this cheap resource but nobody stateside wanted to consume it (quite literally, they couldn’t barely give it away) – capital began chasing LNG export terminals. Since 2016, the US has consistently averaged +2 Bcf/d of LNG export capacity additions each year, and while export capacity isn’t 1:1 with actual demand, the rest of the world doesn’t have the same luxury the US enjoys – as in if there’s more gas available, they will consume it. Unlike crude oil and petroleum products (diesel, jet fuel), most of the world’s natural gas is consumed by the producing country as it’s relatively difficult to transport. But because the US could produce gas for so cheap, even after the cost of liquefying and shipping it, we could still undercut the cost of other countries producing their own gas. It’s truly breathtaking to even think about.
And did the US ever begin building export infrastructure. The first LNG export terminal, Cheniere’s Sabine Pass, was FID’d in 2012 and began operations in 2016 – and just 10 years after the first cargo left Sabine Pass, the US has become the top LNG exporter in the world with no plans to slow down. The speed at which the US erected export terminals with no government planning, is otherworldly. It’s comparable to how quickly Stargate was built – even Qatar, with unlimited cheap capital and centralized planning couldn’t dream of competing with the US.
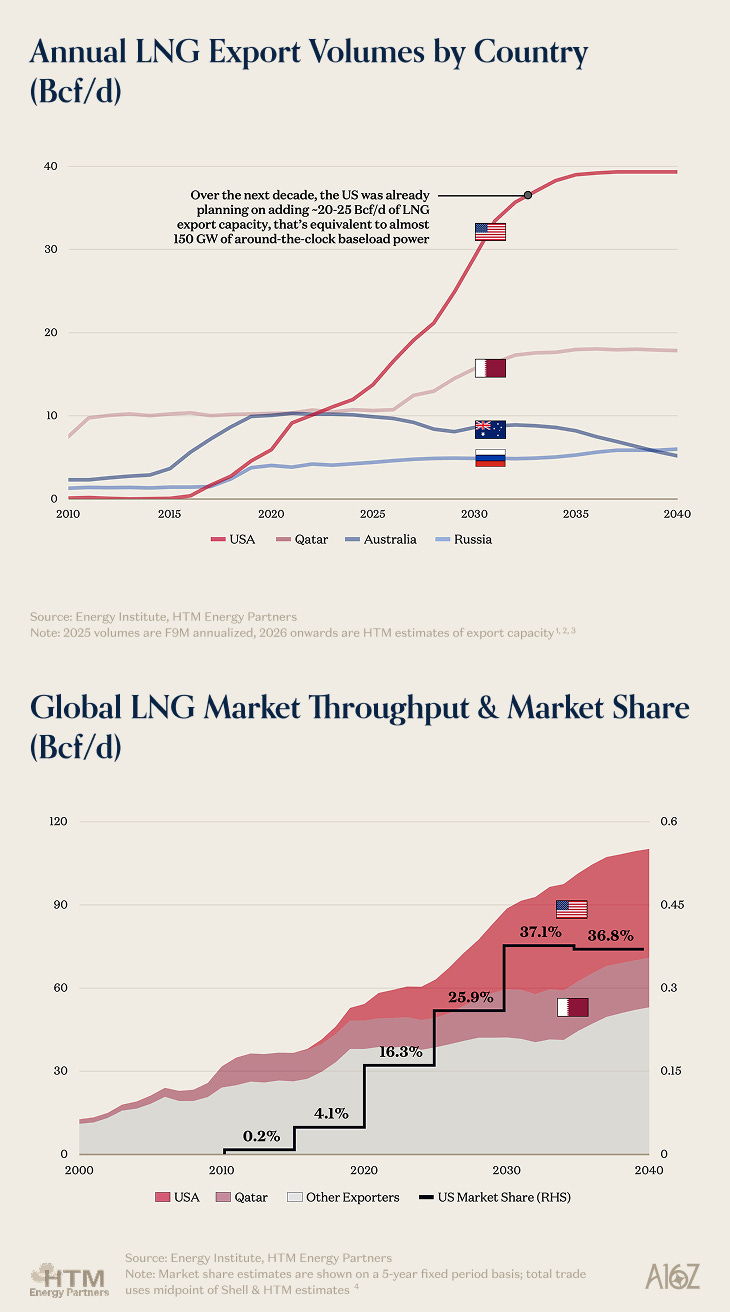
The charts above show LNG export volumes by country (left), along with global export volumes (right) and the US’ share of the global LNG market. The left chart shows how quickly the US has become a superpower in the LNG trade, and how, despite being the current top exporter, we intend to double export capacity over the next decade. The right chart shows that non-US, and non-Qatari exports have been relatively flat since 2030, and don’t begin growing again until late-2030, as the US and Qatar have dominated the market.
In the end, we did it. Gas-fired power plants replaced coal generation, Gulf Coast exports began ramping, and eventually all of the US’ excess domestic supply was successfully soaked up, turning the US into a net exporter of natural gas around 2018 – again, this was all despite structural domestic consumption (shown in grey below) remaining relatively flat. It’s an impressive feat, and a testament to America’s capitalist dominance that we could take something that nobody needed, and with enough room to earn a return on capital along the way (and some bankruptcies), build enough infrastructure to consume our shale gas domestically for power, and begin exporting the excess abroad.
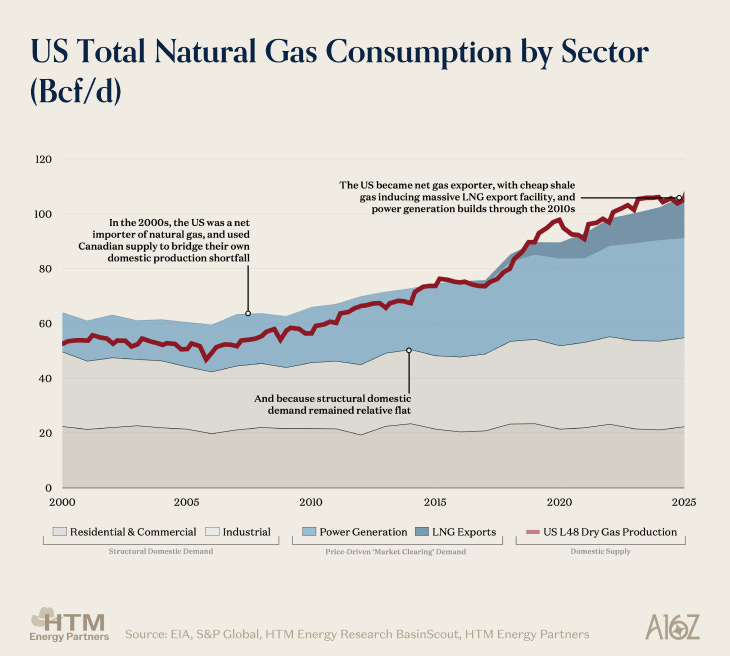
The charts above show how “supply-led” growth (shown in blue) has been the driving demand factor over the past 20 years. As coal-fired power plants were decommissioned and with gas-fired power plants, and LNG exports began clearing the market to send molecules abroad – even with flat domestic demand, the US was still able to handle a doubling of domestic dry gas production!
But herein lies the risk (and it’s not a particularly big risk to the tech sector) – the US capital markets love to throw cheap money at things that are working – and right now, that’s both AI data centers, and the LNG industry. Because LNG terminals are far longer-lead than power generation, it’s easy to get gas today. Data centers are defaulting to new gas-fired power generation infrastructure – but this incremental gas demand will end up front-running a generational US Gulf Coast LNG build-out that was only induced by historical expectations of very little gas consumption growth, which AI has changed completely.
Below we show the evolution of the EIA’s domestic gas consumption forecast as published in their Annual Energy Outlook. Their forecast has always been tame – minor domestic growth driven by power demand, but the more recent 2023 & 2025 forecasts have called for a slow decline in gas demand as renewables proliferate – even their post-ChatGPT 2025 forecast had gas demand flat!
This has led to a fundamental miscalibration of how much gas will be available to export in the future, and the price at which the upstream producers will dispatch any required growth. The EIA has gotten natural gas demand wrong – forecasting flat domestic consumption is erroneous. These flawed forecasts have led to tenuous assumptions about the future of the gas market reverberating through the country – and ultimately will likely end up in an overbuild of LNG export capacity as demand for gas-fired intelligence continues to grow. To those planning on building data centers that use natural gas – worry not; the desire to build new export capacity while taking merchant risk is a fundamental capital allocation flaw by a number of export companies motivated by a volatile international market reorganizing itself in the wake of Russia’s Ukraine invasion. As LNG export capacity is not 1:1 with demand if the exporters cannot sell the gas abroad at their marked-up price (based off Henry Hub), it will remain in the US, at the loss of the exporter, not you.
While the US decided it wanted to win at LNG – at one point the desire to win at AI will be far greater. The Gulf Coast LNG industry was born as an outlet for all of the US’ cheap gas, and if we have a productive domestic use for this gas, it’s not a stretch to think that the LNG export industry will be the one that comes under pressure (the US has done far worse things to interfere with the global flow of oil and gas, forcing someone to mark their infrastructure bonds at 75 will likely the tamest expression of US energy dominance in history).
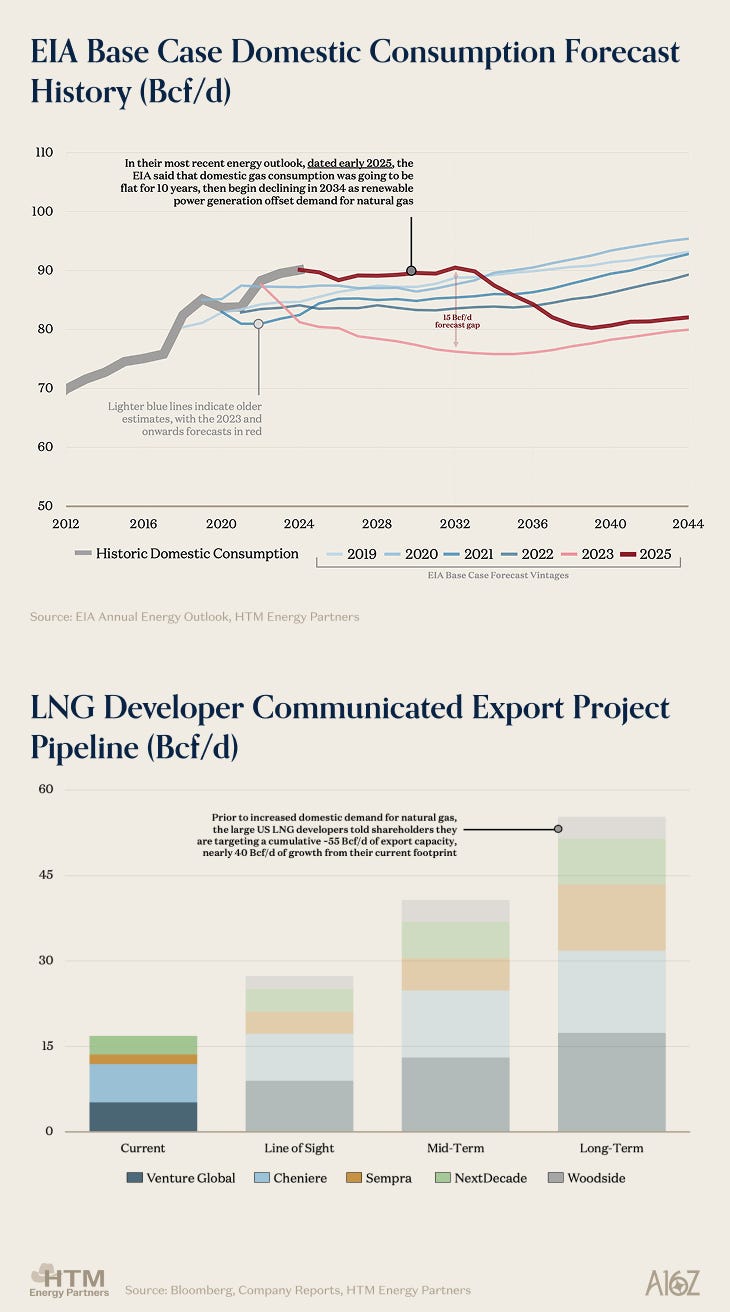
The charts above show the progression of EIA domestic gas consumption forecasts (left), and the long-term export capacity outlook among key Gulf Coast LNG developers (right). The left chart shows that the EIA has consistently predicted flat domestic consumption for the last 6-7 years which has led to an increasing desire to build export facilities (shown in the right chart). This flat domestic consumption paired with increasing supply has bred a hungry LNG industry – and before the data center demand boom, the intention was to more than triple export capacity over the next 20-years.
We’ll be back tomorrow with part 2: the showdown between AI and LNG. Thanks for reading! For anyone that wants to chat about natural gas, sector opportunities, or data centers in general – feel free to drop me a line at michael@htmog.com.
This newsletter is provided for informational purposes only, and should not be relied upon as legal, business, investment, or tax advice. Furthermore, this content is not investment advice, nor is it intended for use by any investors or prospective investors in any a16z funds. This newsletter may link to other websites or contain other information obtained from third-party sources - a16z has not independently verified nor makes any representations about the current or enduring accuracy of such information. If this content includes third-party advertisements, a16z has not reviewed such advertisements and does not endorse any advertising content or related companies contained therein. Any investments or portfolio companies mentioned, referred to, or described are not representative of all investments in vehicles managed by a16z; visit https://a16z.com/investment-list/ for a full list of investments. Other important information can be found at a16z.com/disclosures. You’re receiving this newsletter since you opted in earlier; if you would like to opt out of future newsletters you may unsubscribe immediately.
 | A guest post by
|