



America | Tech | Opinion | Culture | Charts

So Many Apps, So Little Time
Charts (and others) has observed that one effect of AI code gen tools has been the proliferation of code. More code has, among other things, also led to a pronounced spike in the number of apps. Everyone’s a vibecoder now, which means everyone’s an app publisher now, too.
Of course, just because there are now more apps to choose from, doesn’t mean that those apps are particularly compelling, or that people are suddenly spending more time in the app store. Supply may increase, but demand may have a life of its own.
As it happens, a recent paper sheds some light on the demand-side of the equation, and the results are pretty clear: the supply of apps has, indeed, surged . . . but, for the most part, no one is really using them:
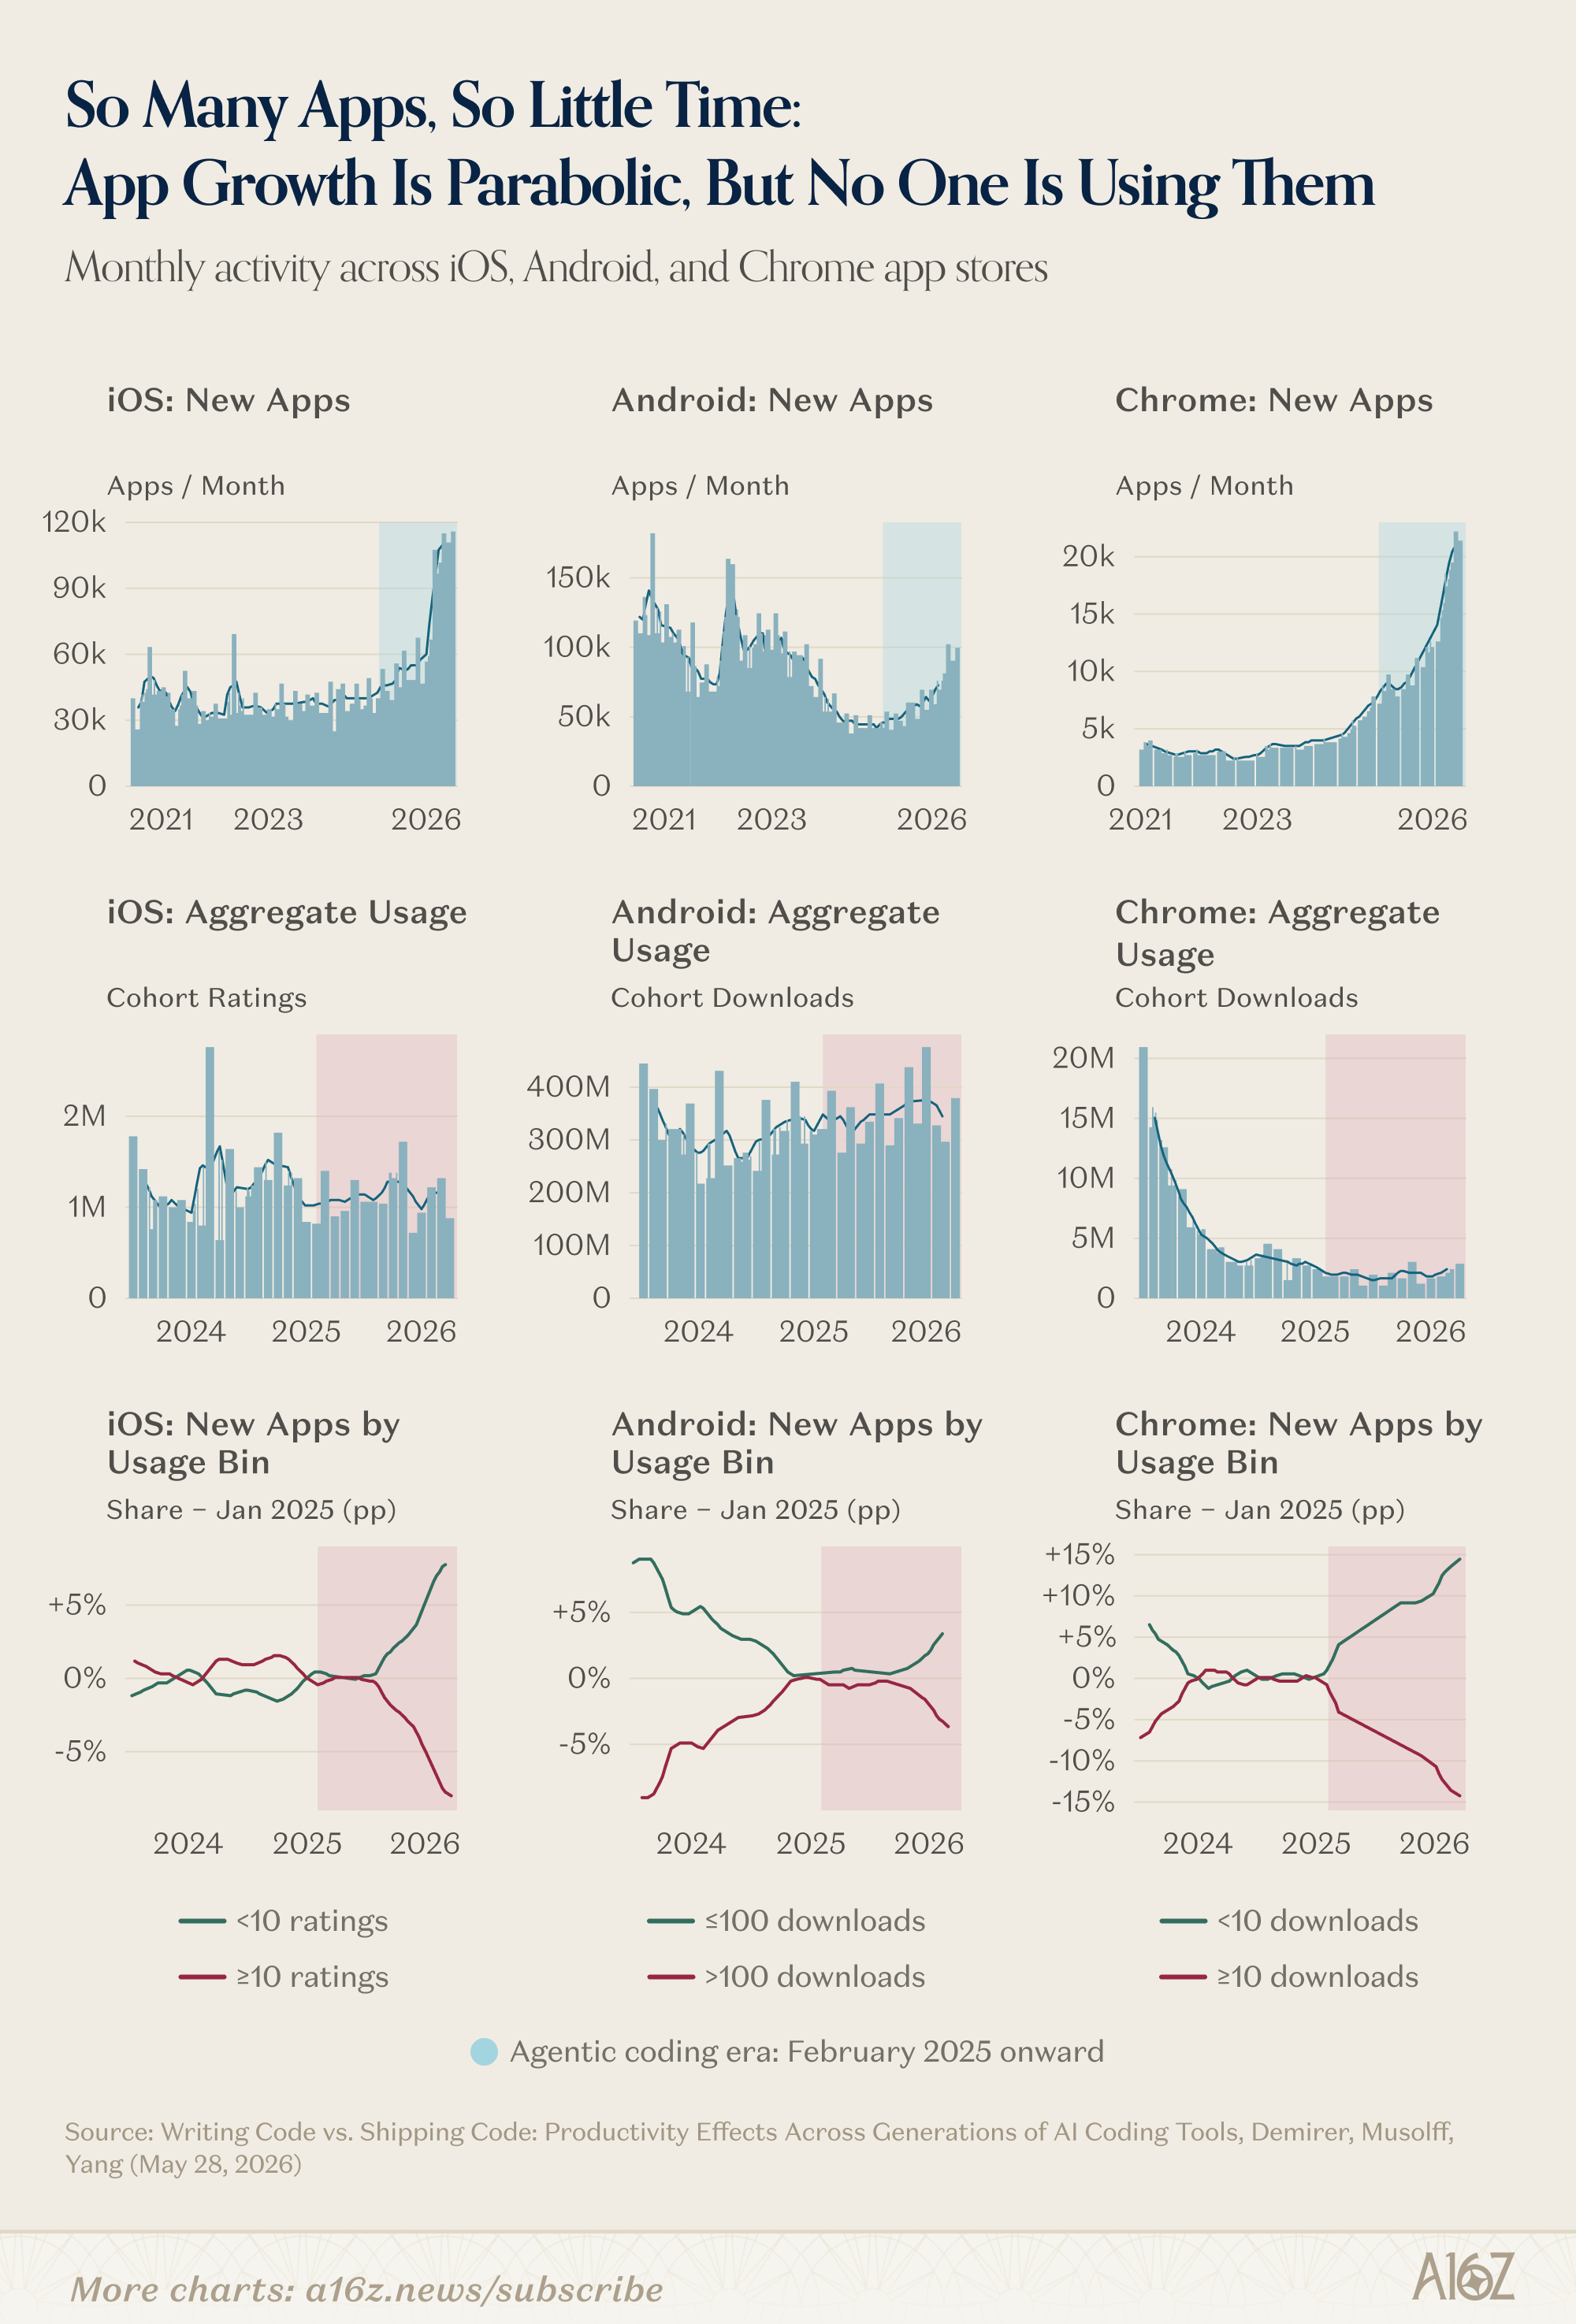
Across iOS, Android and Chrome, total new apps per month have variously doubled or quadrupled.
On the other hand, the number of downloads (or ratings, in the case of iOS) has been pretty much stagnant.
And, in case you’re wondering whether there’s been any share-shift, such that aggregate downloads are flat, but within that universe are still some winners—well, the researchers cover that one, as well. Alas, the share of apps with any indication of escape velocity—10+ ratings, 100+ downloads (for Android), and/or 10+ downloads for Chrome—has plummeted.
In other words, yes, the data suggests that App-Slop is the story, for now. AI has led to a lot more apps, but they are not successful apps, in any meaningful sense.
That’s not really surprising. Building successful apps (or software) has always been more than just generating the code. Plus, it’s still very early, and one would expect that all the amateur tinkering would produce supply ahead of demand.
For what it’s worth, SensorTower’s data corroborates the story, for the most part. In the US, total app revenue has been basically flat since the beginning of last year, with a modest increase in total time-spent:
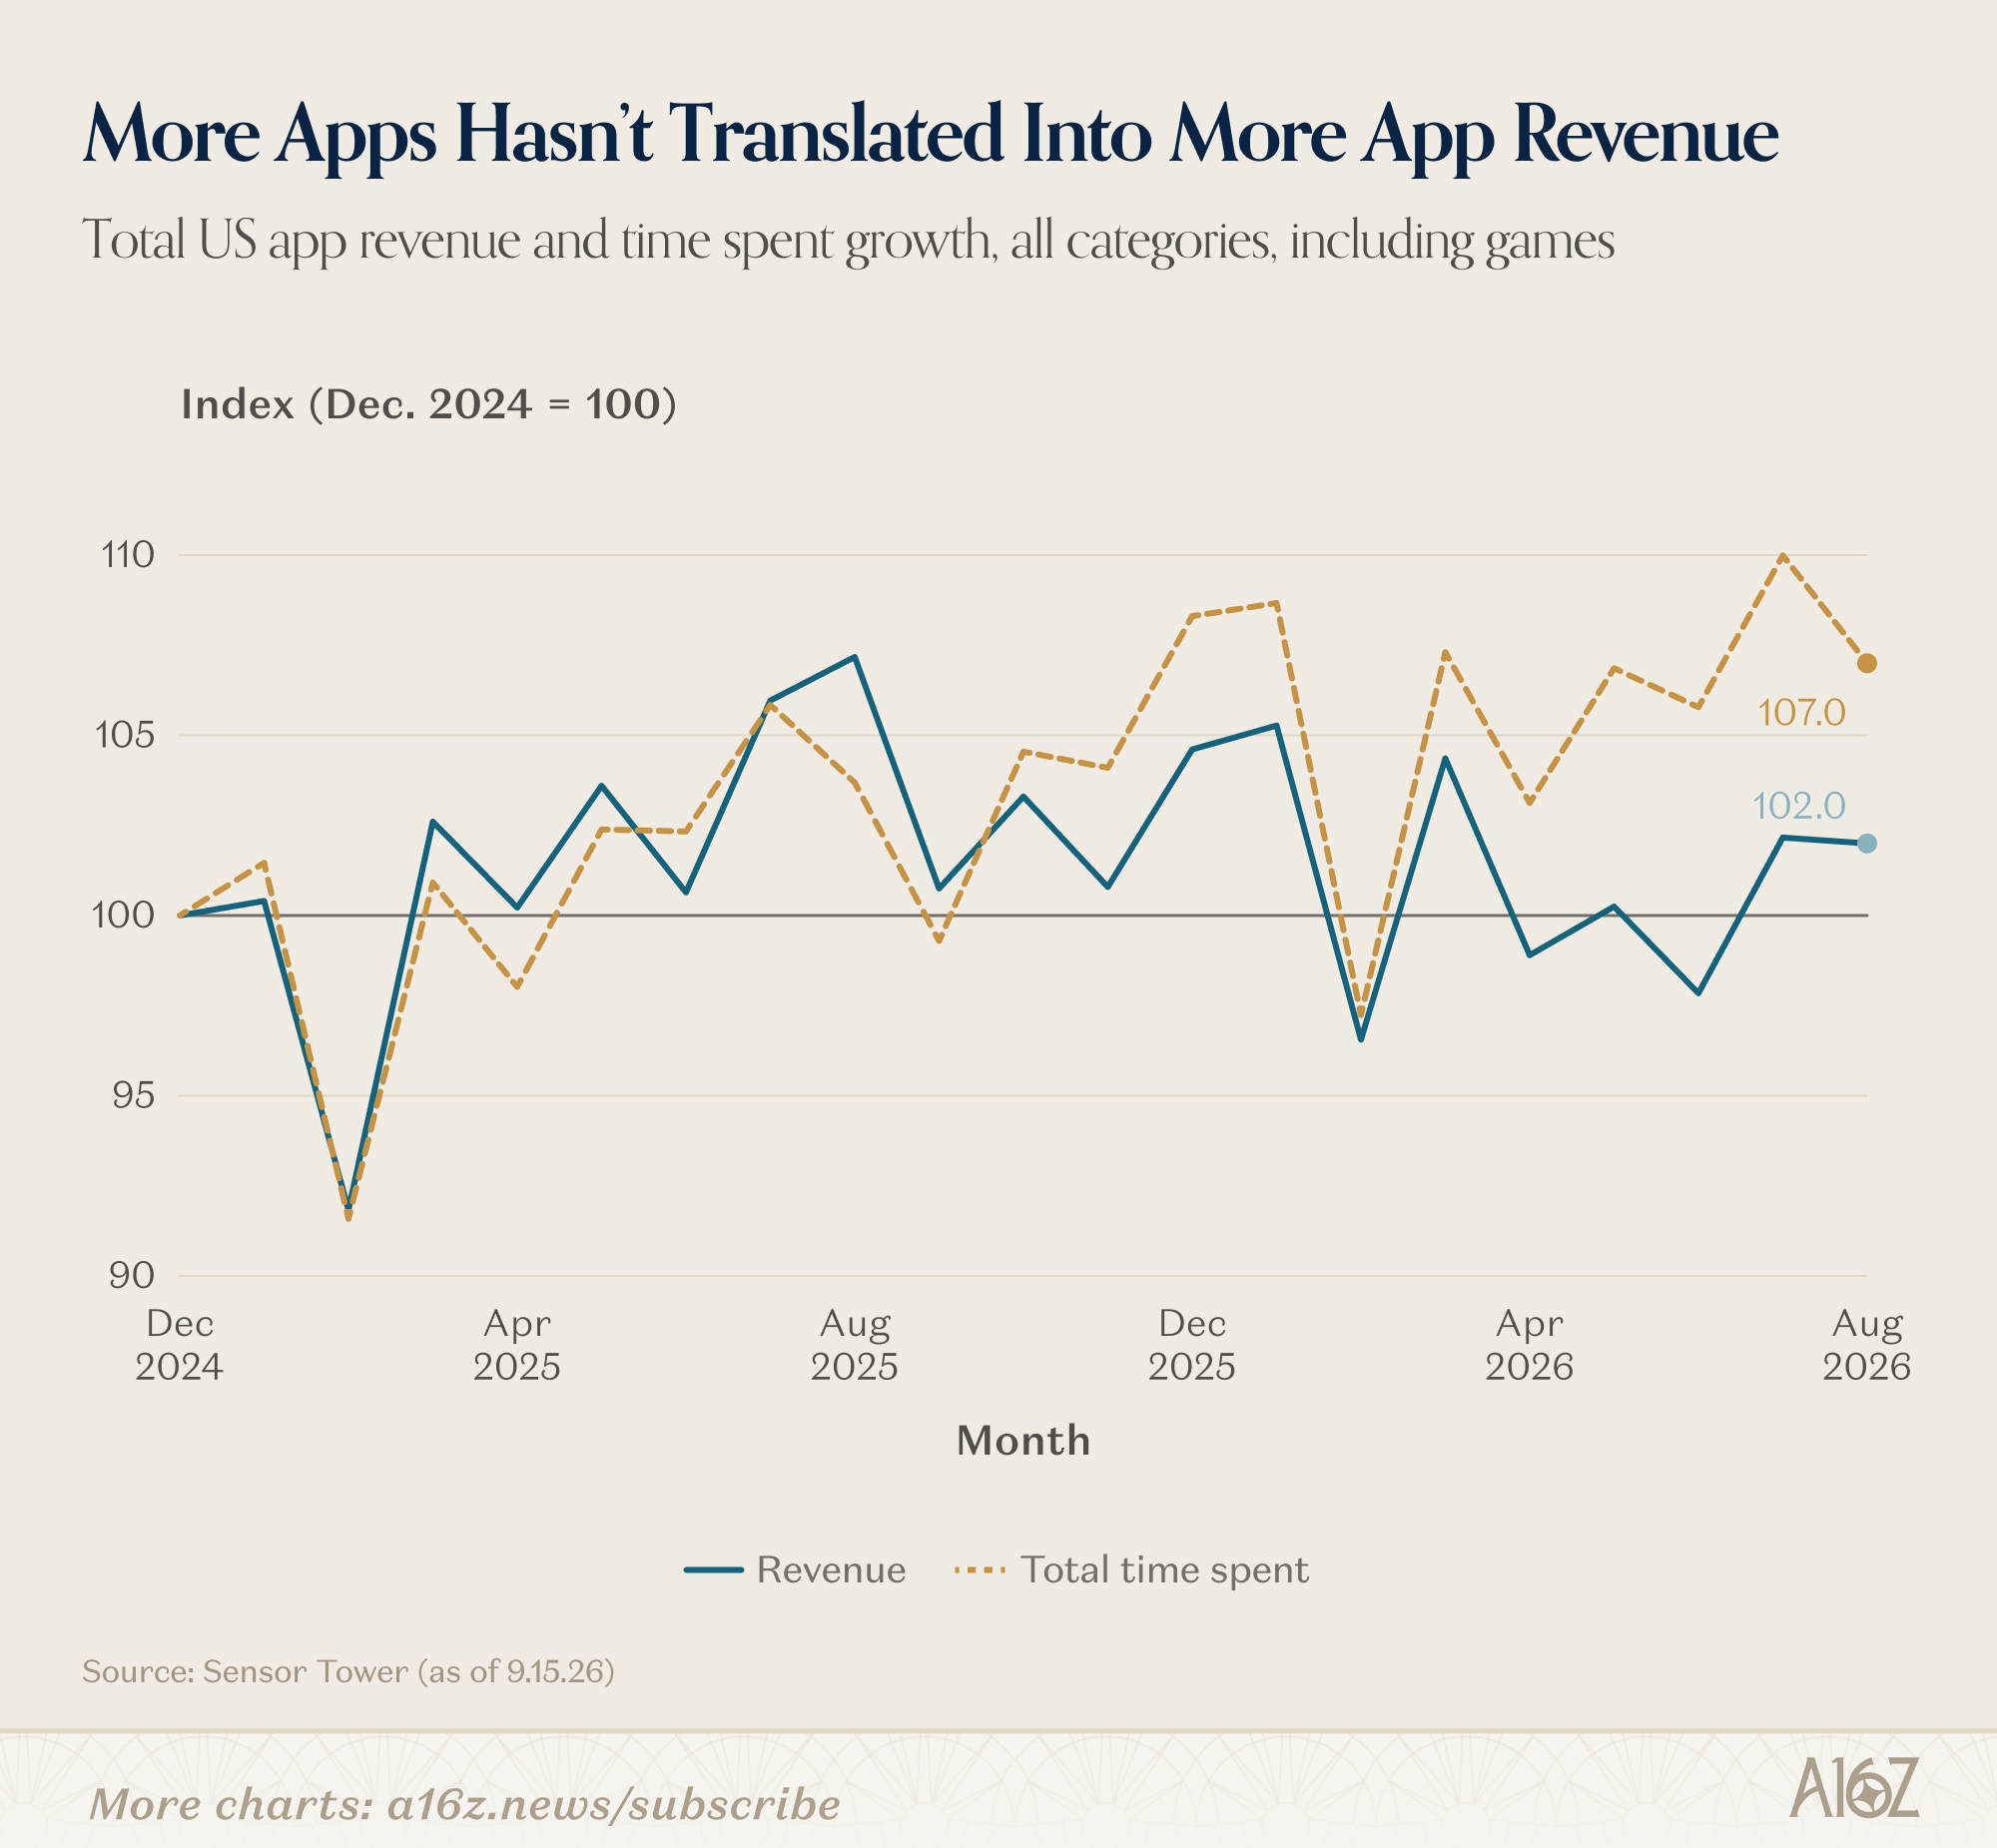
SensorTower’s estimates indicate a ~2% increase in app revenues, and a 7% increase in usage time, over the past year and a half. Once again, more apps has not led to a boom in the app economy.
Beneath the surface, however, it is nonetheless clear that AI is making a difference:
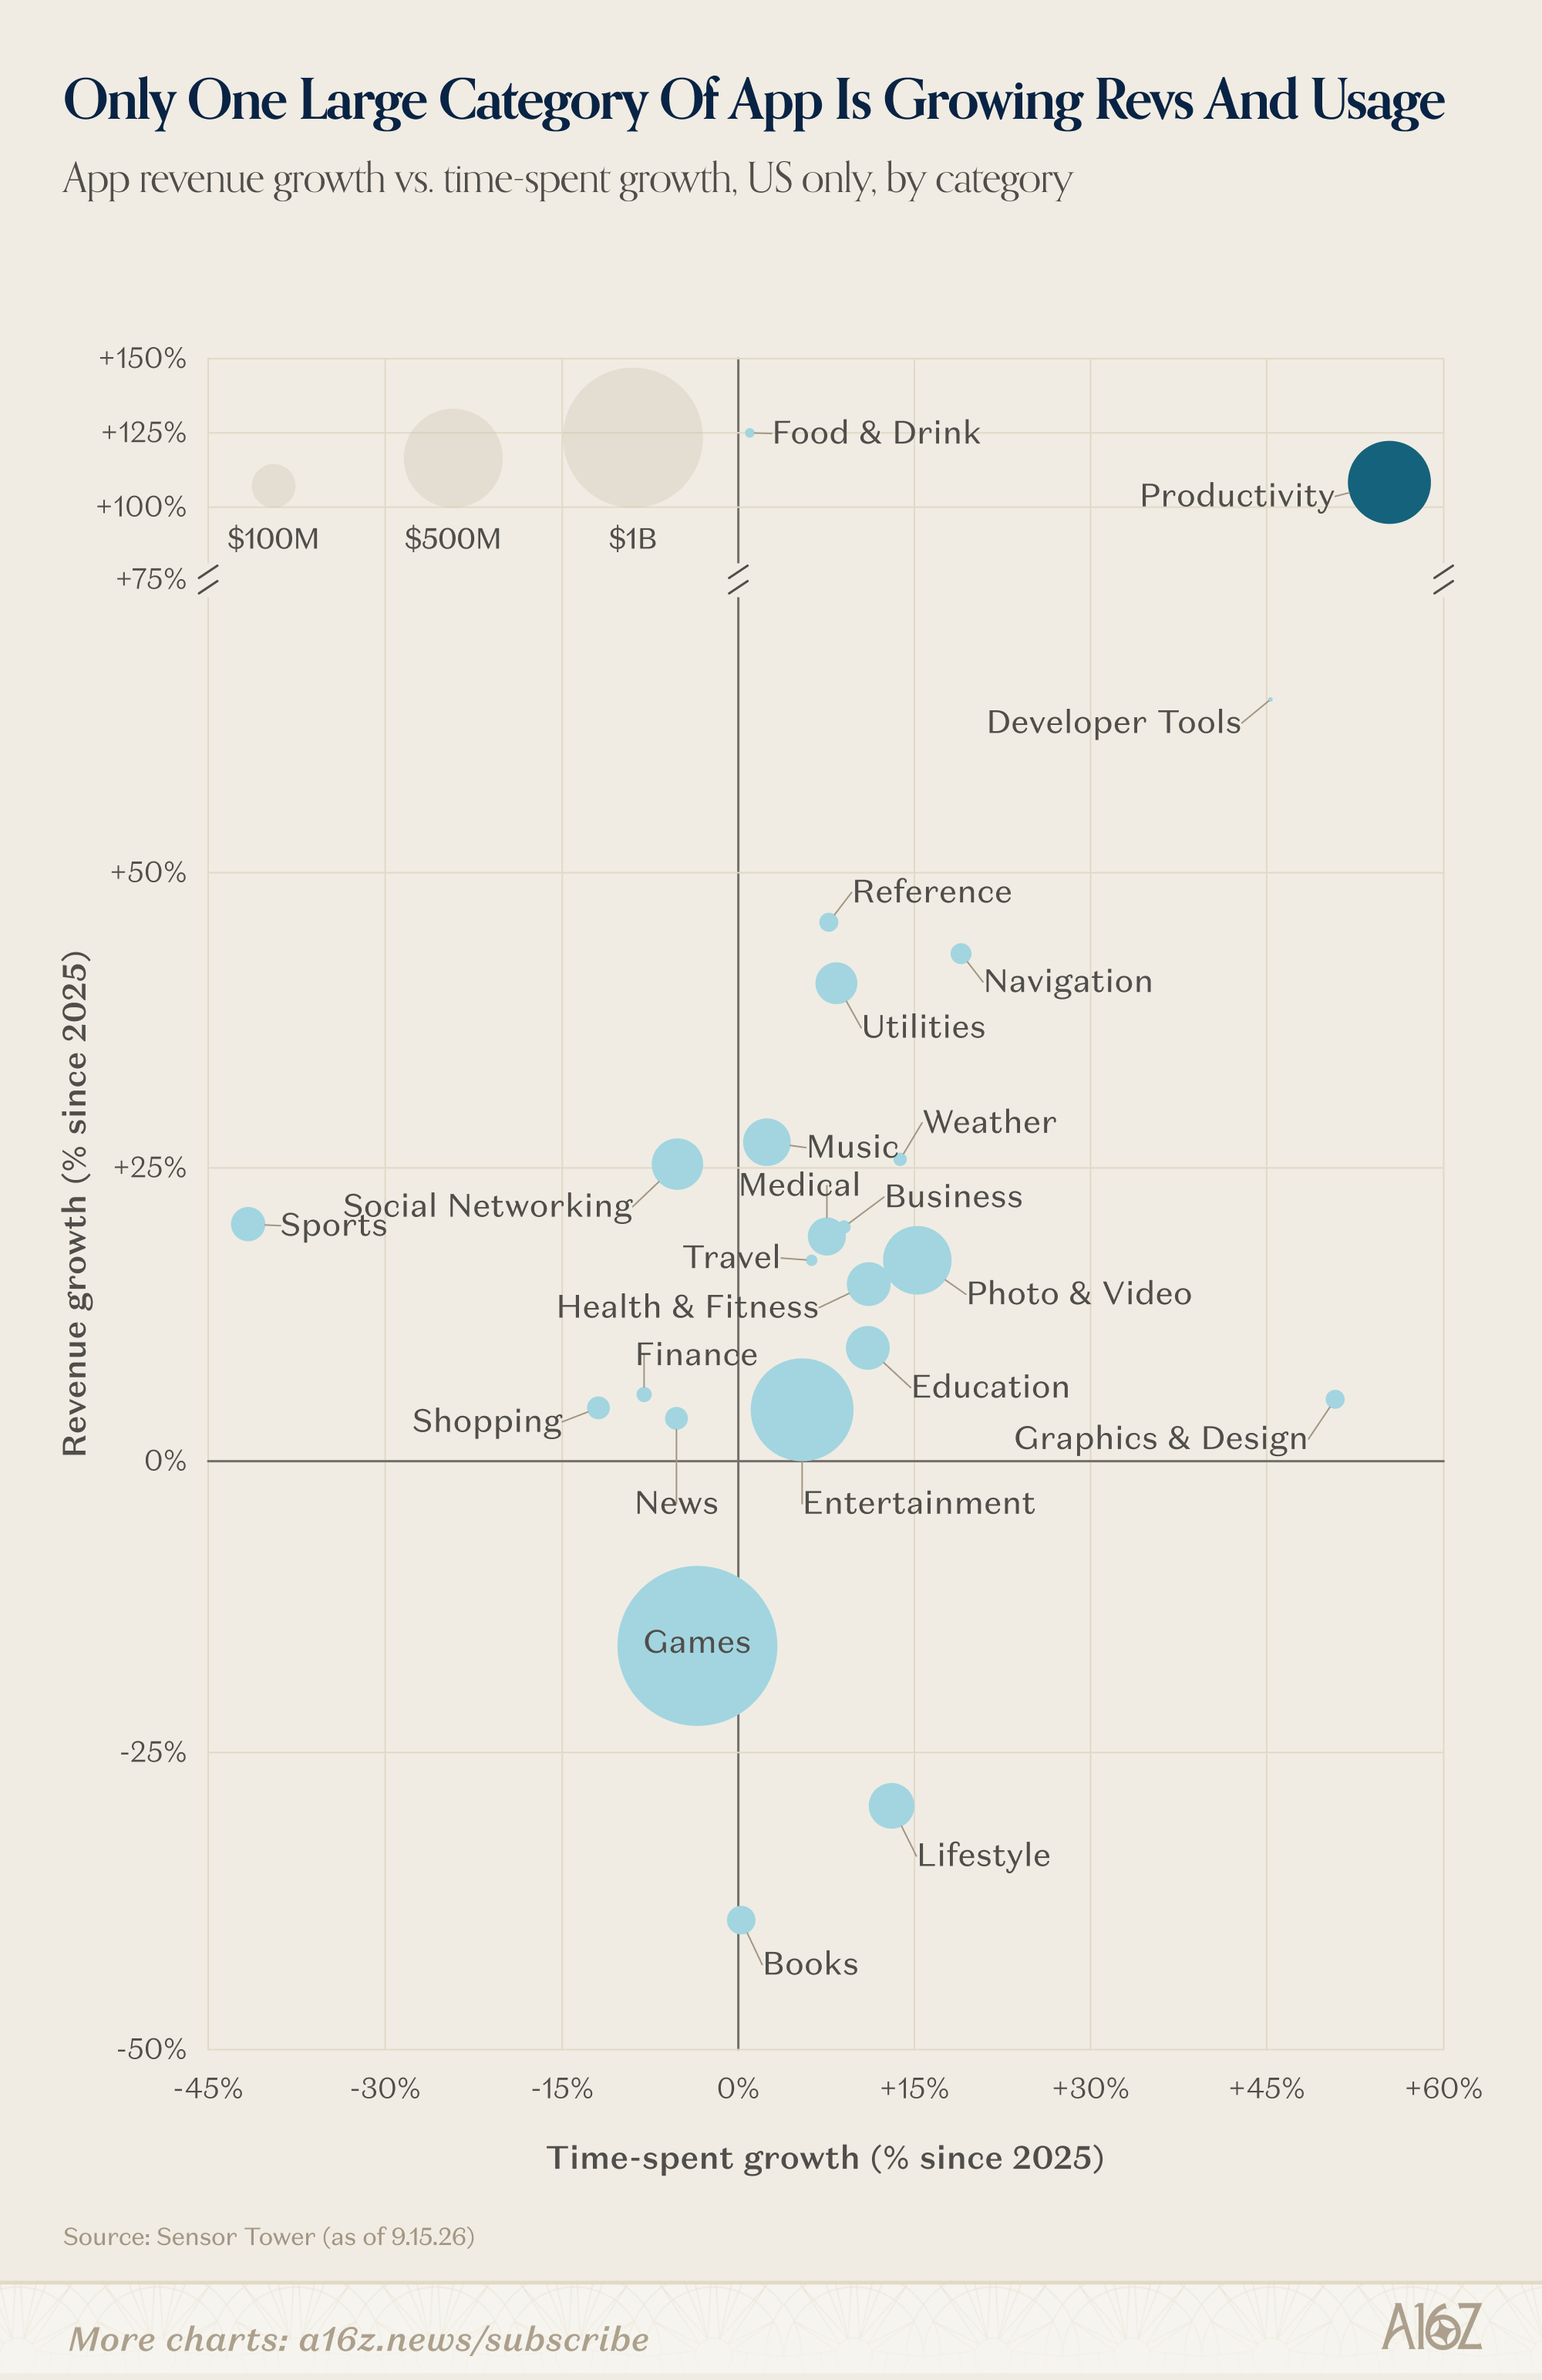
The category with the fastest growing time-spent (and the second fastest growing revenue, after the relatively tiny Food & Drink category) is Productivity, driven by none other than ChatGPT, Claude, Gemini and Grok. Another standout category, albeit a tiny one, is Dev Tools, where Replit is by far the category leader for growth.
AI apps are plainly very popular, but the apps made by AI, not so much.
Consider this one small footnote in the broader question of “when will AI adoption show up in GDP?” (and the answer, in this case, is when the apps get much better).
In the bigger scheme of things, paid consumer AI adoption remains quite low, even as it grows:
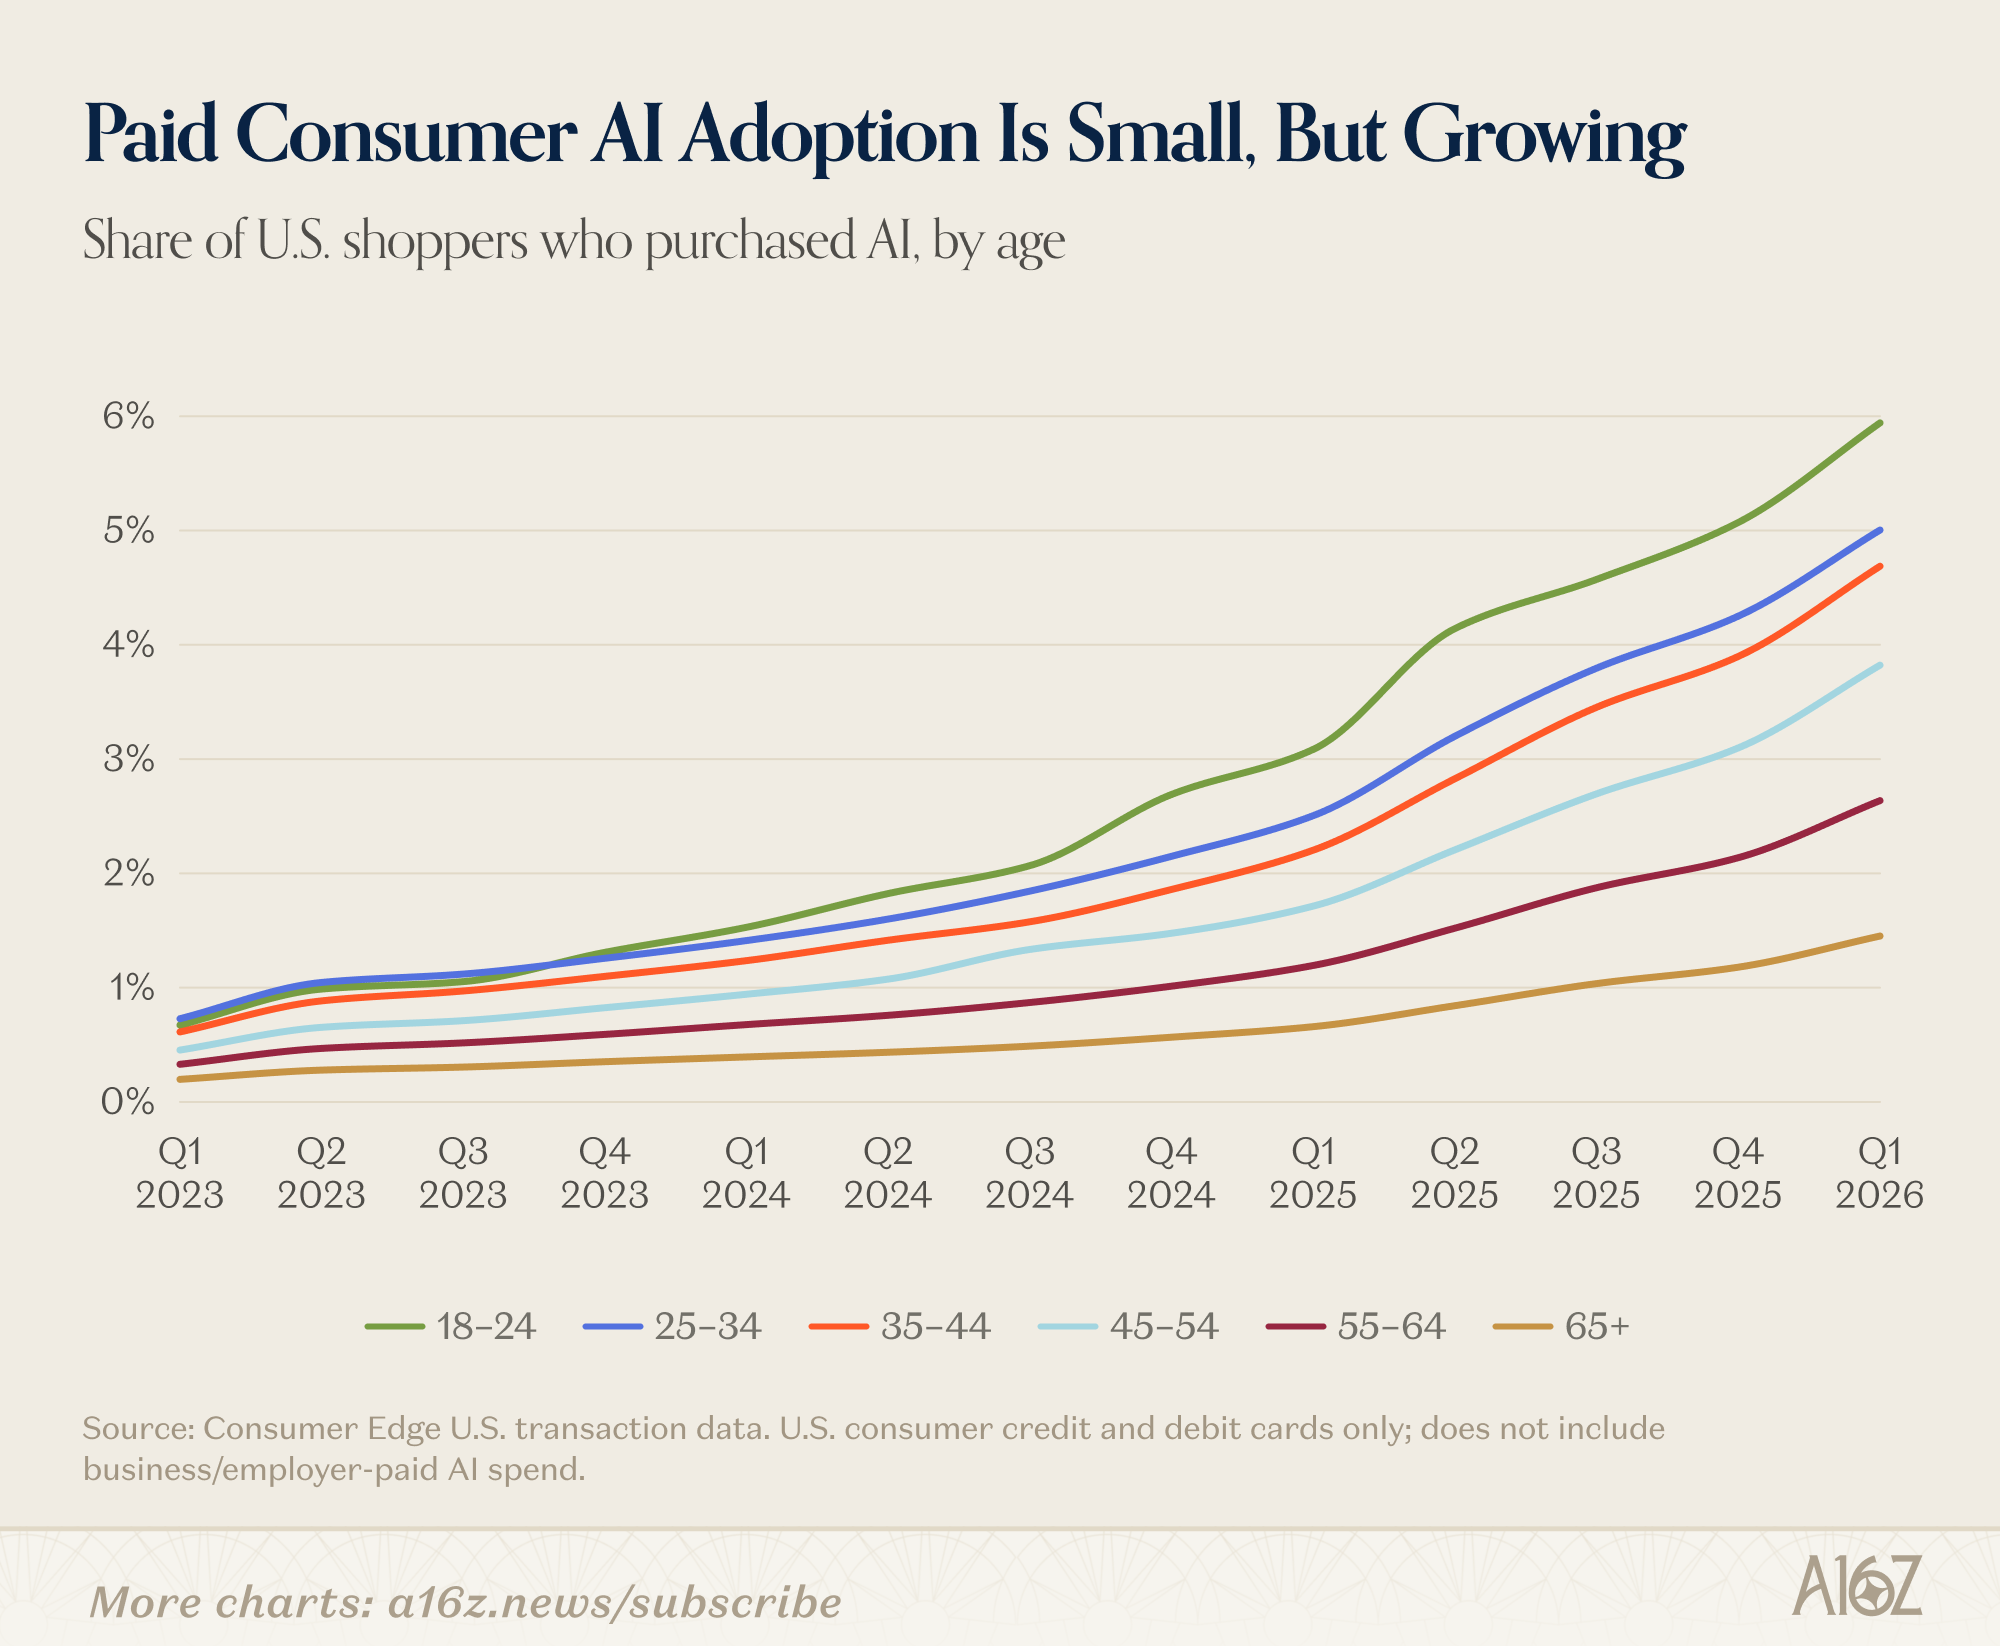
Consumer Edge indicates that, as of Q1, paid consumer AI adoption was around ~3%, with younger folks out-adopting older folks by ~4x.
So, yes, as cringey as it is to say, it’s nonetheless true: we’re still so early.
New Breed of Unicorn
On the subject of AI’s early ripple effects through the economy, one area where they are clearly visible is in the landscape for venture-backed companies.
Not only is AI driving historically large value creation in a historically small share of companies, there’s some data to suggest that AI is minting an entirely new breed of unicorn—one that is younger, and faster-growing than before.
According to data from SVB, while the entire universe of venture-backed $1B+ companies has gotten steadily older, the recent vintage has gotten progressively younger:
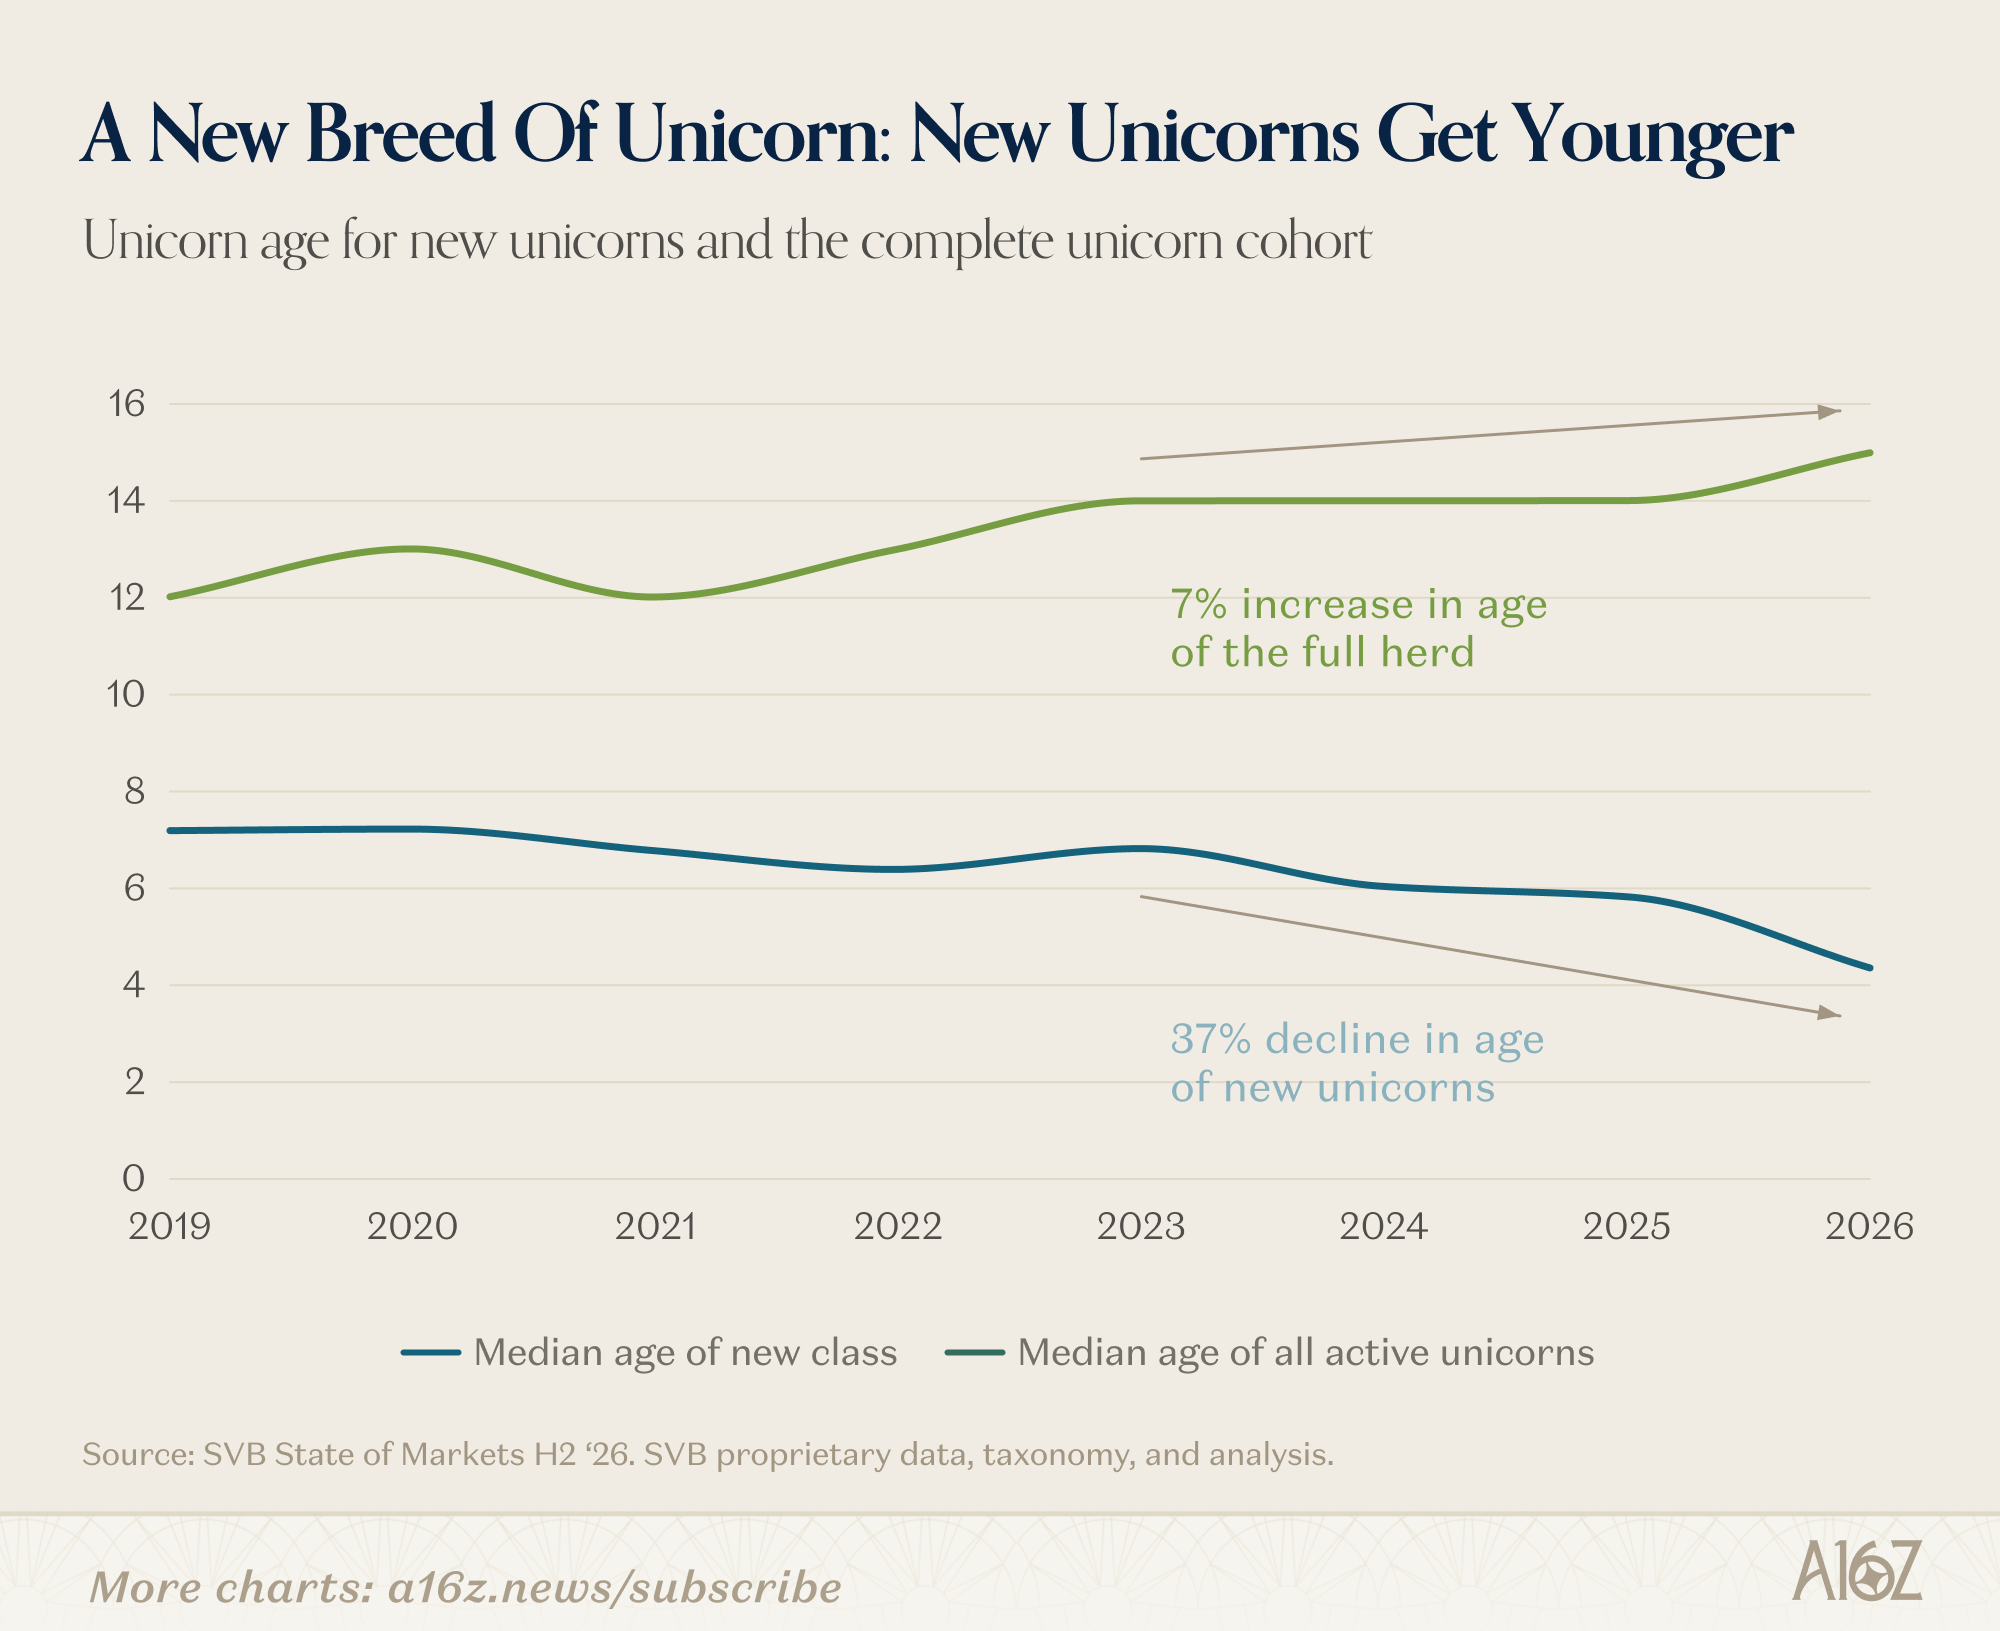
The “full herd” has gotten ~7% older, but the median age for new unicorns is now just a shade over 4 years, reflecting a 37% decline since 2023.
It’s not just that unicorns are being minted earlier in their lifecycle than before. Across all the companies in SVB’s data, median revenue growth for the post-GPT generation is operating on a noticeably different curve:
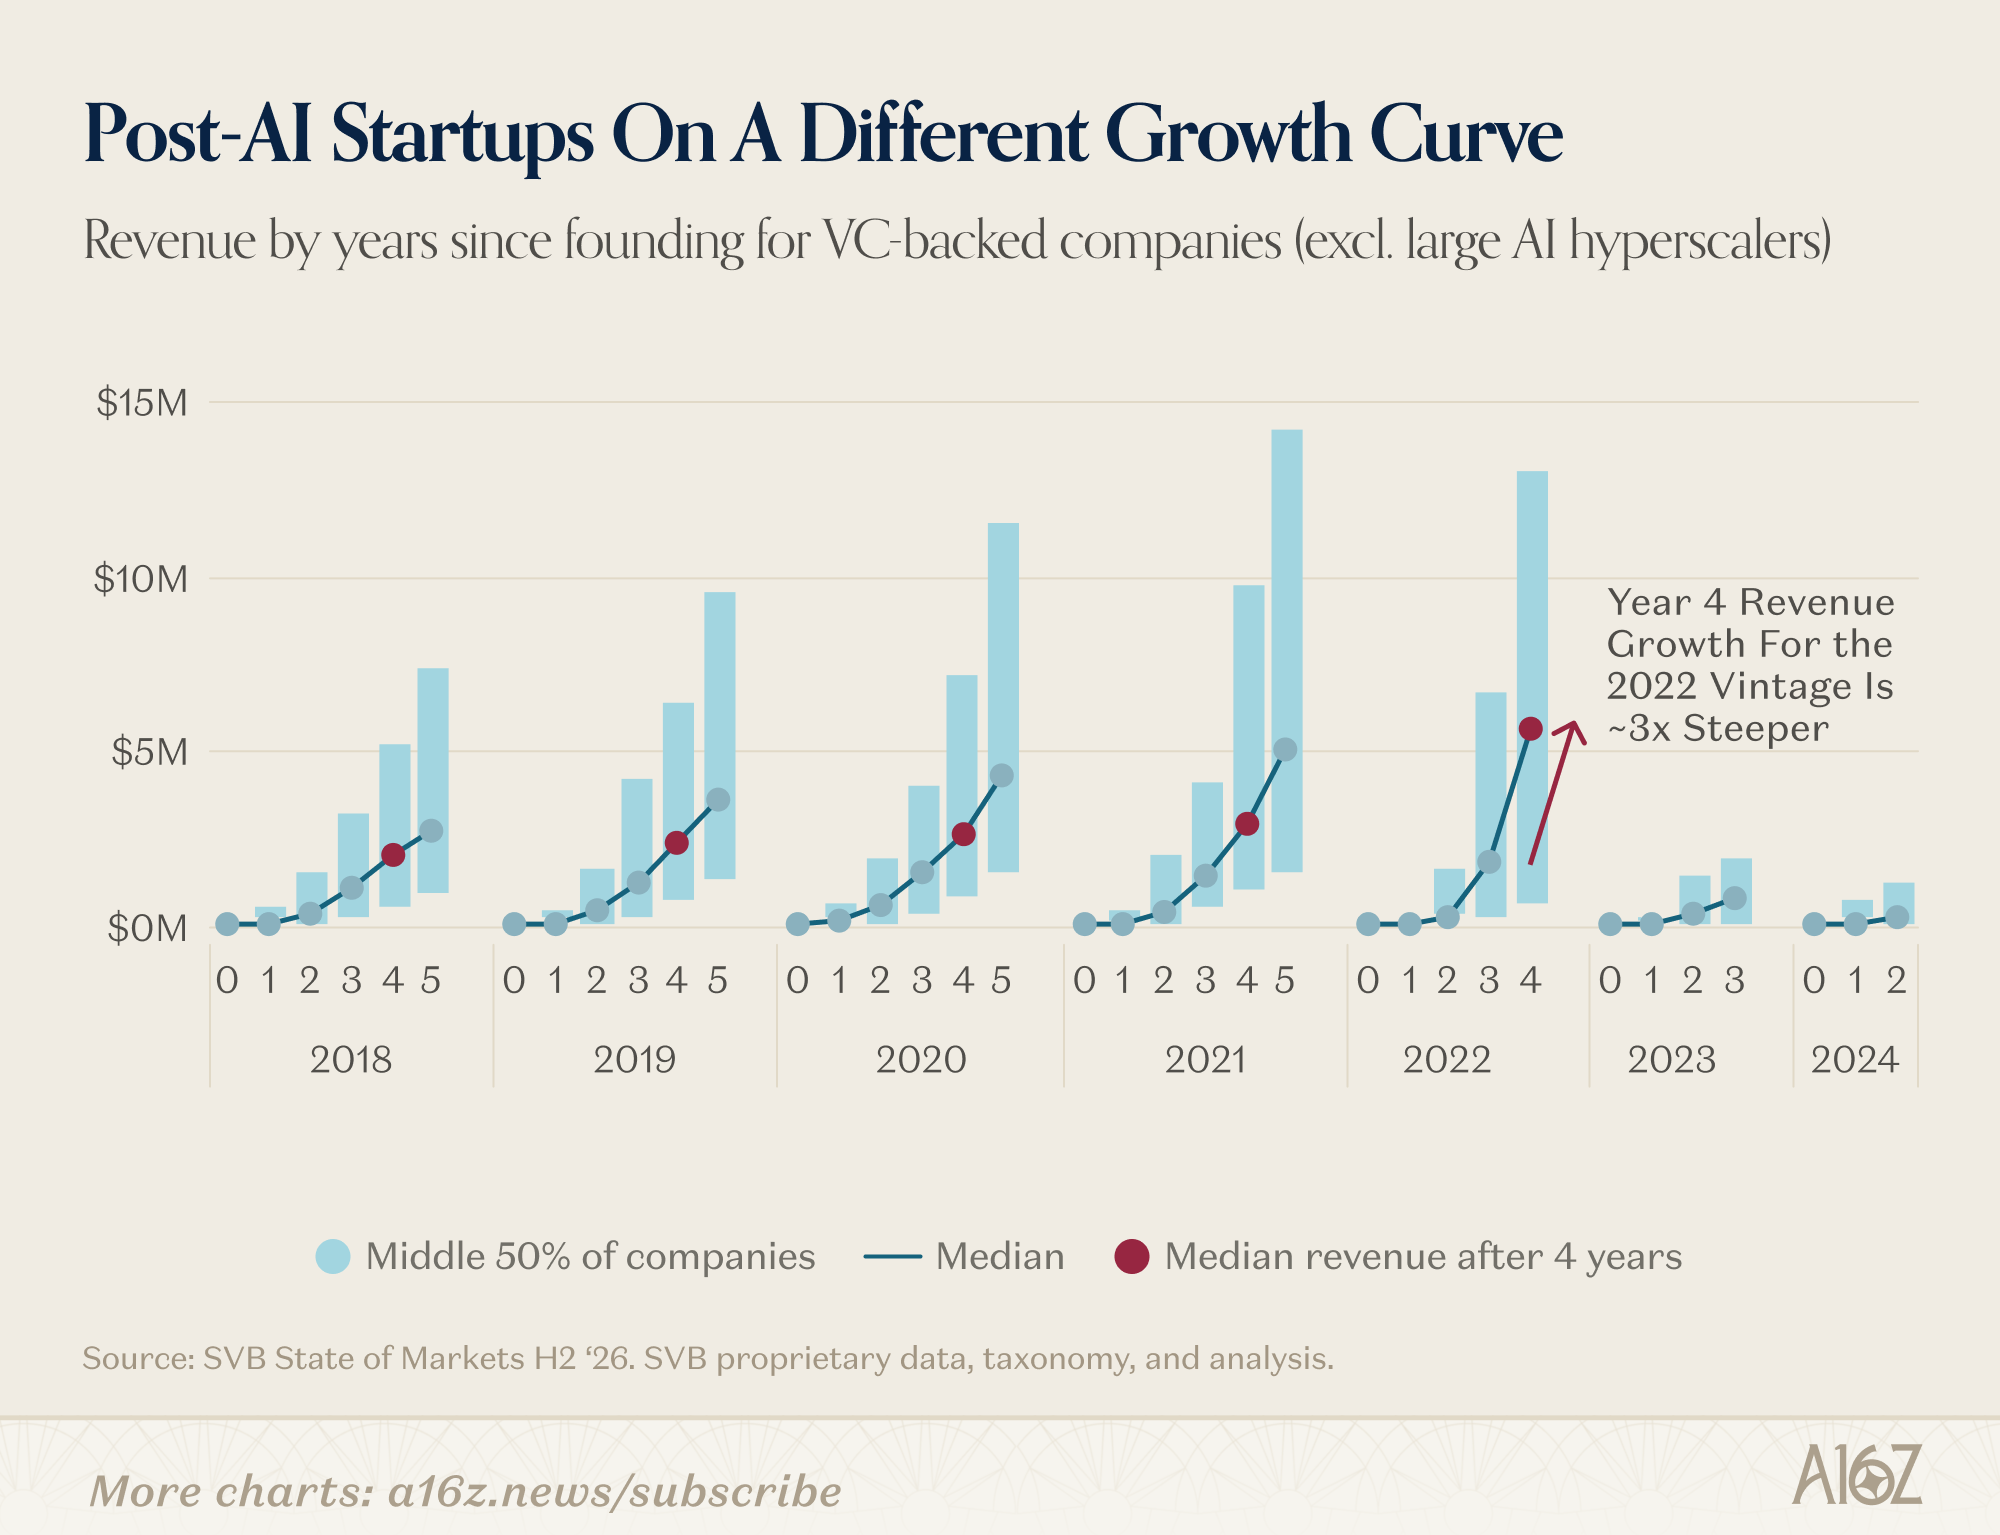
For the 2022 cohort, the revenue jump from year 3 to 4 at the median is ~3x larger than earlier cohorts. Put another way, instead of going from $2M to $3M (as per the pre-GPT cohorts), the ‘22 batch went from $2.8M all the way to $5.6M.
Is that AI? It’s possible, but we’ll have to wait a bit to see if the ‘23 and ‘24 batches follow a similar trend.
Truthfully, the reality is a bit more complicated. AI has changed the venture landscape, but one feature of that shift has been greater allocations to non-software businesses, which one would expect to have very different growth curves. By contrast, one could easily imagine that the ‘22 batch is full of fast-growing “AI wrappers” that may or may not be able to keep it up.
Growth-curves aside, it is undoubtedly the case that AI has changed the game for pre-AI techcos. For one thing, the combination of AI-driven shift in VC strategy plus higher interest rates has led to a noticeable change in operating priorities: beginning in Q1’22, techcos in all verticals tracked by SVB, began trading growth for profitability:
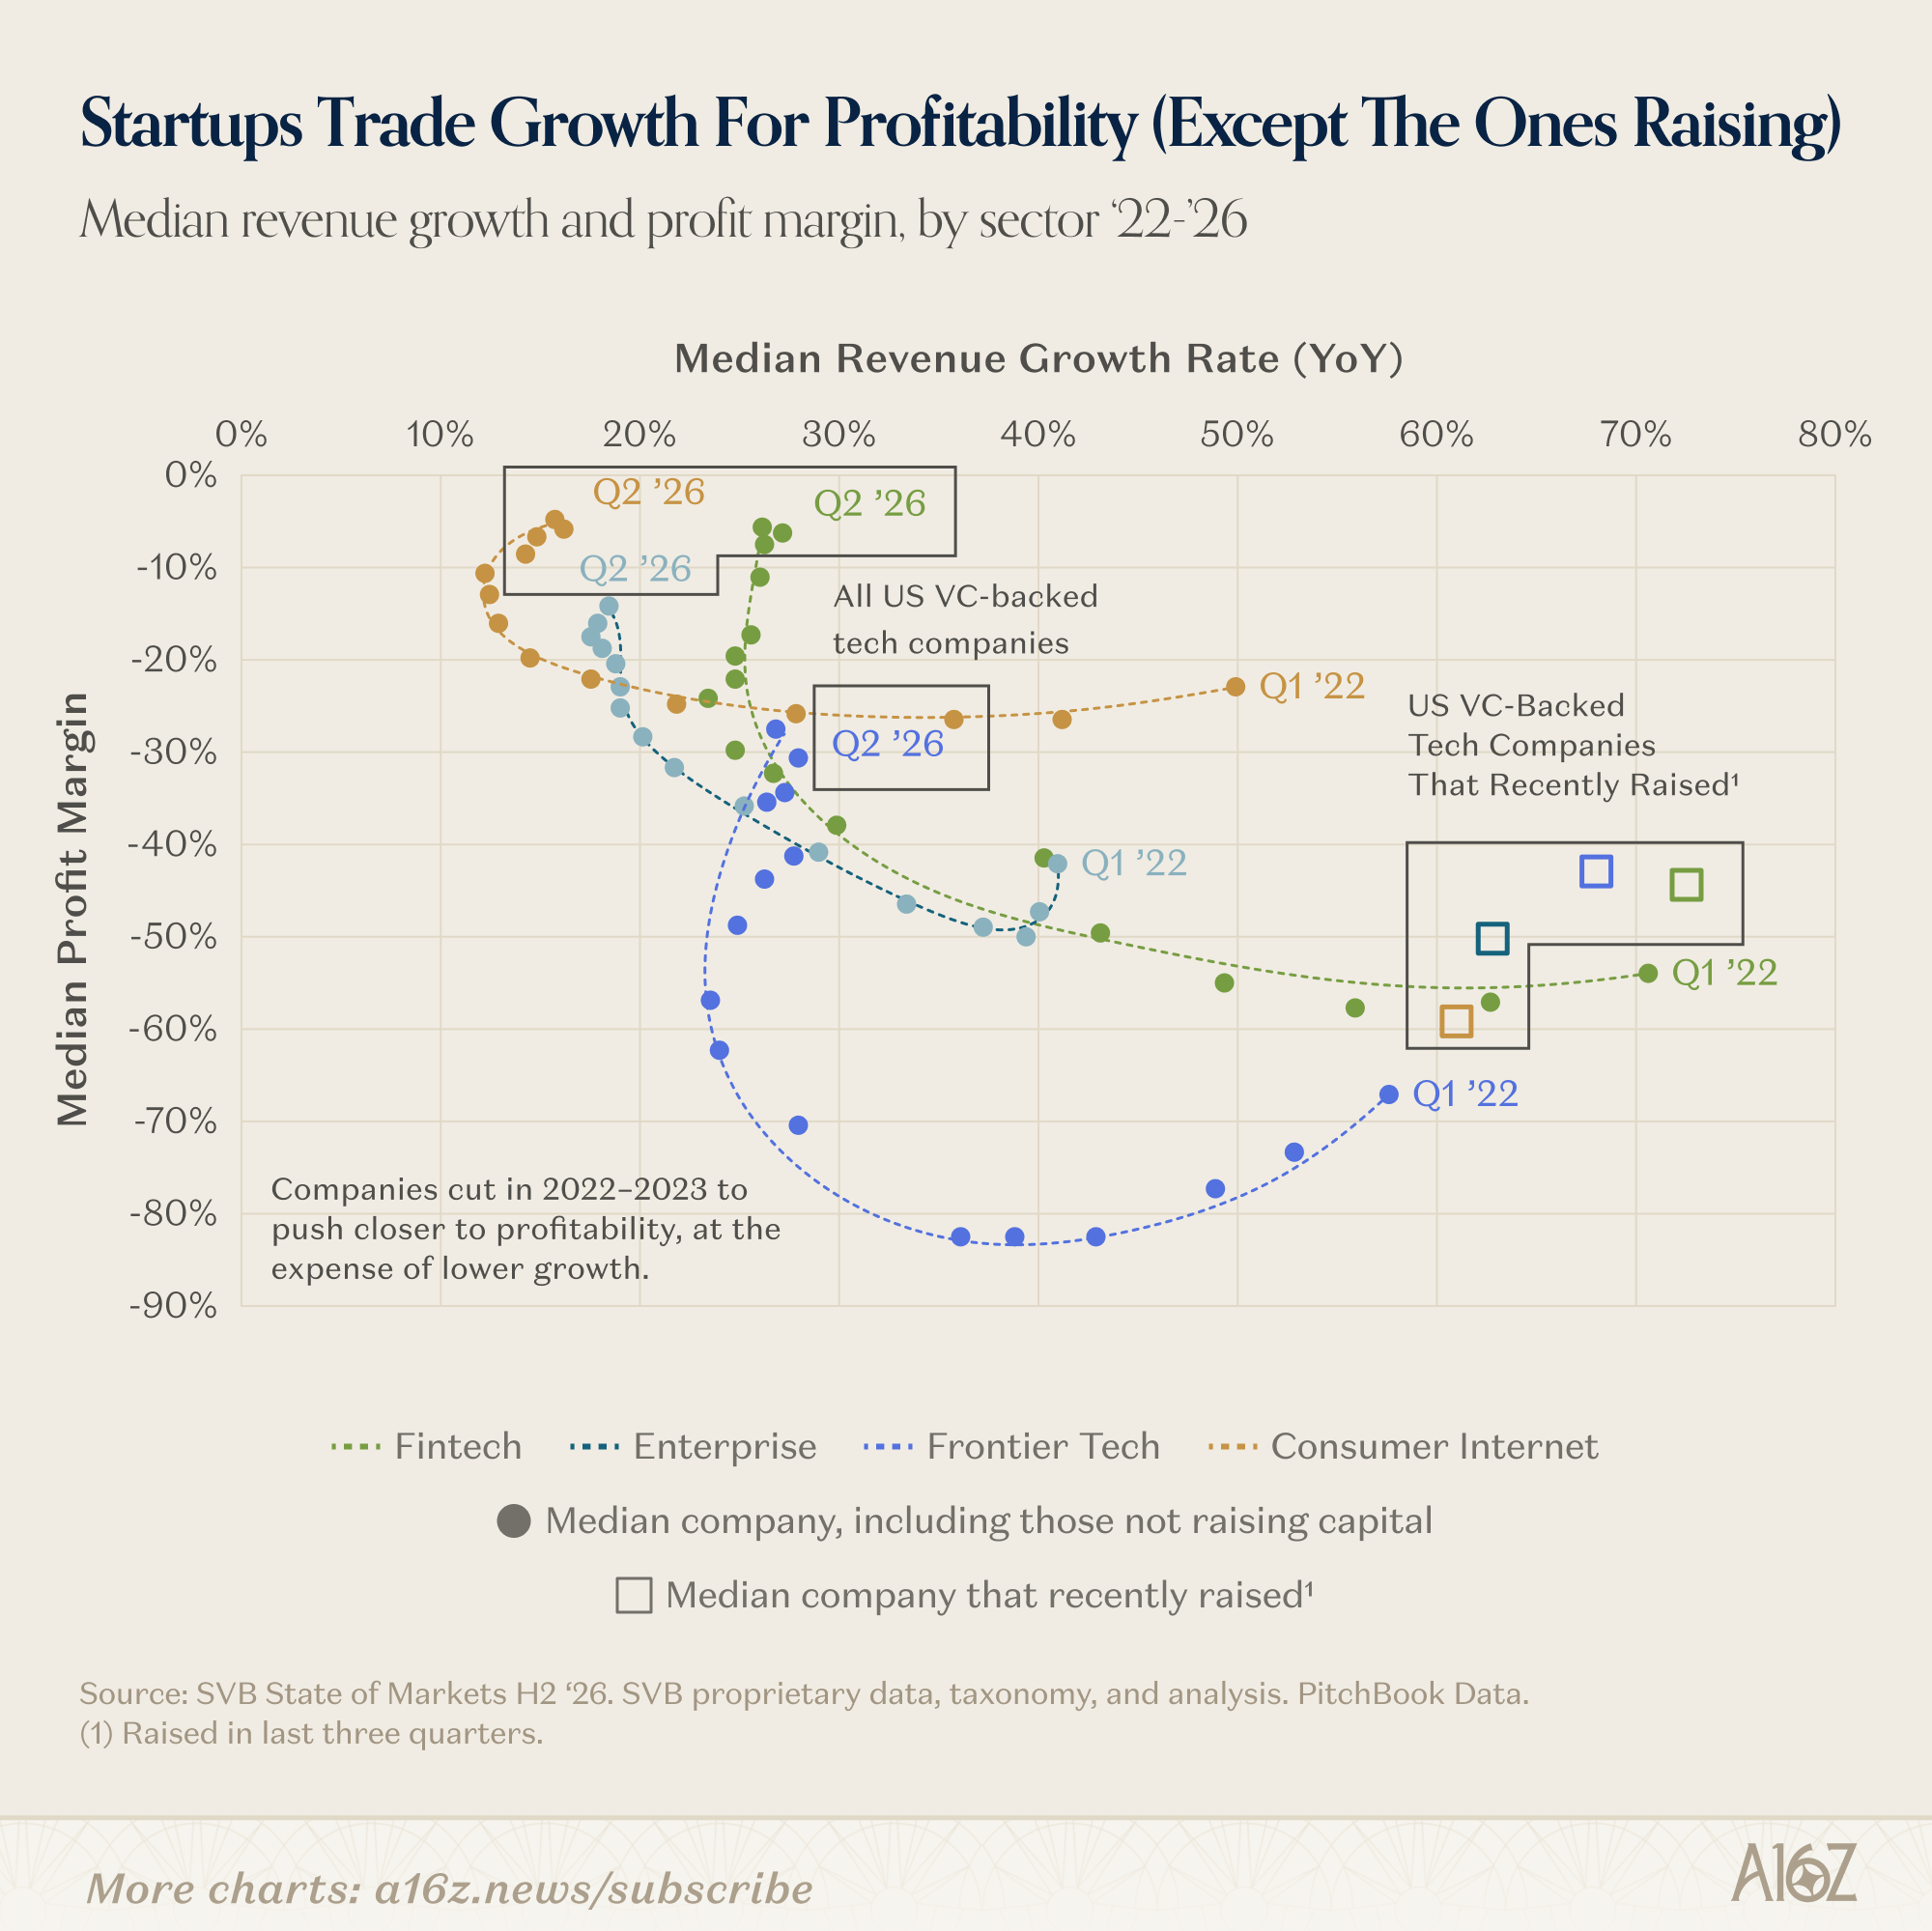
Growth went from 40%-70% at the median all the way down to 15%-30%, while margins did the opposite, running from deeply unprofitable to nearly breakeven. By contrast, the companies getting funded most recently have growth/profitability profiles not unlike the ‘22 standard.
Now, to be fair, ‘22 was something of a pandemic-reopening-ZIRP high watermark for growth, and then later, when interest rates went up, everyone battened down the hatches—public companies traded growth for profitability, too. Plus, growth does appear to have reaccelerated recently.
That all being said, companies minted during the previous cycle are confronting a decidedly new-normal. An historic number of businesses were founded, and now an historic number of businesses are shutting down:
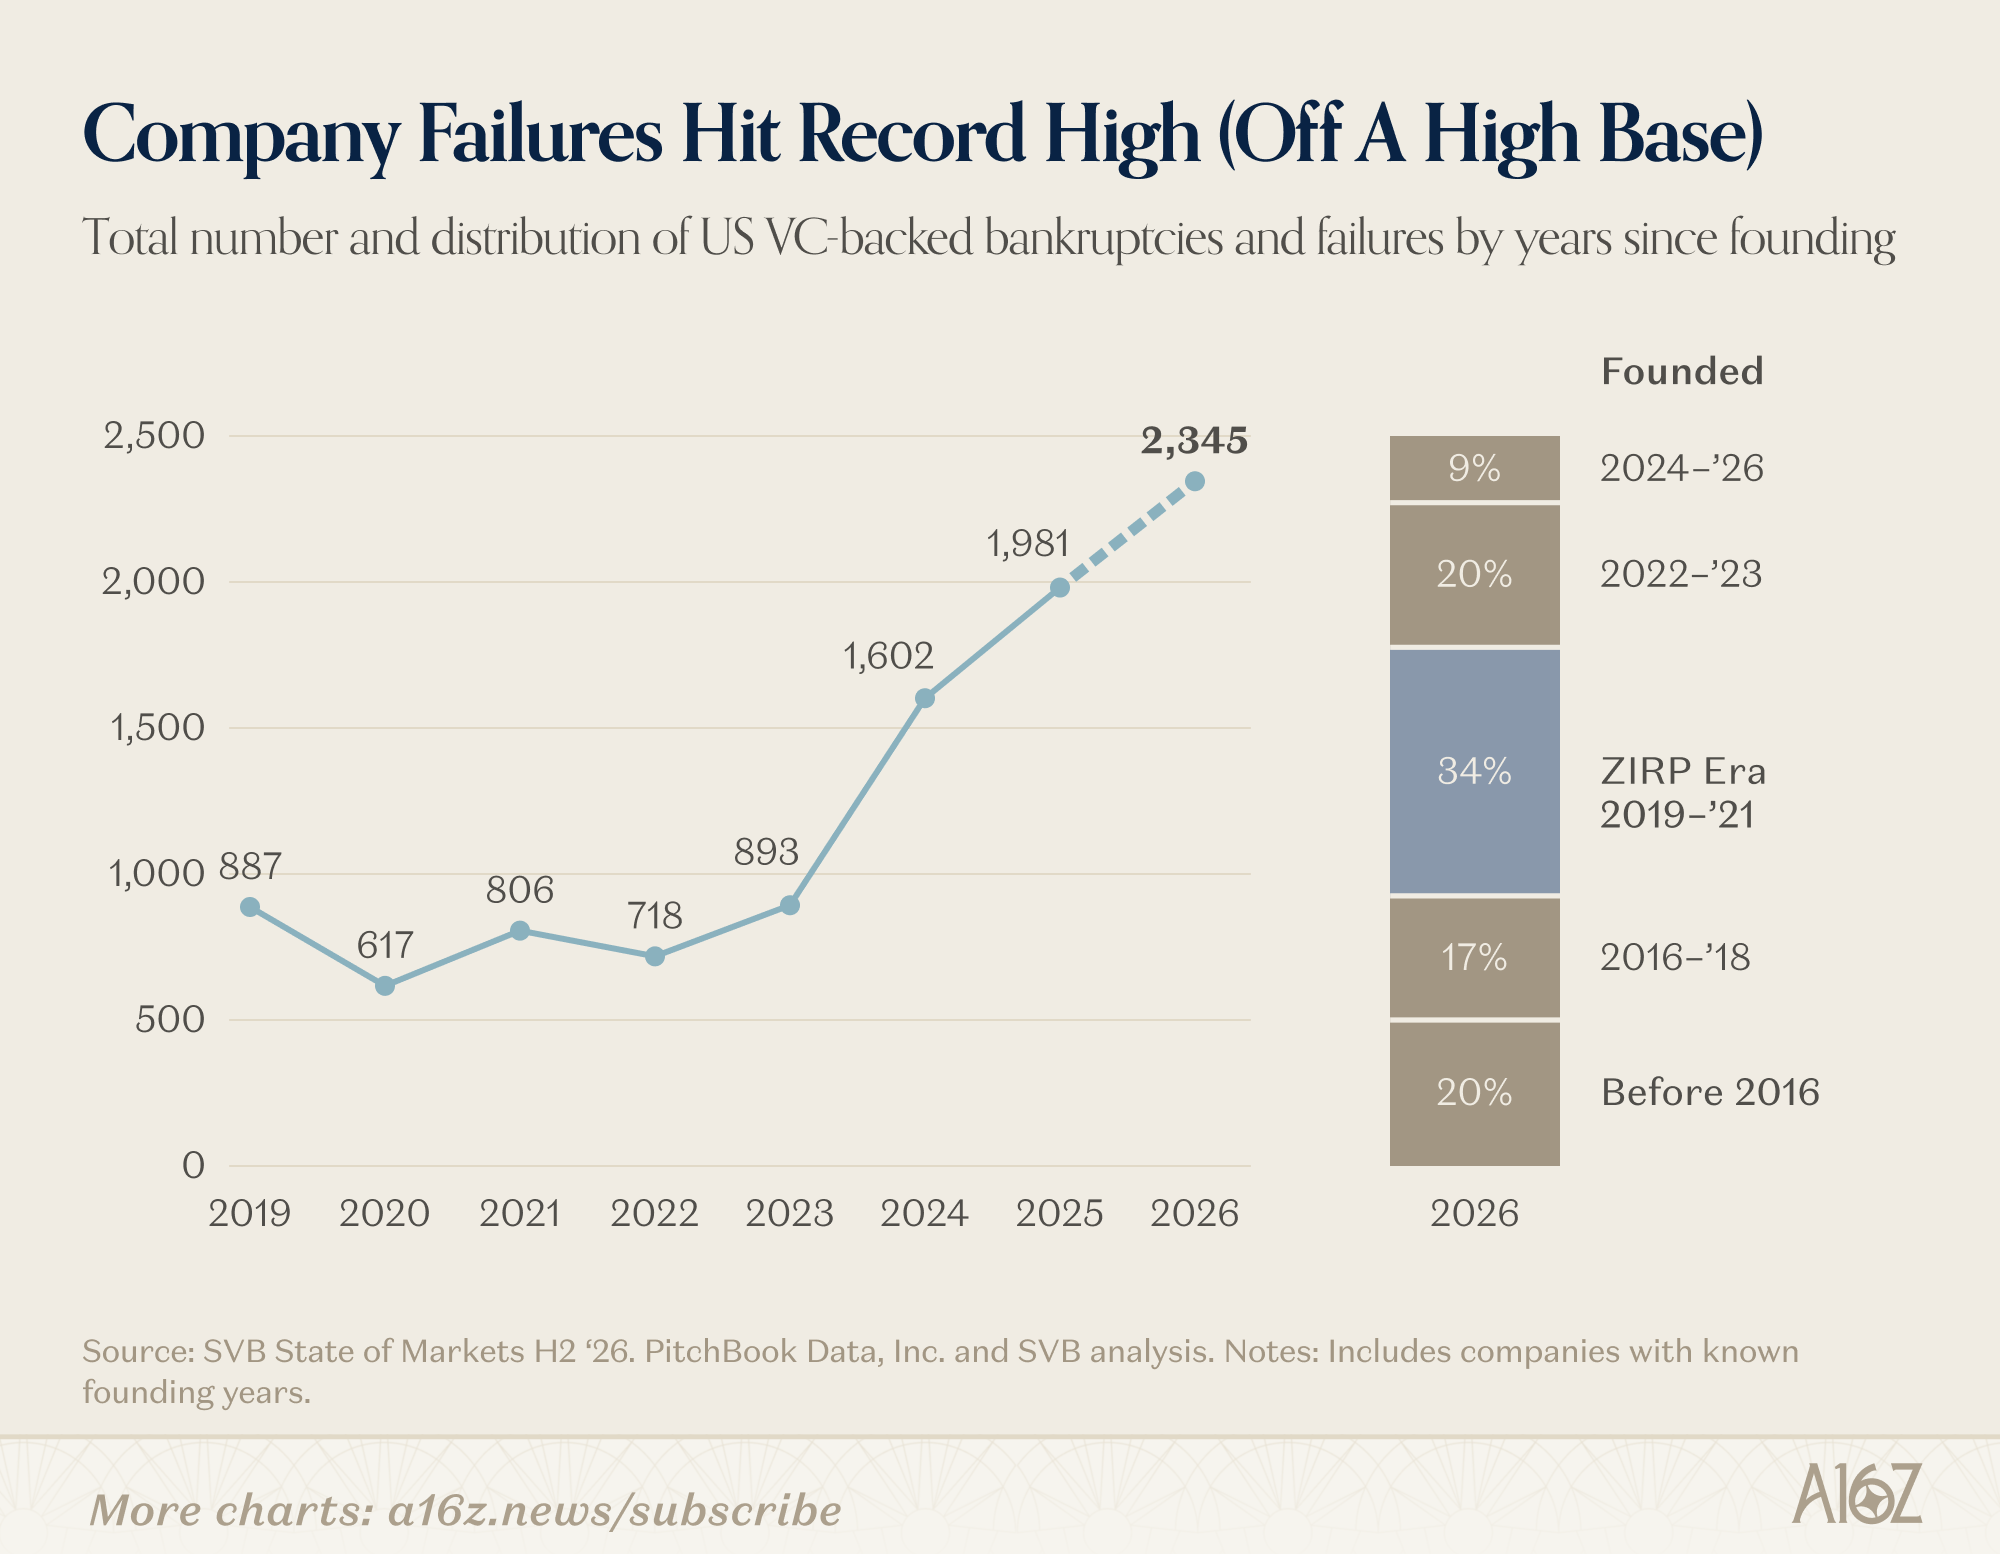
Unsurprisingly, the largest share of shutdowns comes from the peak-ZIRP vintages.
Likewise, SaaSpocalypse appears to have hit startup land, as well:
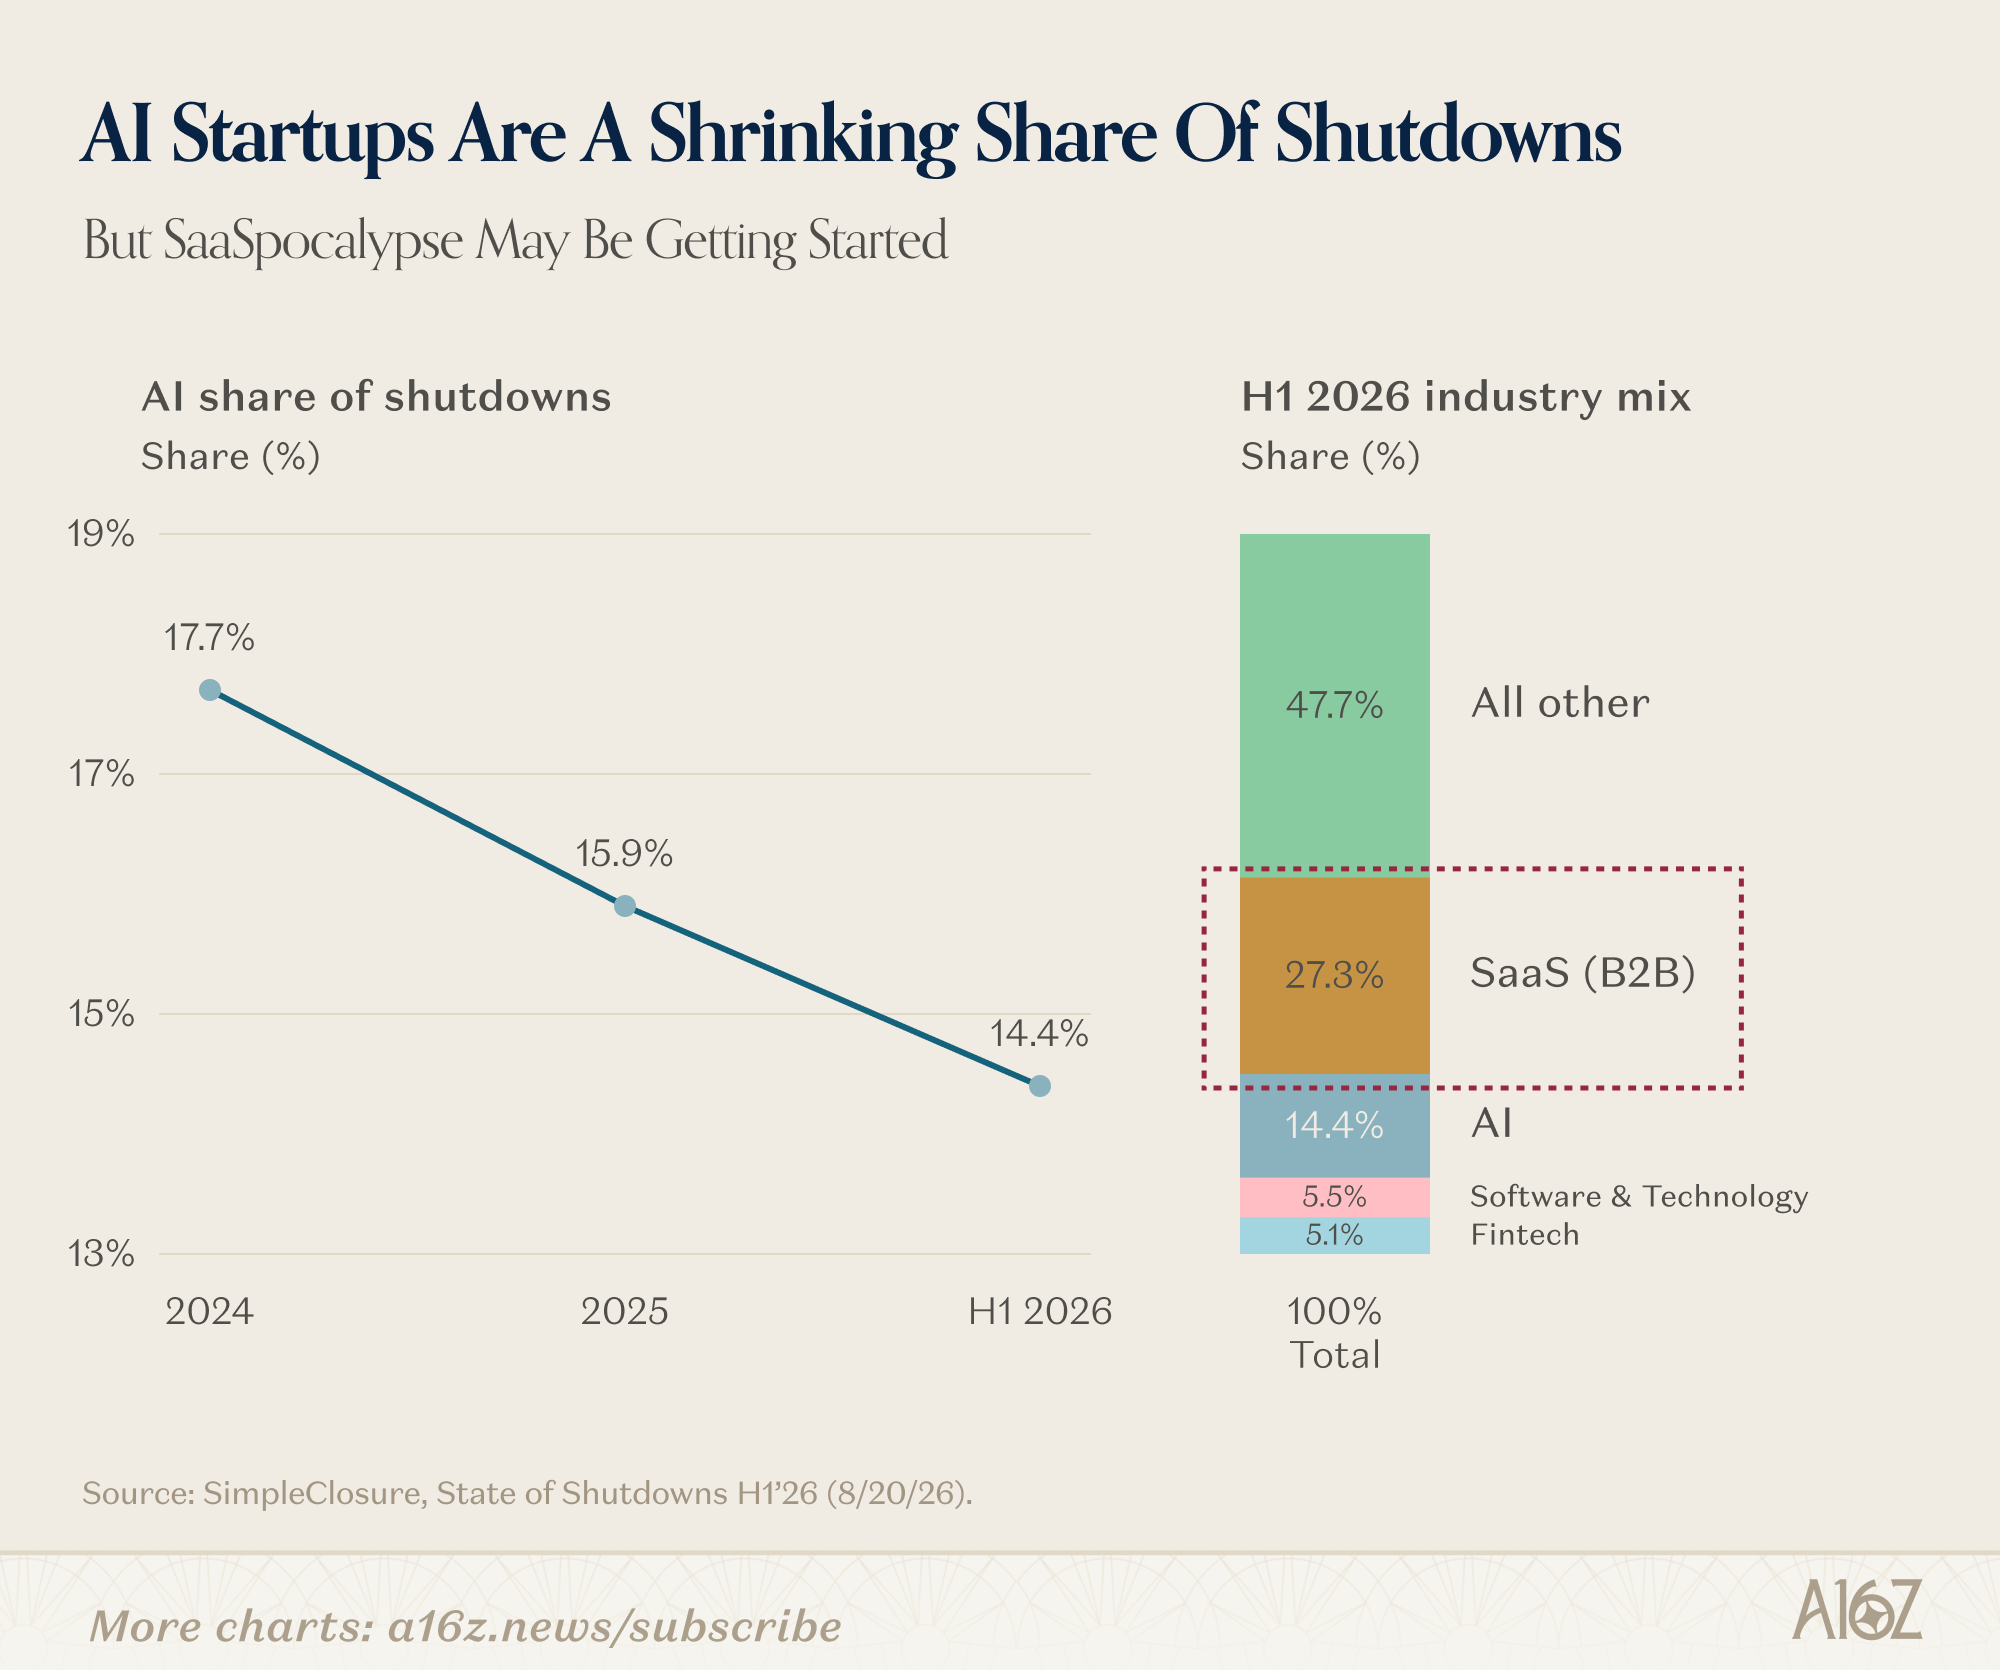
According to data from SimpleClosure, while AI startups are an increasingly small share of shutdowns, B2B SaaS represents more than a quarter of H1 ‘26 shutdowns.
Again, the denominator was high—B2B SaaS was a very popular category—and, beyond that, it’s hard to say how much of this is AI-driven disruption vs. a shift in thematic winds, but either way, the new cycle is not like the old cycle, and that’s not fun for everyone.
Citrini Called the Bottom
Speaking of SaaSpocalypse, here’s a fun one. Remember that Citrini doompost that foretold the end of software (and pretty much everything)?
Well, for now at least, Citrini seems to have ticked the bottom of the software selloff:
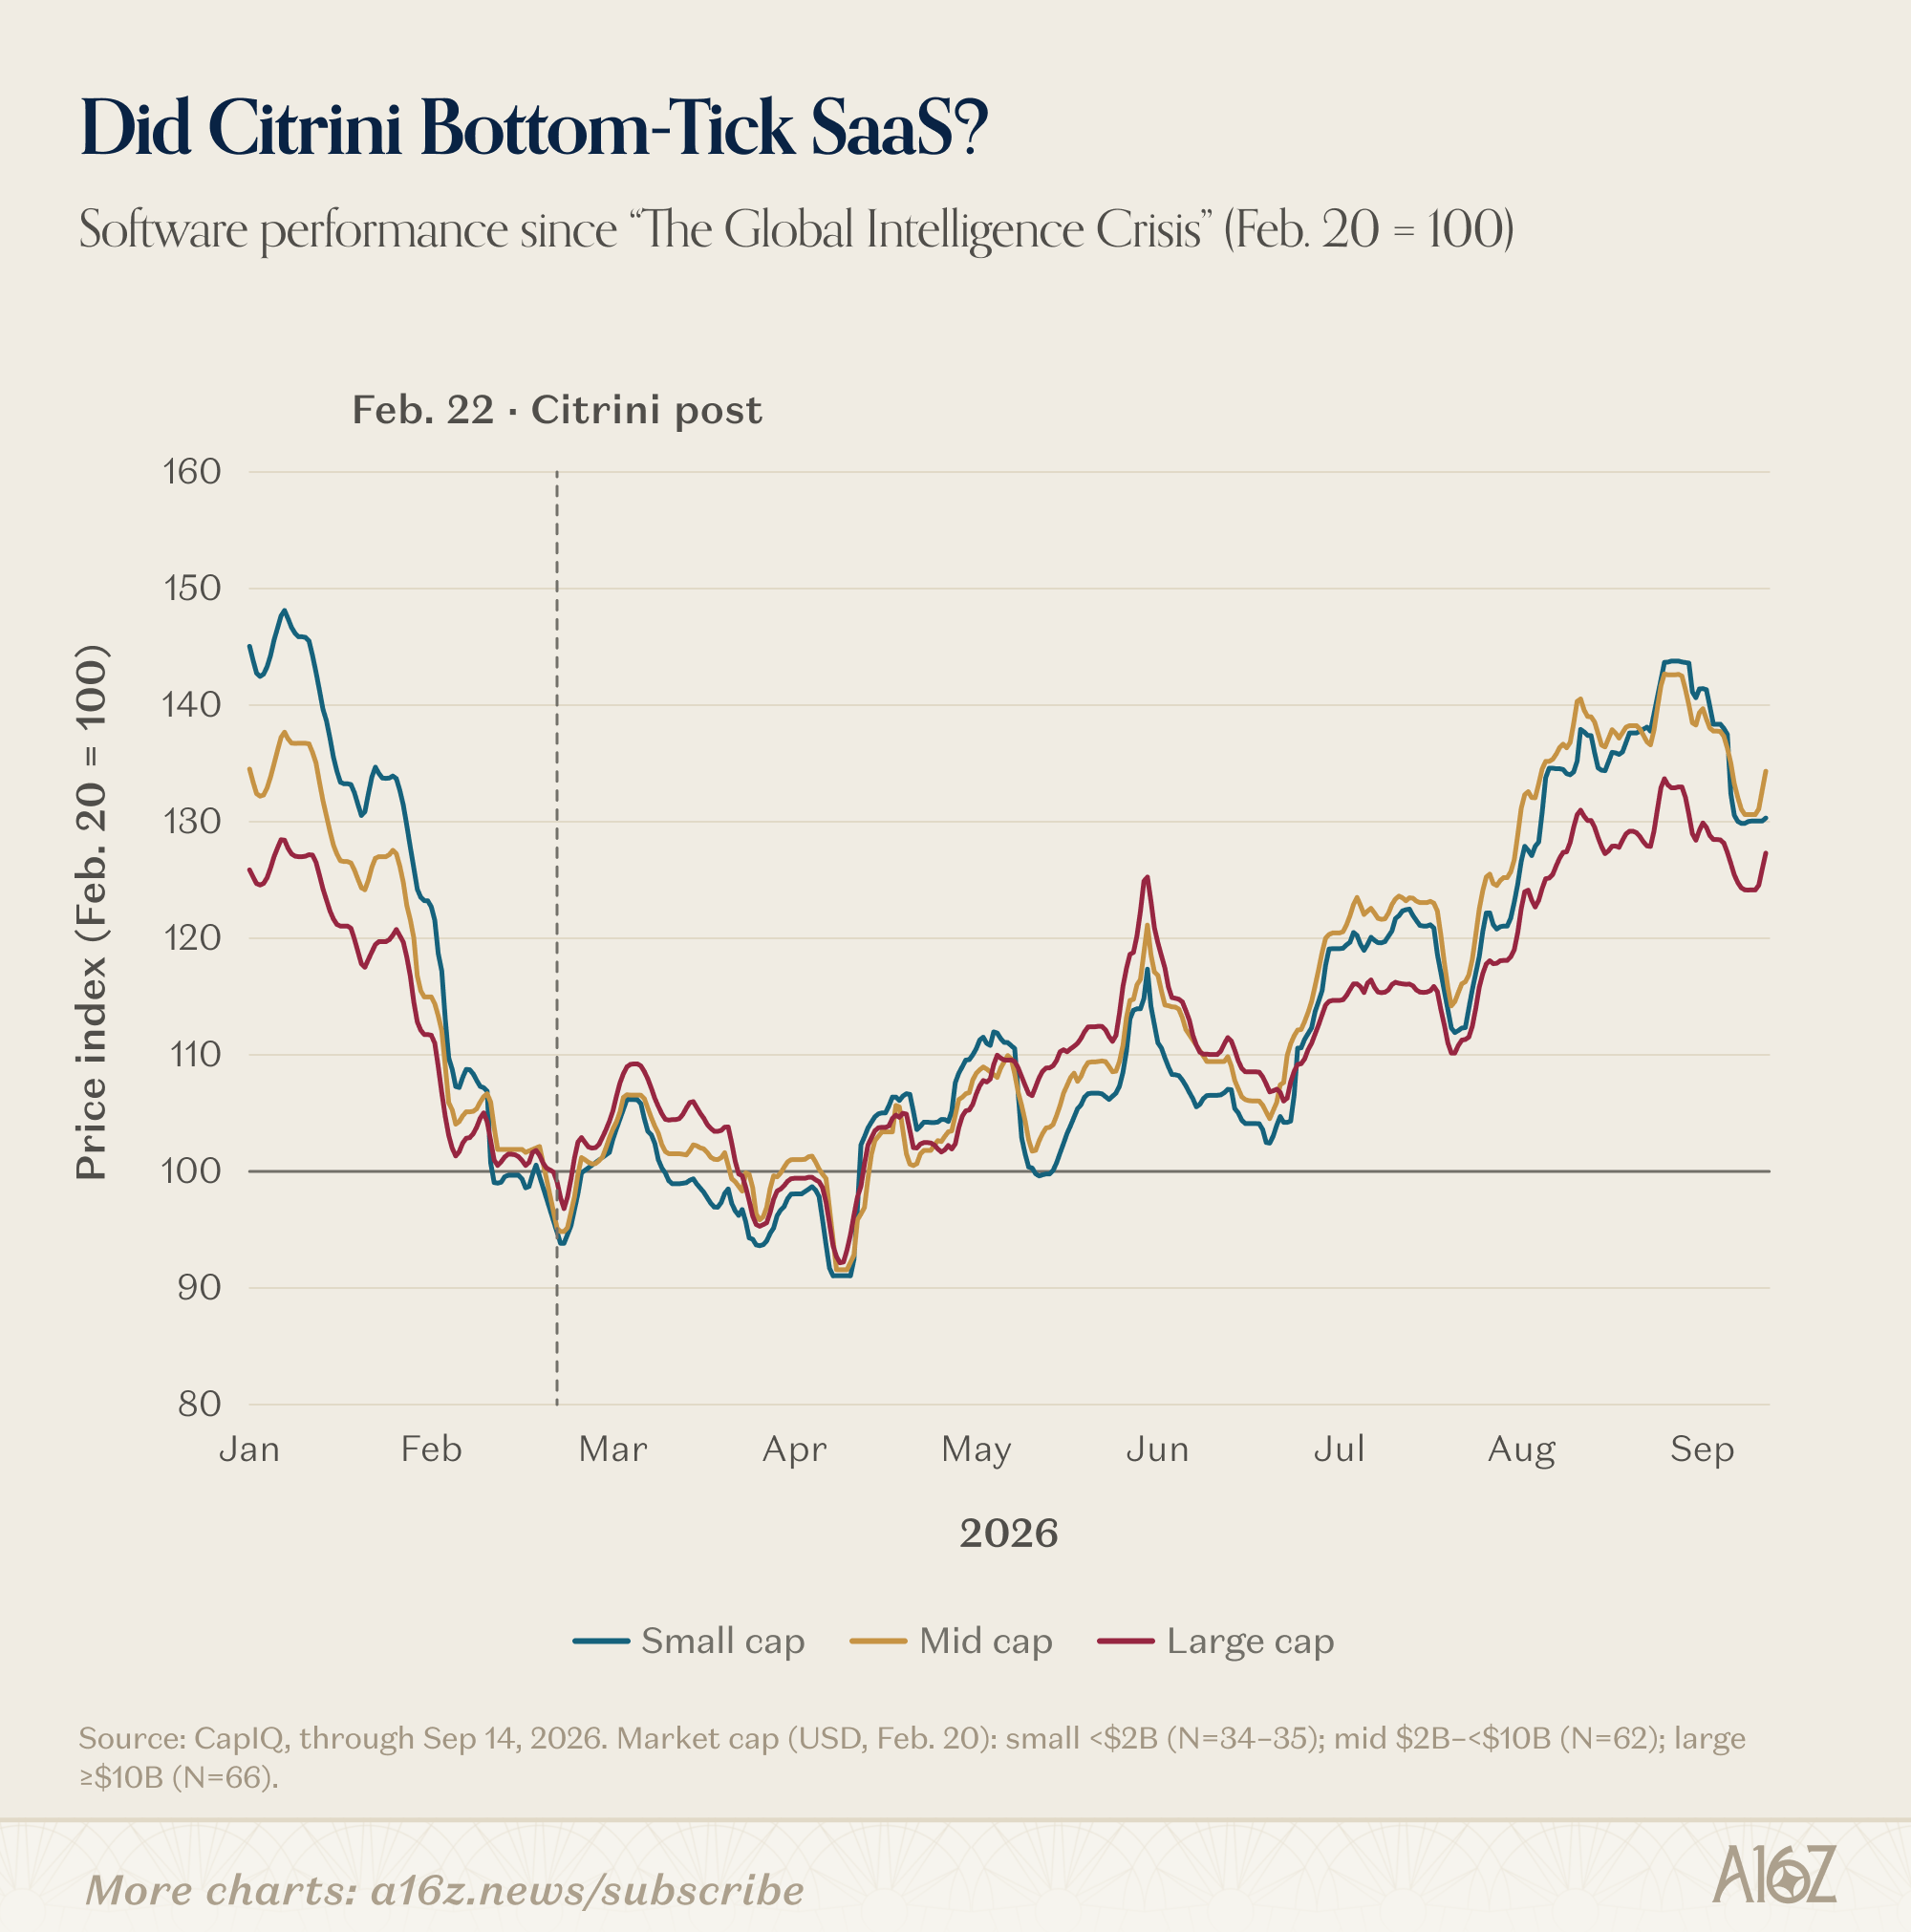
Software performance for all companies big and small has climbed unsteadily upwards since April . . . so Citrini didn’t quite tick the bottom, but came awfully close (at least for now).
Charts has gone over software’s selective selloff a few times, so no need to rehash it all here, but suffice it to say that fundamental performance for SaaS has more or less held up. That doesn’t mean it will continue to hold up, of course, but a rough summary of the headlines shows that software companies have generally beat or met expectations for the first half of the year:
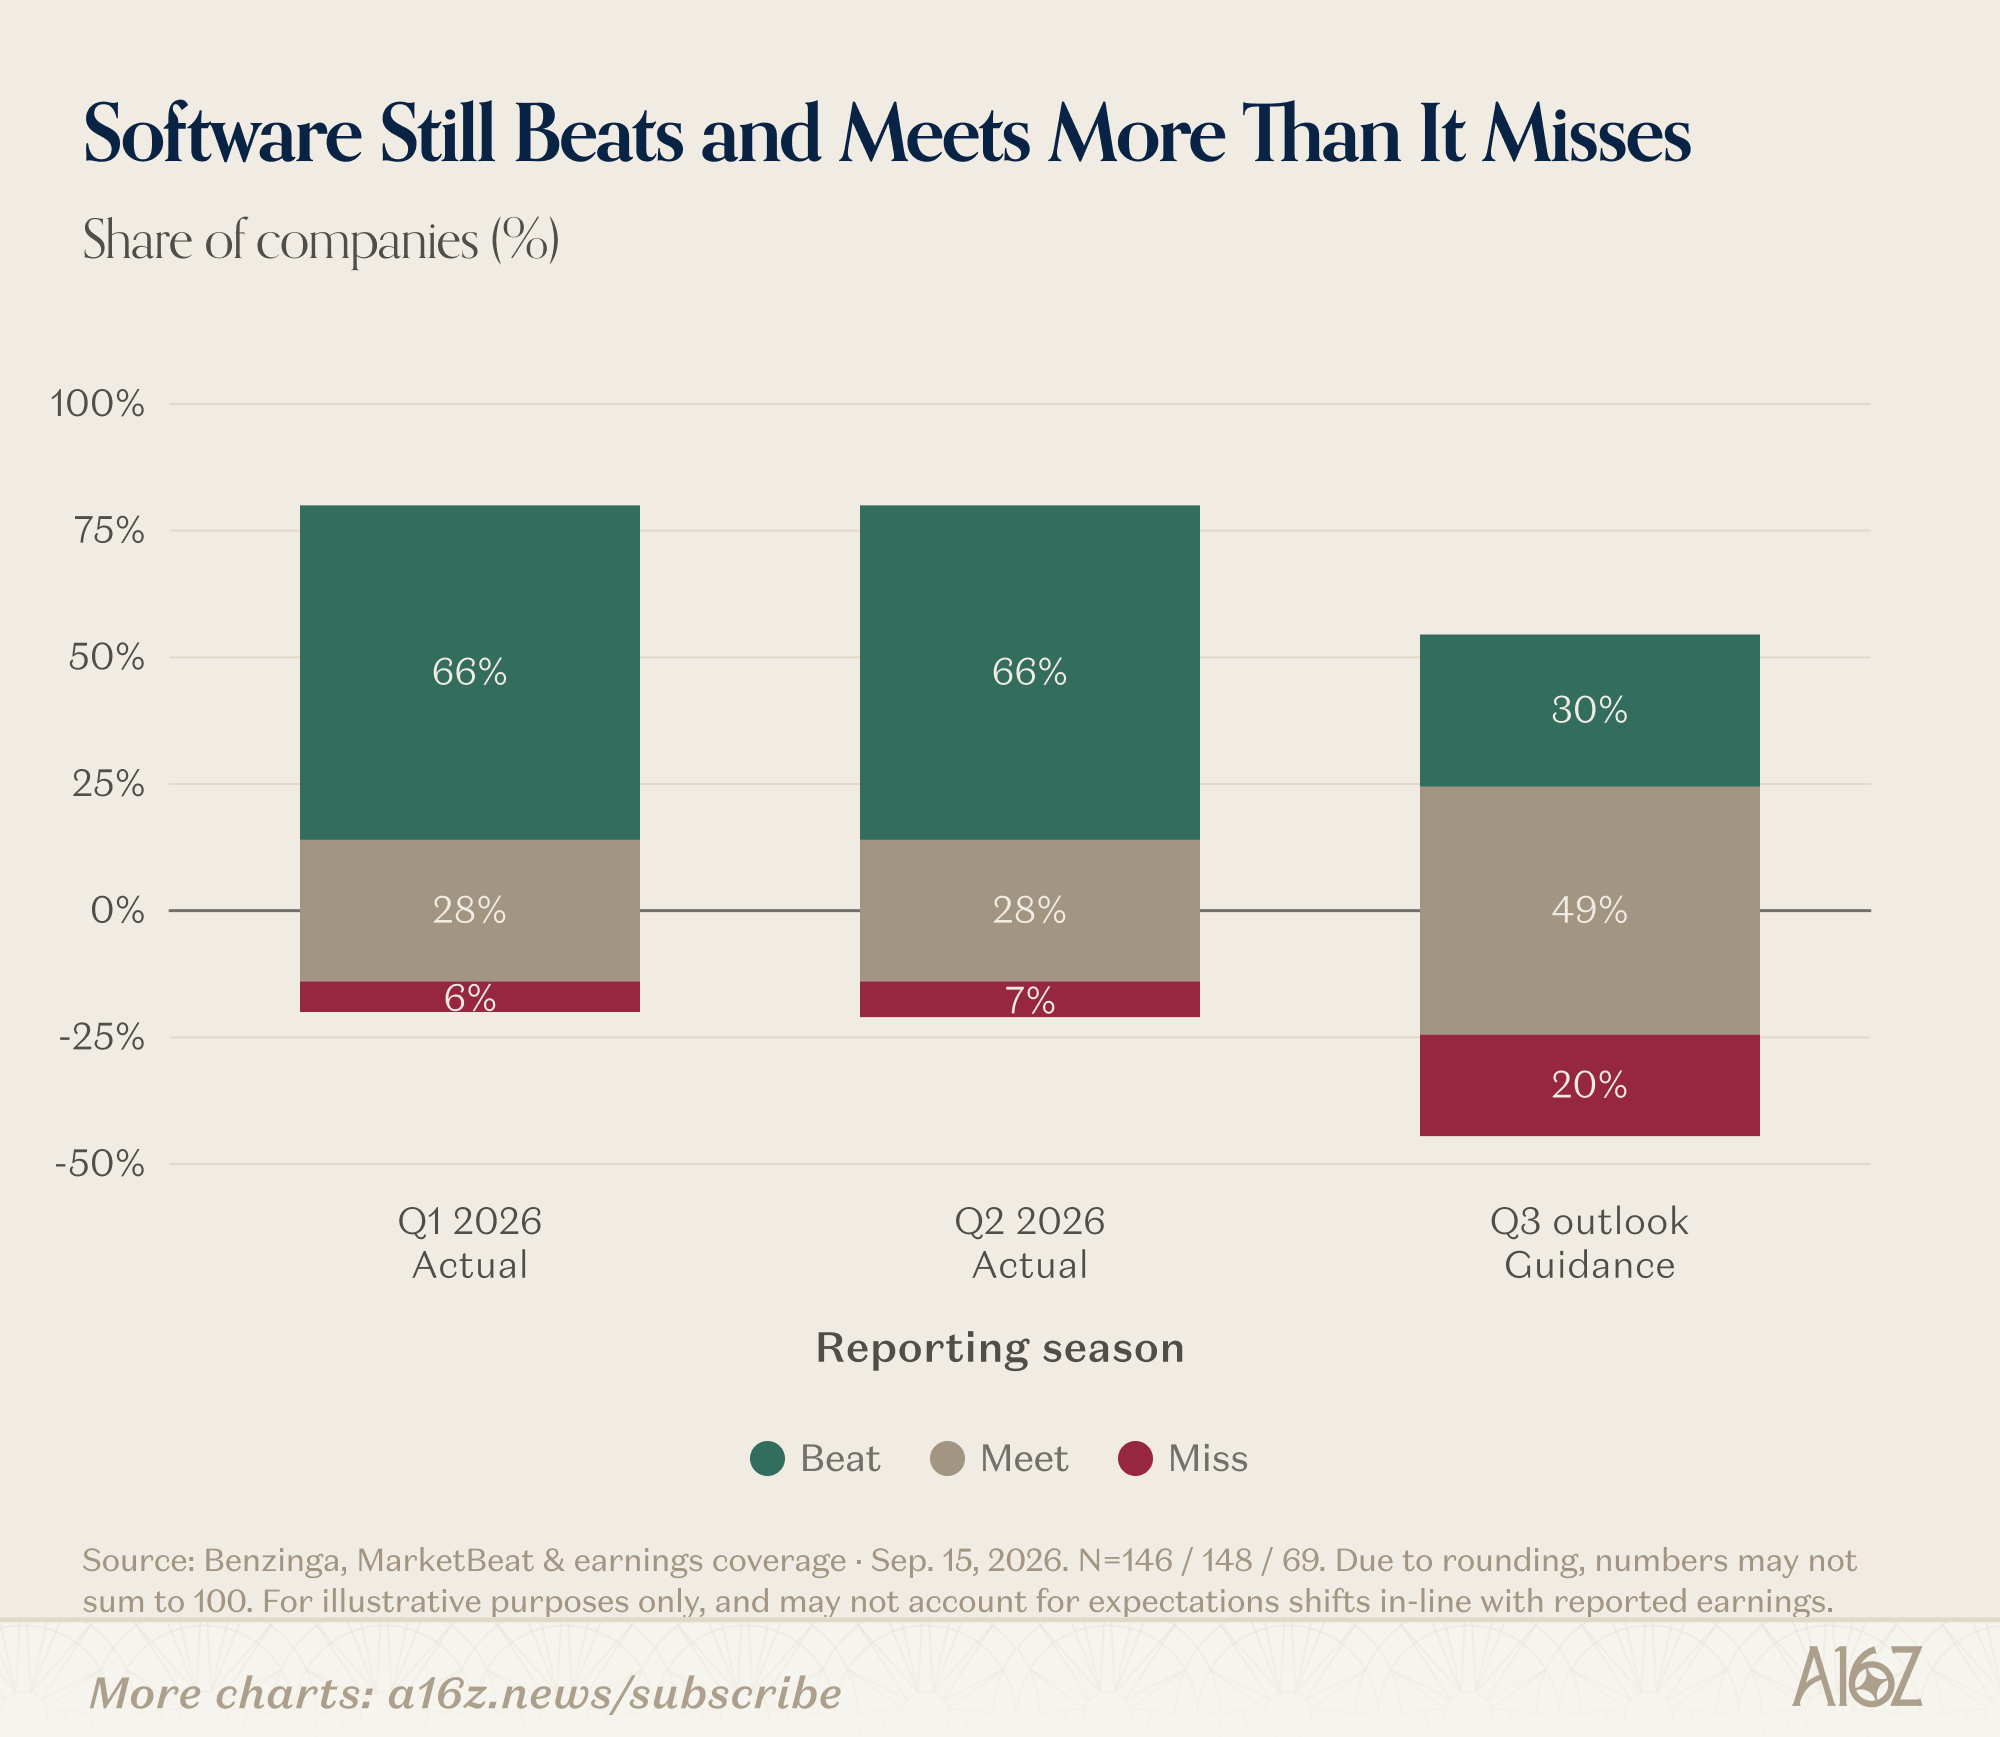
Notably, the share of software companies with disappointing guidance increased in the most recent quarter, but meet or beat was still the predominant story.
Take this data with a grain of salt because it’s not comprehensive, and it says nothing about actual performance—it’s of course easy to exceed low expectations, and similarly easy to disappoint high expectations, but in both cases, actual performance can be variously strong or weak. In all events, whatever SaaSpocalypse may be in the offing, it hasn’t arrived yet.
MA and CA Make it Very Expensive to Start a Business
Apropos of nothing (except a passing interest in jurisdictional competition for startups), it turns out that there is a very not-normal distribution of startup costs, by state:
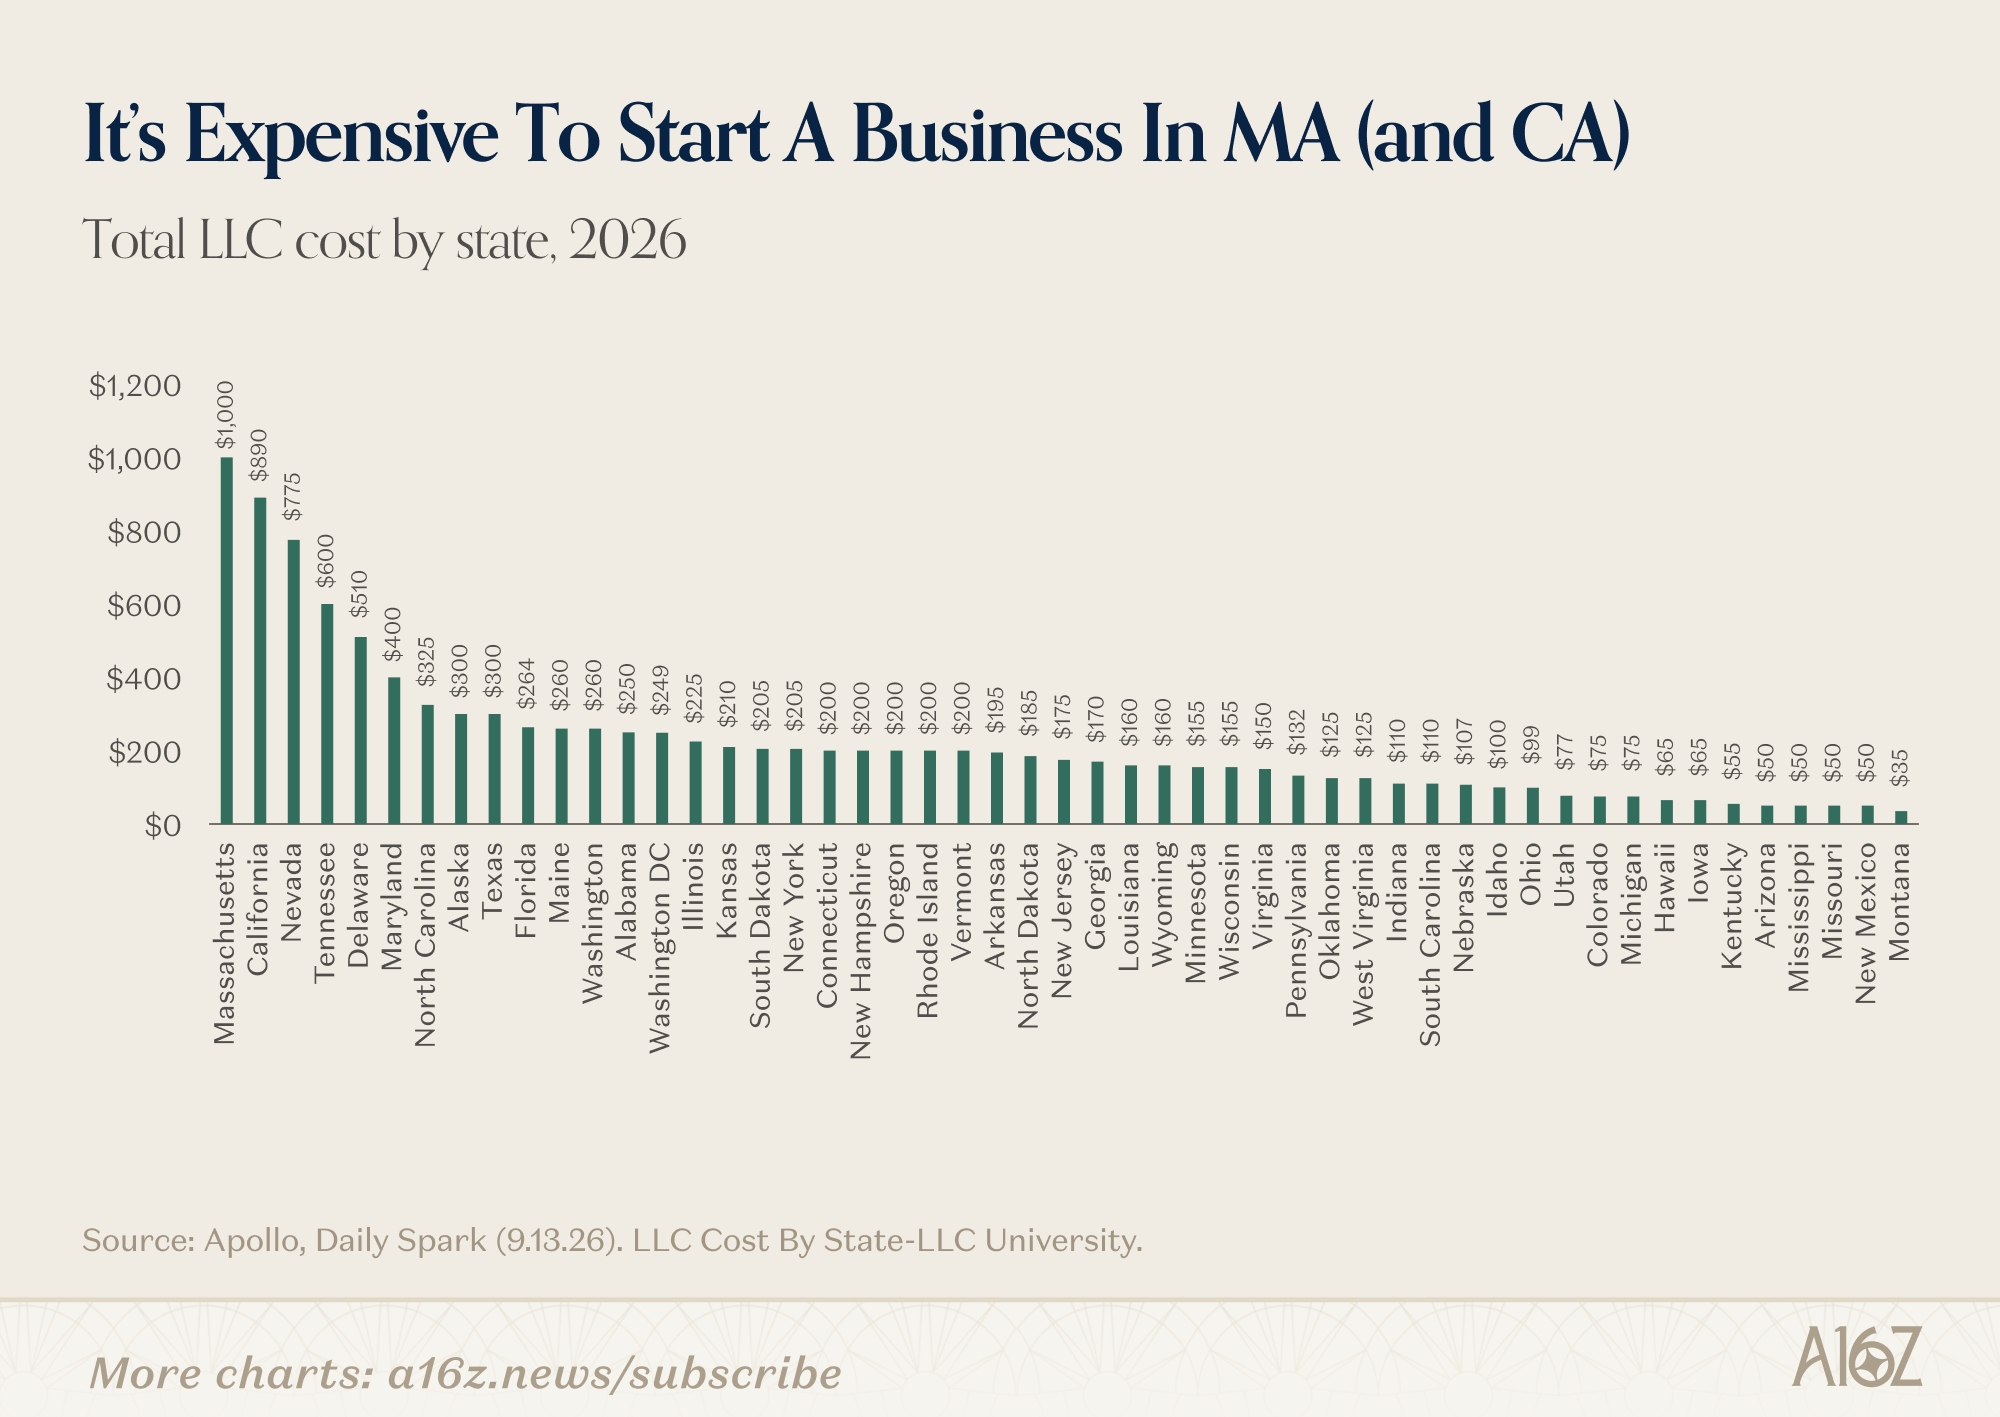
LLC costs in Massachusetts run ~$1,000, or ~5x the nationwide median.
To be fair, $1,000 is a rounding error in the big scheme of business costs, but these things do add up, and may be symptomatic of a broader policy posture. MA was ranked 49th in the nation for the cost of doing business, and despite having some of the best research institutions in the world (and some of the best talent), Massachusetts has been hemorrhaging businesses over the last few years:
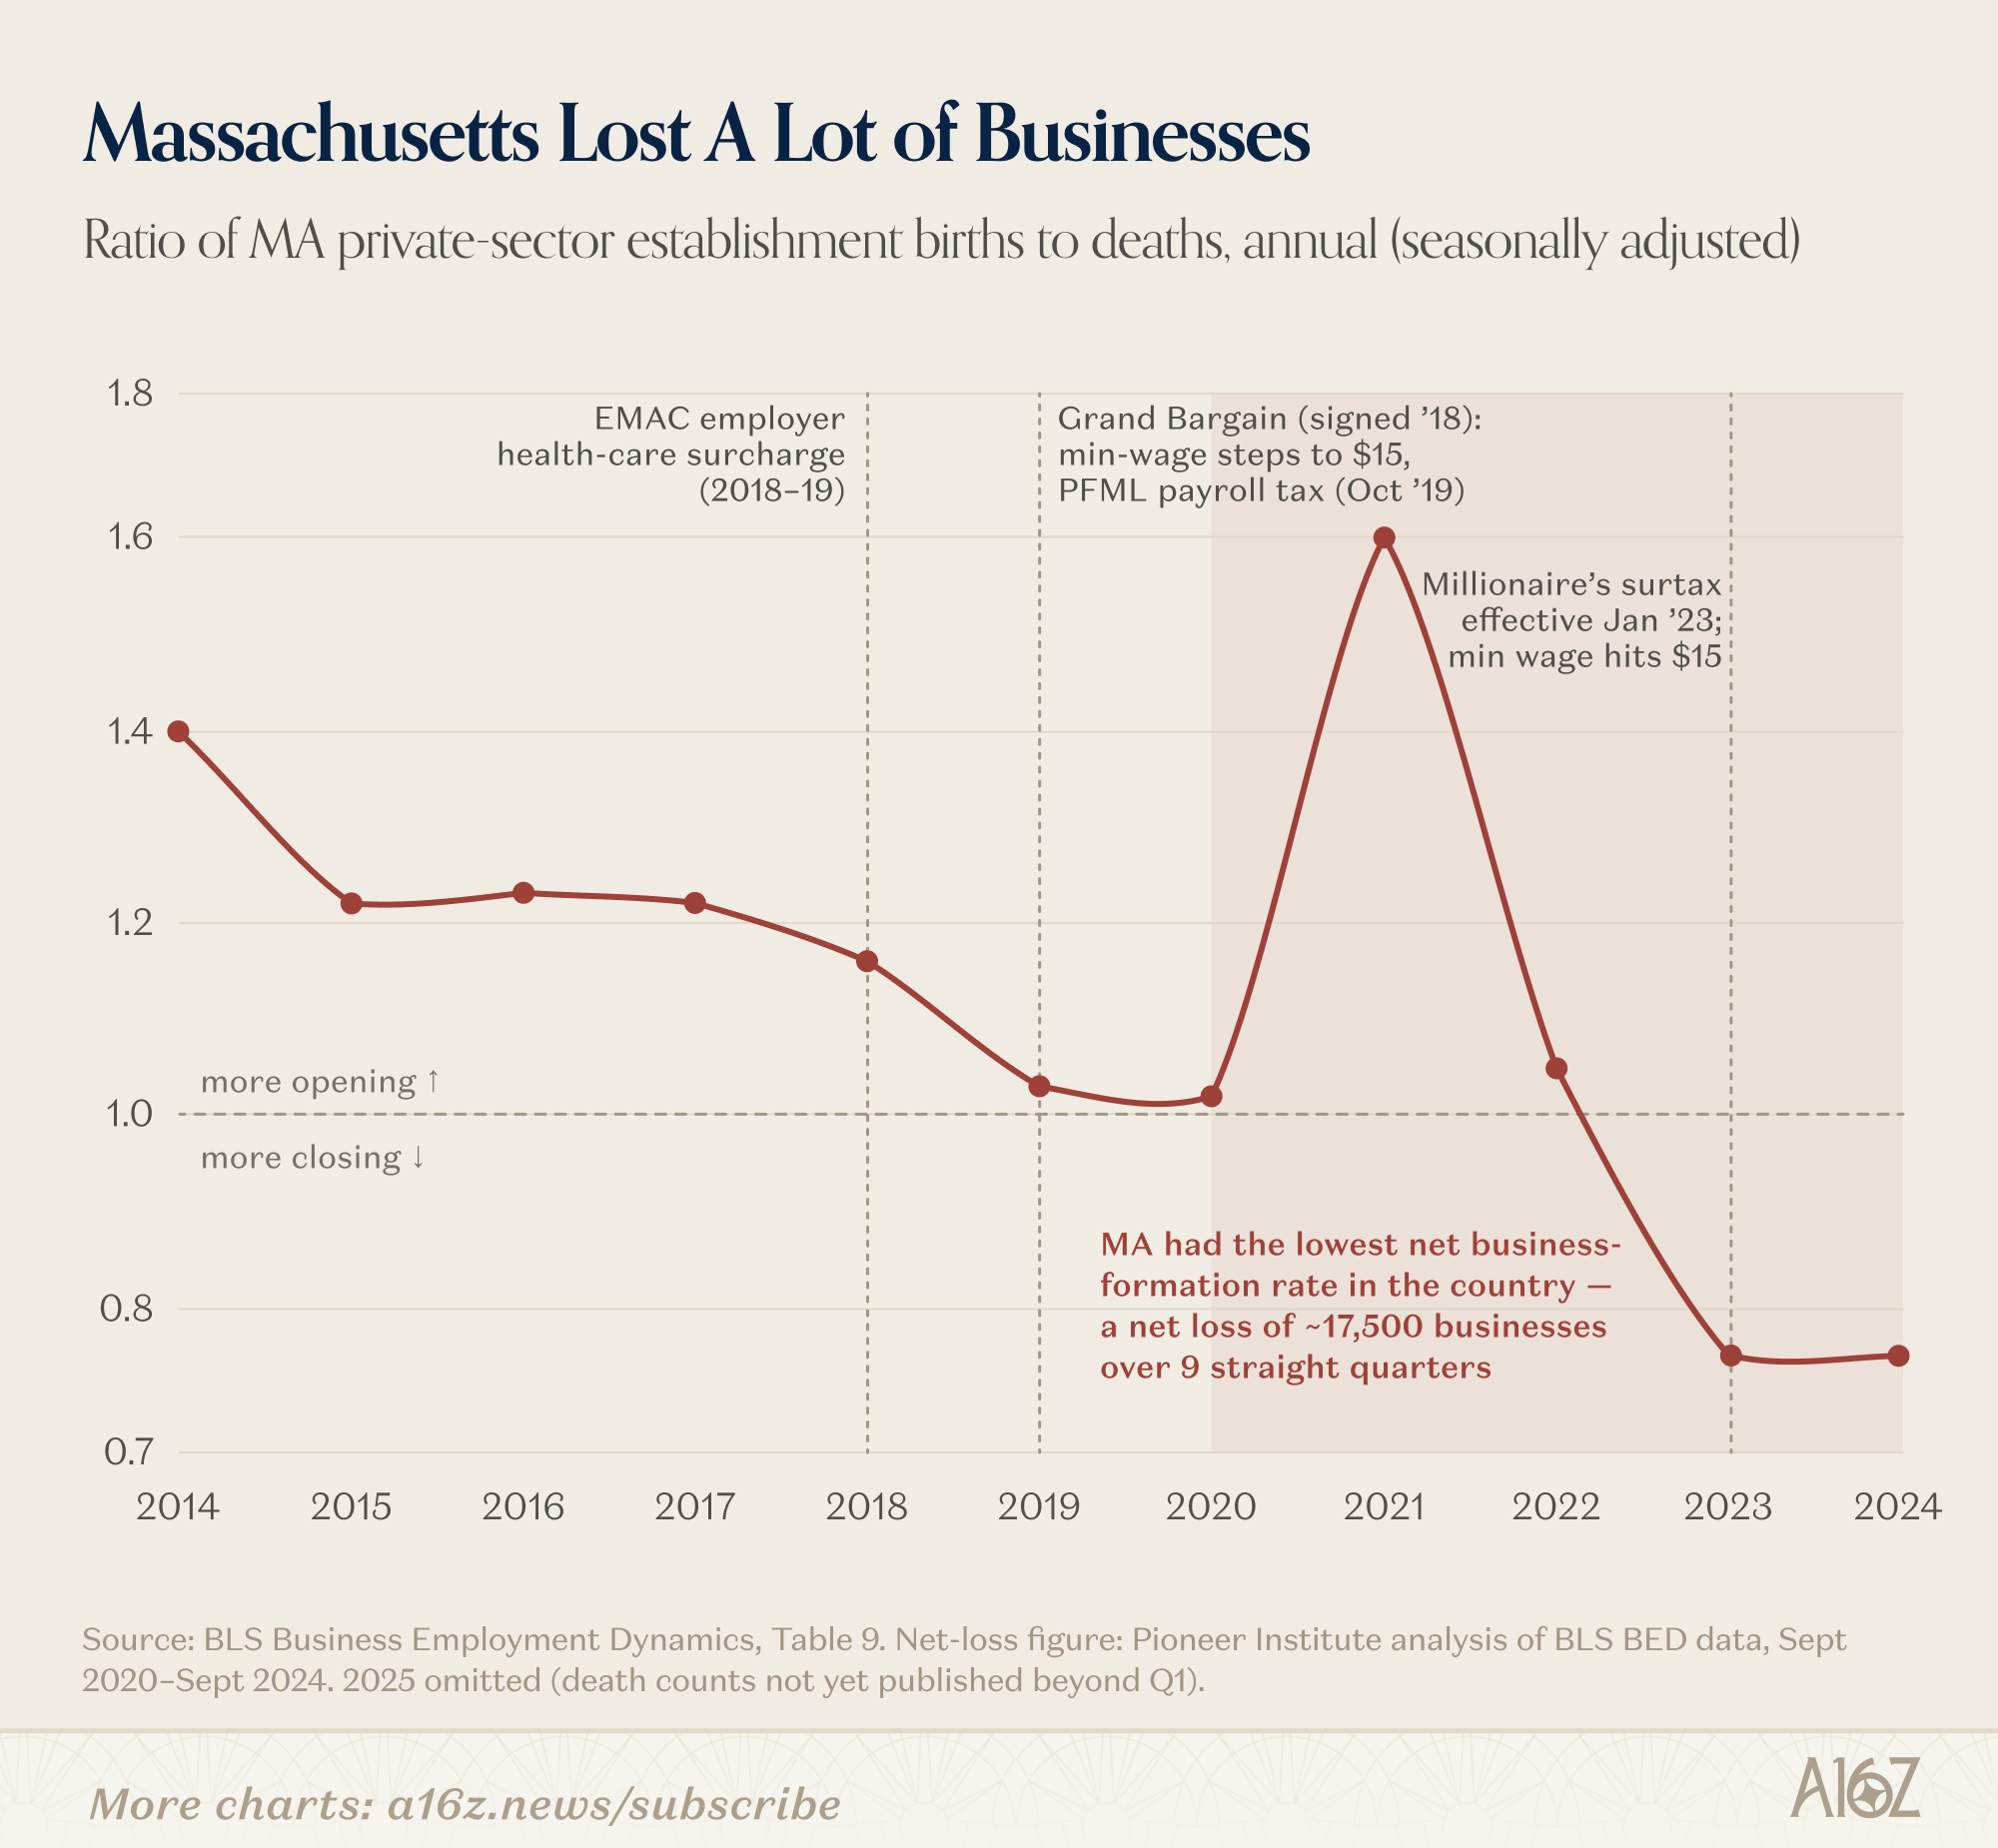
Net business formation has been trending downwards since 2017, and has been sharply negative since the pandemic reopening, leading to the worst ratio in the country.
Approximately 17,500 MA businesses were lost (on net) over a 9-quarter period. To be fair, the data lags (because a business has to report four quarters of zero employees to be considered a “death”), so it’s possible things have improved . . . but for now, it seems that Massachusetts is a pretty unfriendly place to open up shop.



This newsletter is provided for informational purposes only, and should not be relied upon as legal, business, investment, or tax advice. Furthermore, this content is not investment advice, nor is it intended for use by any investors or prospective investors in any a16z funds. This newsletter may link to other websites or contain other information obtained from third-party sources - a16z has not independently verified nor makes any representations about the current or enduring accuracy of such information. If this content includes third-party advertisements, a16z has not reviewed such advertisements and does not endorse any advertising content or related companies contained therein. Any investments or portfolio companies mentioned, referred to, or described are not representative of all investments in vehicles managed by a16z; visit https://a16z.com/investment-list/ for a full list of investments. Other important information can be found at a16z.com/disclosures. You’re receiving this newsletter since you opted in earlier; if you would like to opt out of future newsletters you may unsubscribe immediately.