

Charts of the Week: SaaSpocalypse Interrupted
Consumer AI: Room to Run; Ads Come for Everything; Trucks Are Busy; Earnings Go Up, Prices Go Down


America | Tech | Opinion | Culture | Charts

SaaSpocalypse Interrupted
The actual story of the SaaSpocalypse continues to be more nuanced than the narrative.
It’s definitely true that software companies generally are experiencing some headwinds, but whether that’s strictly speaking “AI-driven” and/or something else, is a bit of an open question.
Plus, there’s plenty of reason to think that AI could be an accelerant to incumbent software businesses–indeed, before the big saas selloff, that was the narrative: incumbents incorporating AI stood to gain massively.
The most likely outcome for “AI v. SaaS” is, of course, “it depends.” Some companies are intrinsically more vulnerable, for sure, but a lot will simply depend on execution. Can companies effectively incorporate AI into their stacks, products, and pricing models (or not)?
For now, some data suggests that some software companies are doing just-fine (while others, less so). Based on a panel of “stable software spenders,” the picture is mixed: there are big-winners amongst incumbent saascos, especially amongst the biggest buyers of software, but AI companies are definitely making gains:
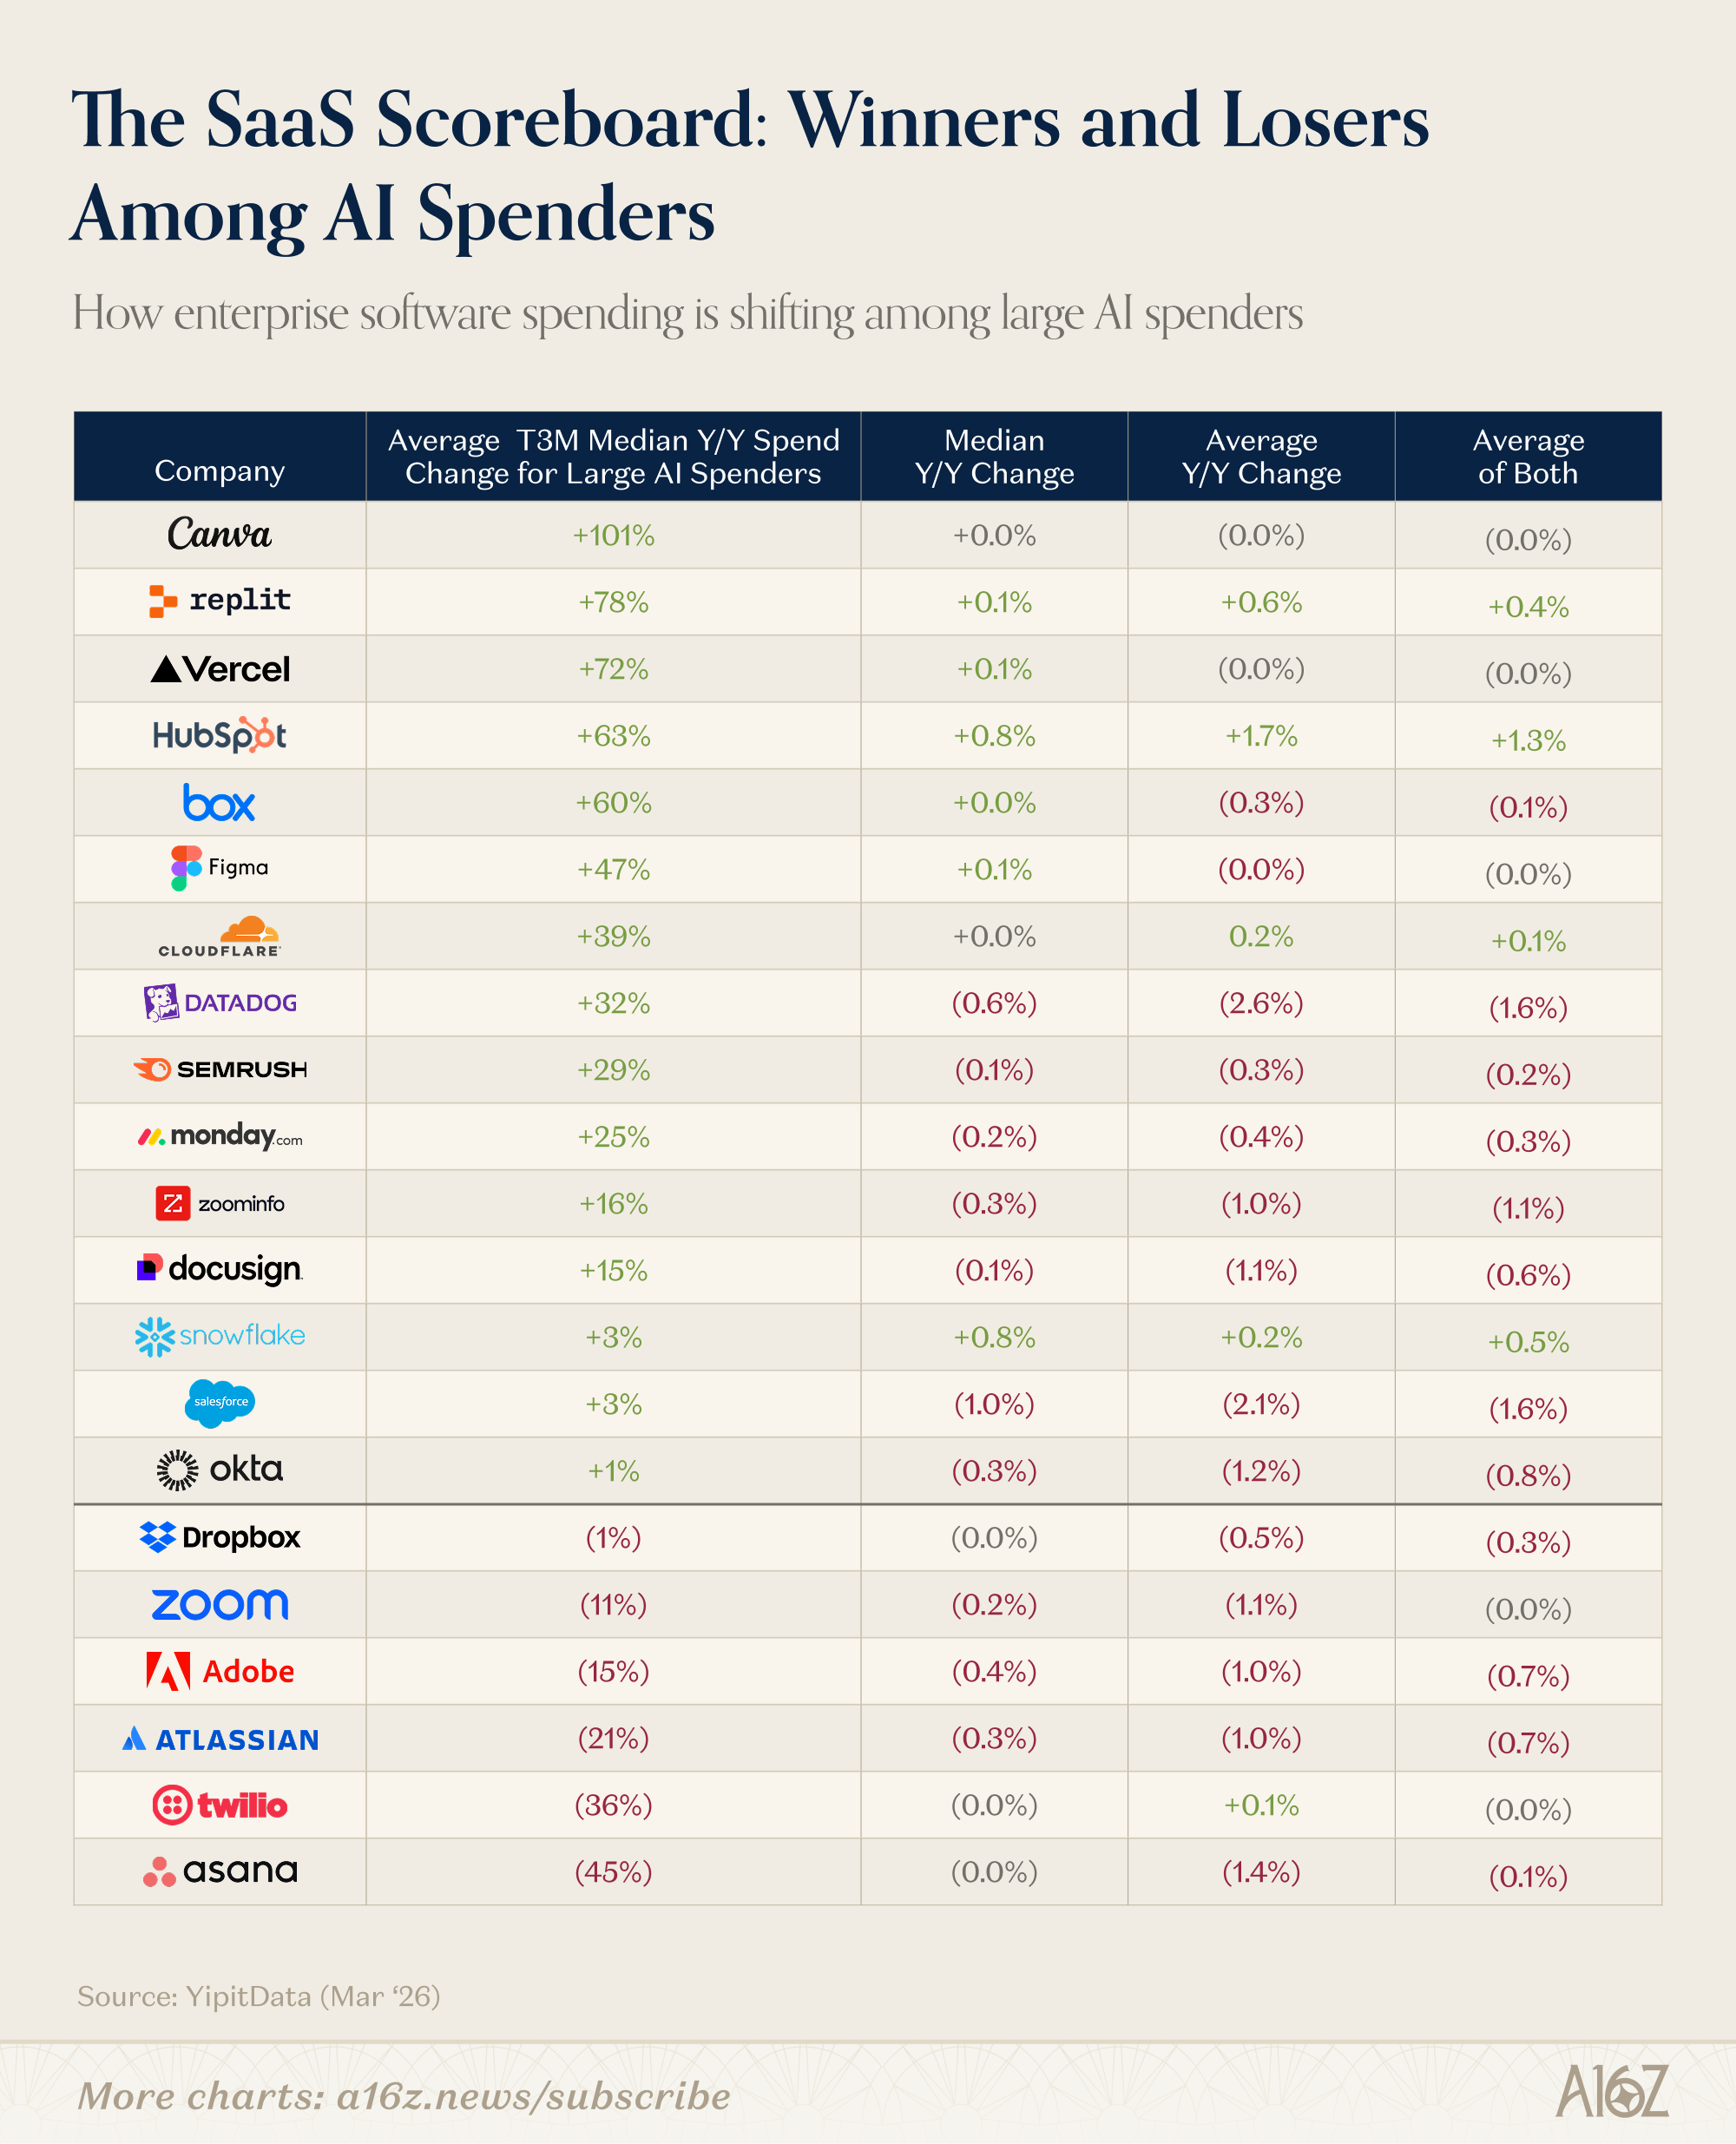
Hubspot stands out for seeing large recent increases amongst the biggest spenders, and the largest yoy median increase for the panel as a whole.
Figma, Box, Cloudflare, Datadog, Semrush, and Monday, also grew 25%+ amongst the biggest spenders (but only Figma experienced any gains at the median)
That’s good news for Hubspot and Figma, two companies that many believe are directly in AI crosshairs. For its part, Hubspot has been telling investors for a while now that it was investing heavily in AI, so perhaps this is part of the payoff.
In general, though, the same data shows some tough(er) sledding ahead for non-AI software.


Amongst those companies increasing their tech spending 10%+, AI continues to see an increasing share of overall spend:
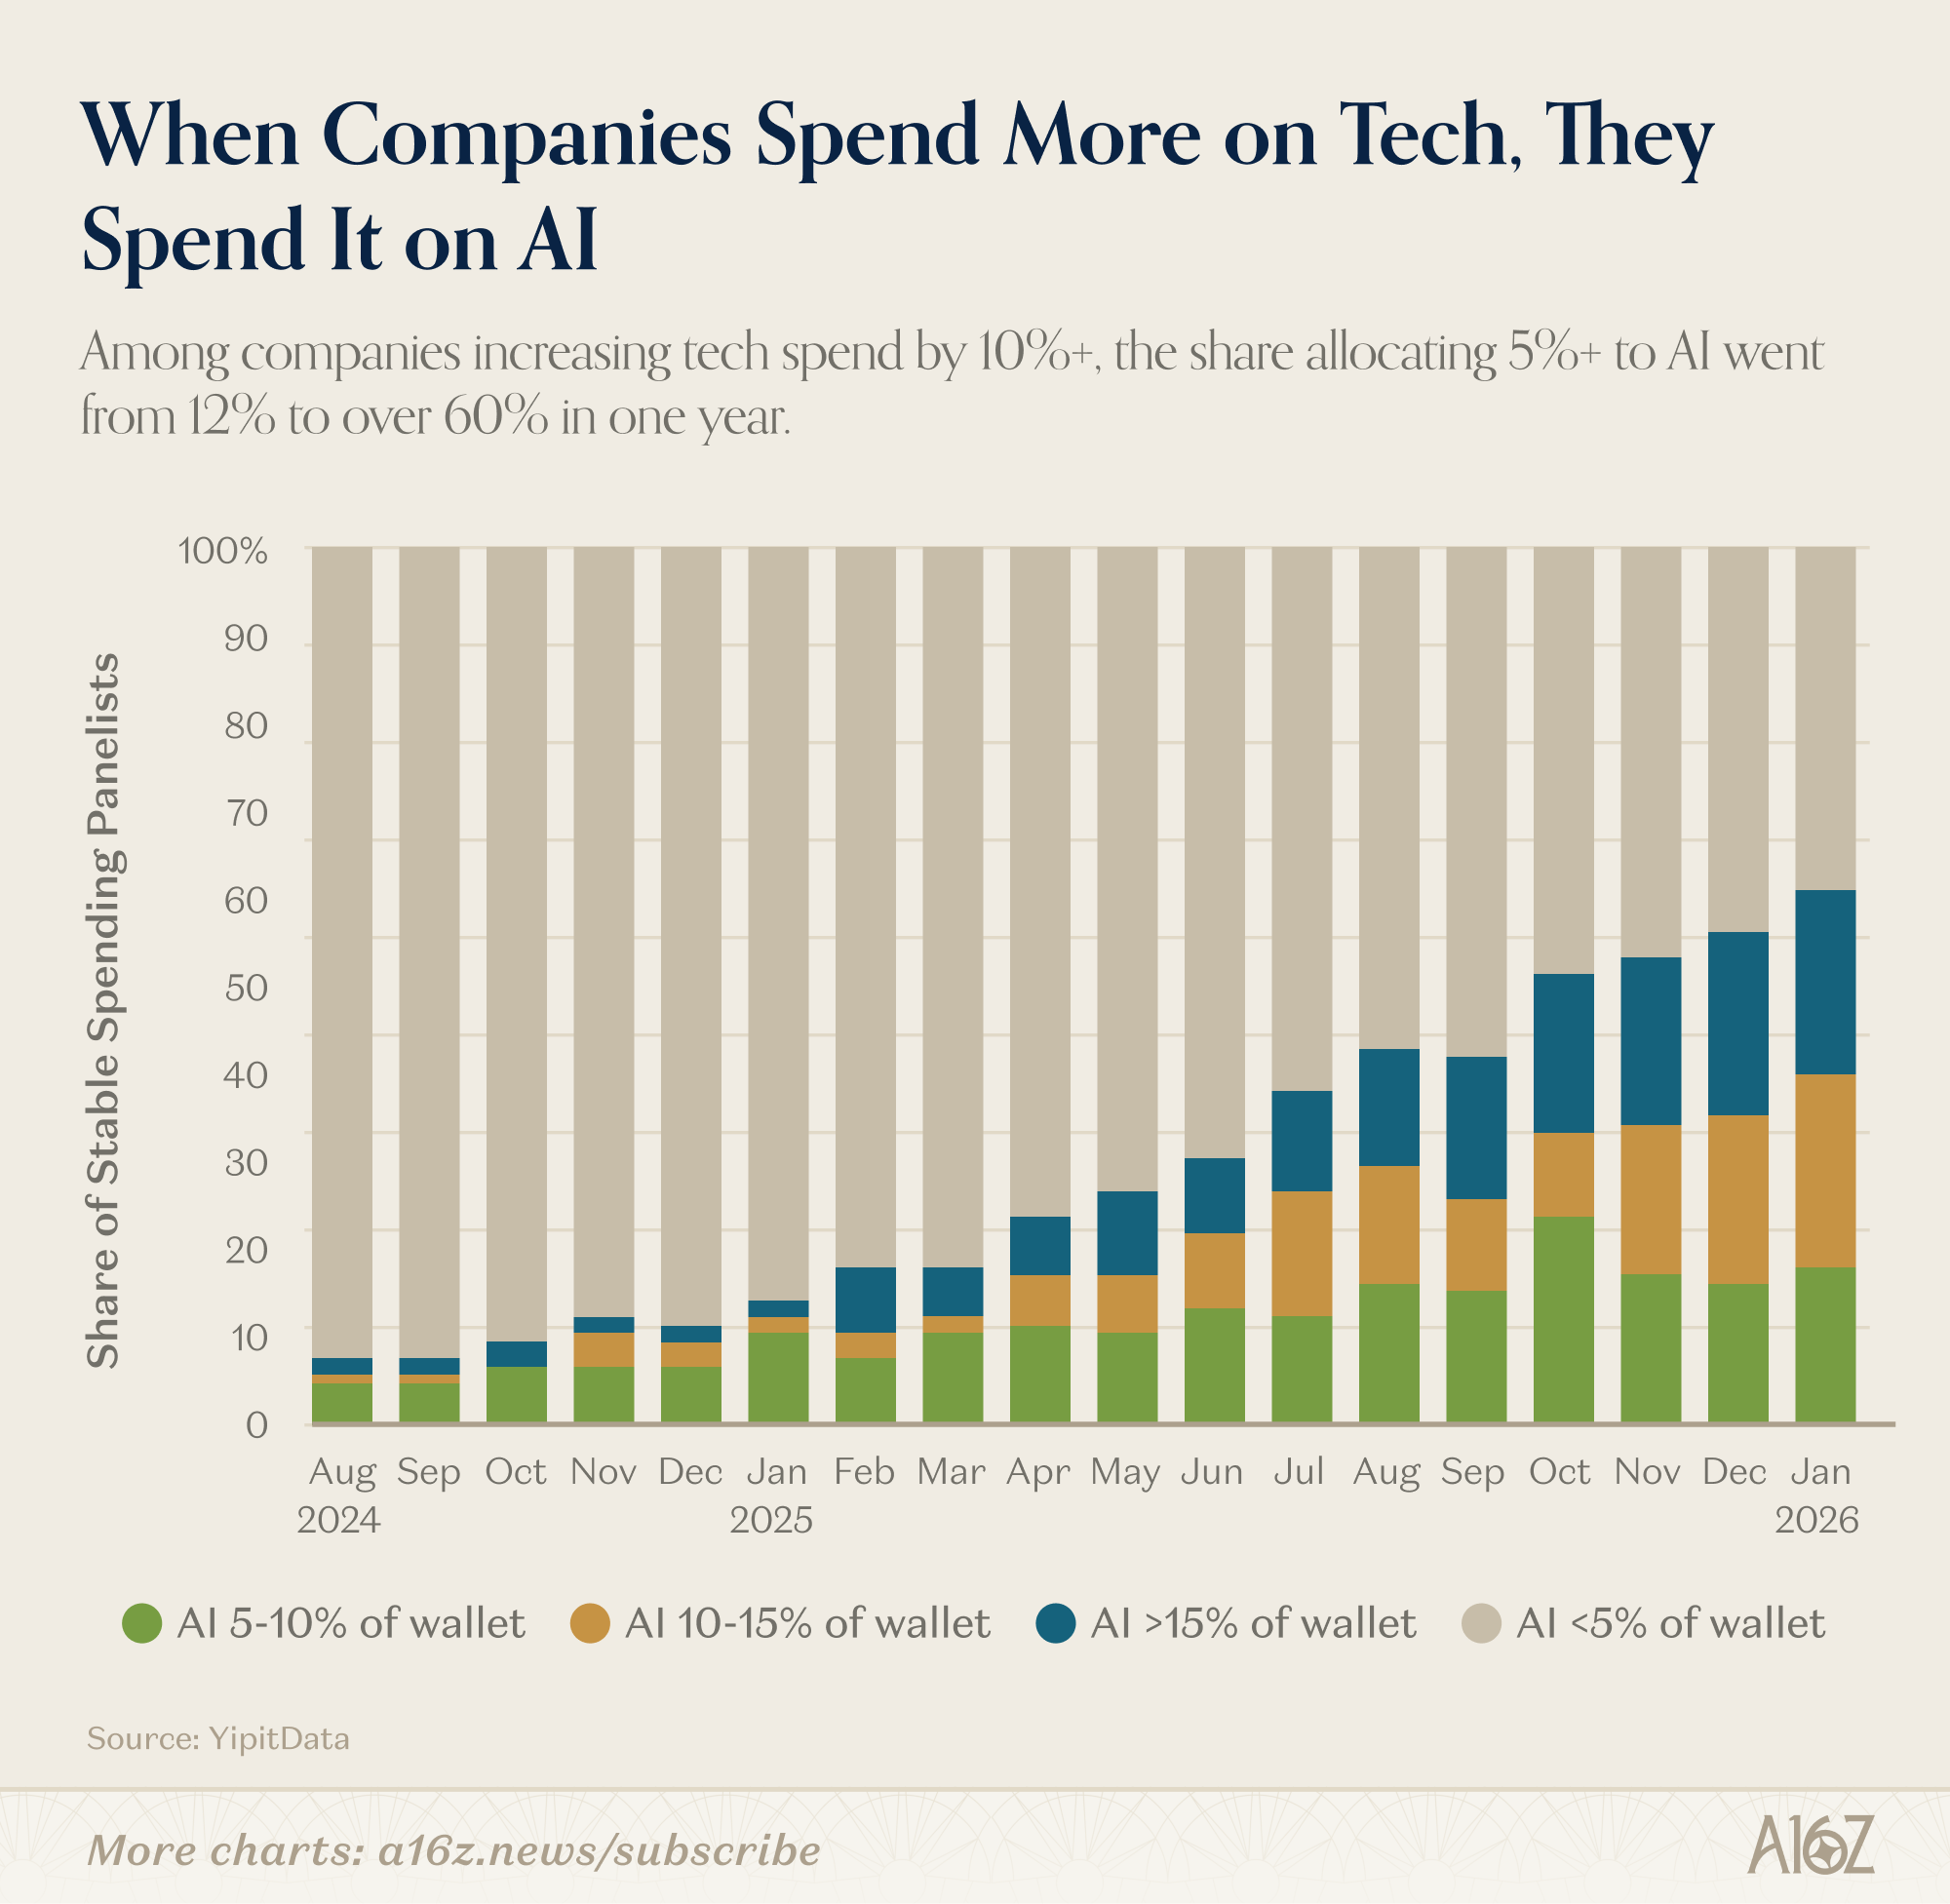
Over 60% of the panel now allocate 5%+ of their spending to AI, in contrast to the ~12% of the panel, from just one year ago.
What that means is that AI is capturing more and more of the incremental tech spending–i.e. when companies spend more on tech, they are spending it on AI.
Again though, that doesn’t mean that all categories of software companies are equally exposed. From a recent CIO survey, which asked “which area(s) of IT budget do you expect the greatest reduction in budget growth?” it’s clear that some categories are clearly more exposed than others:
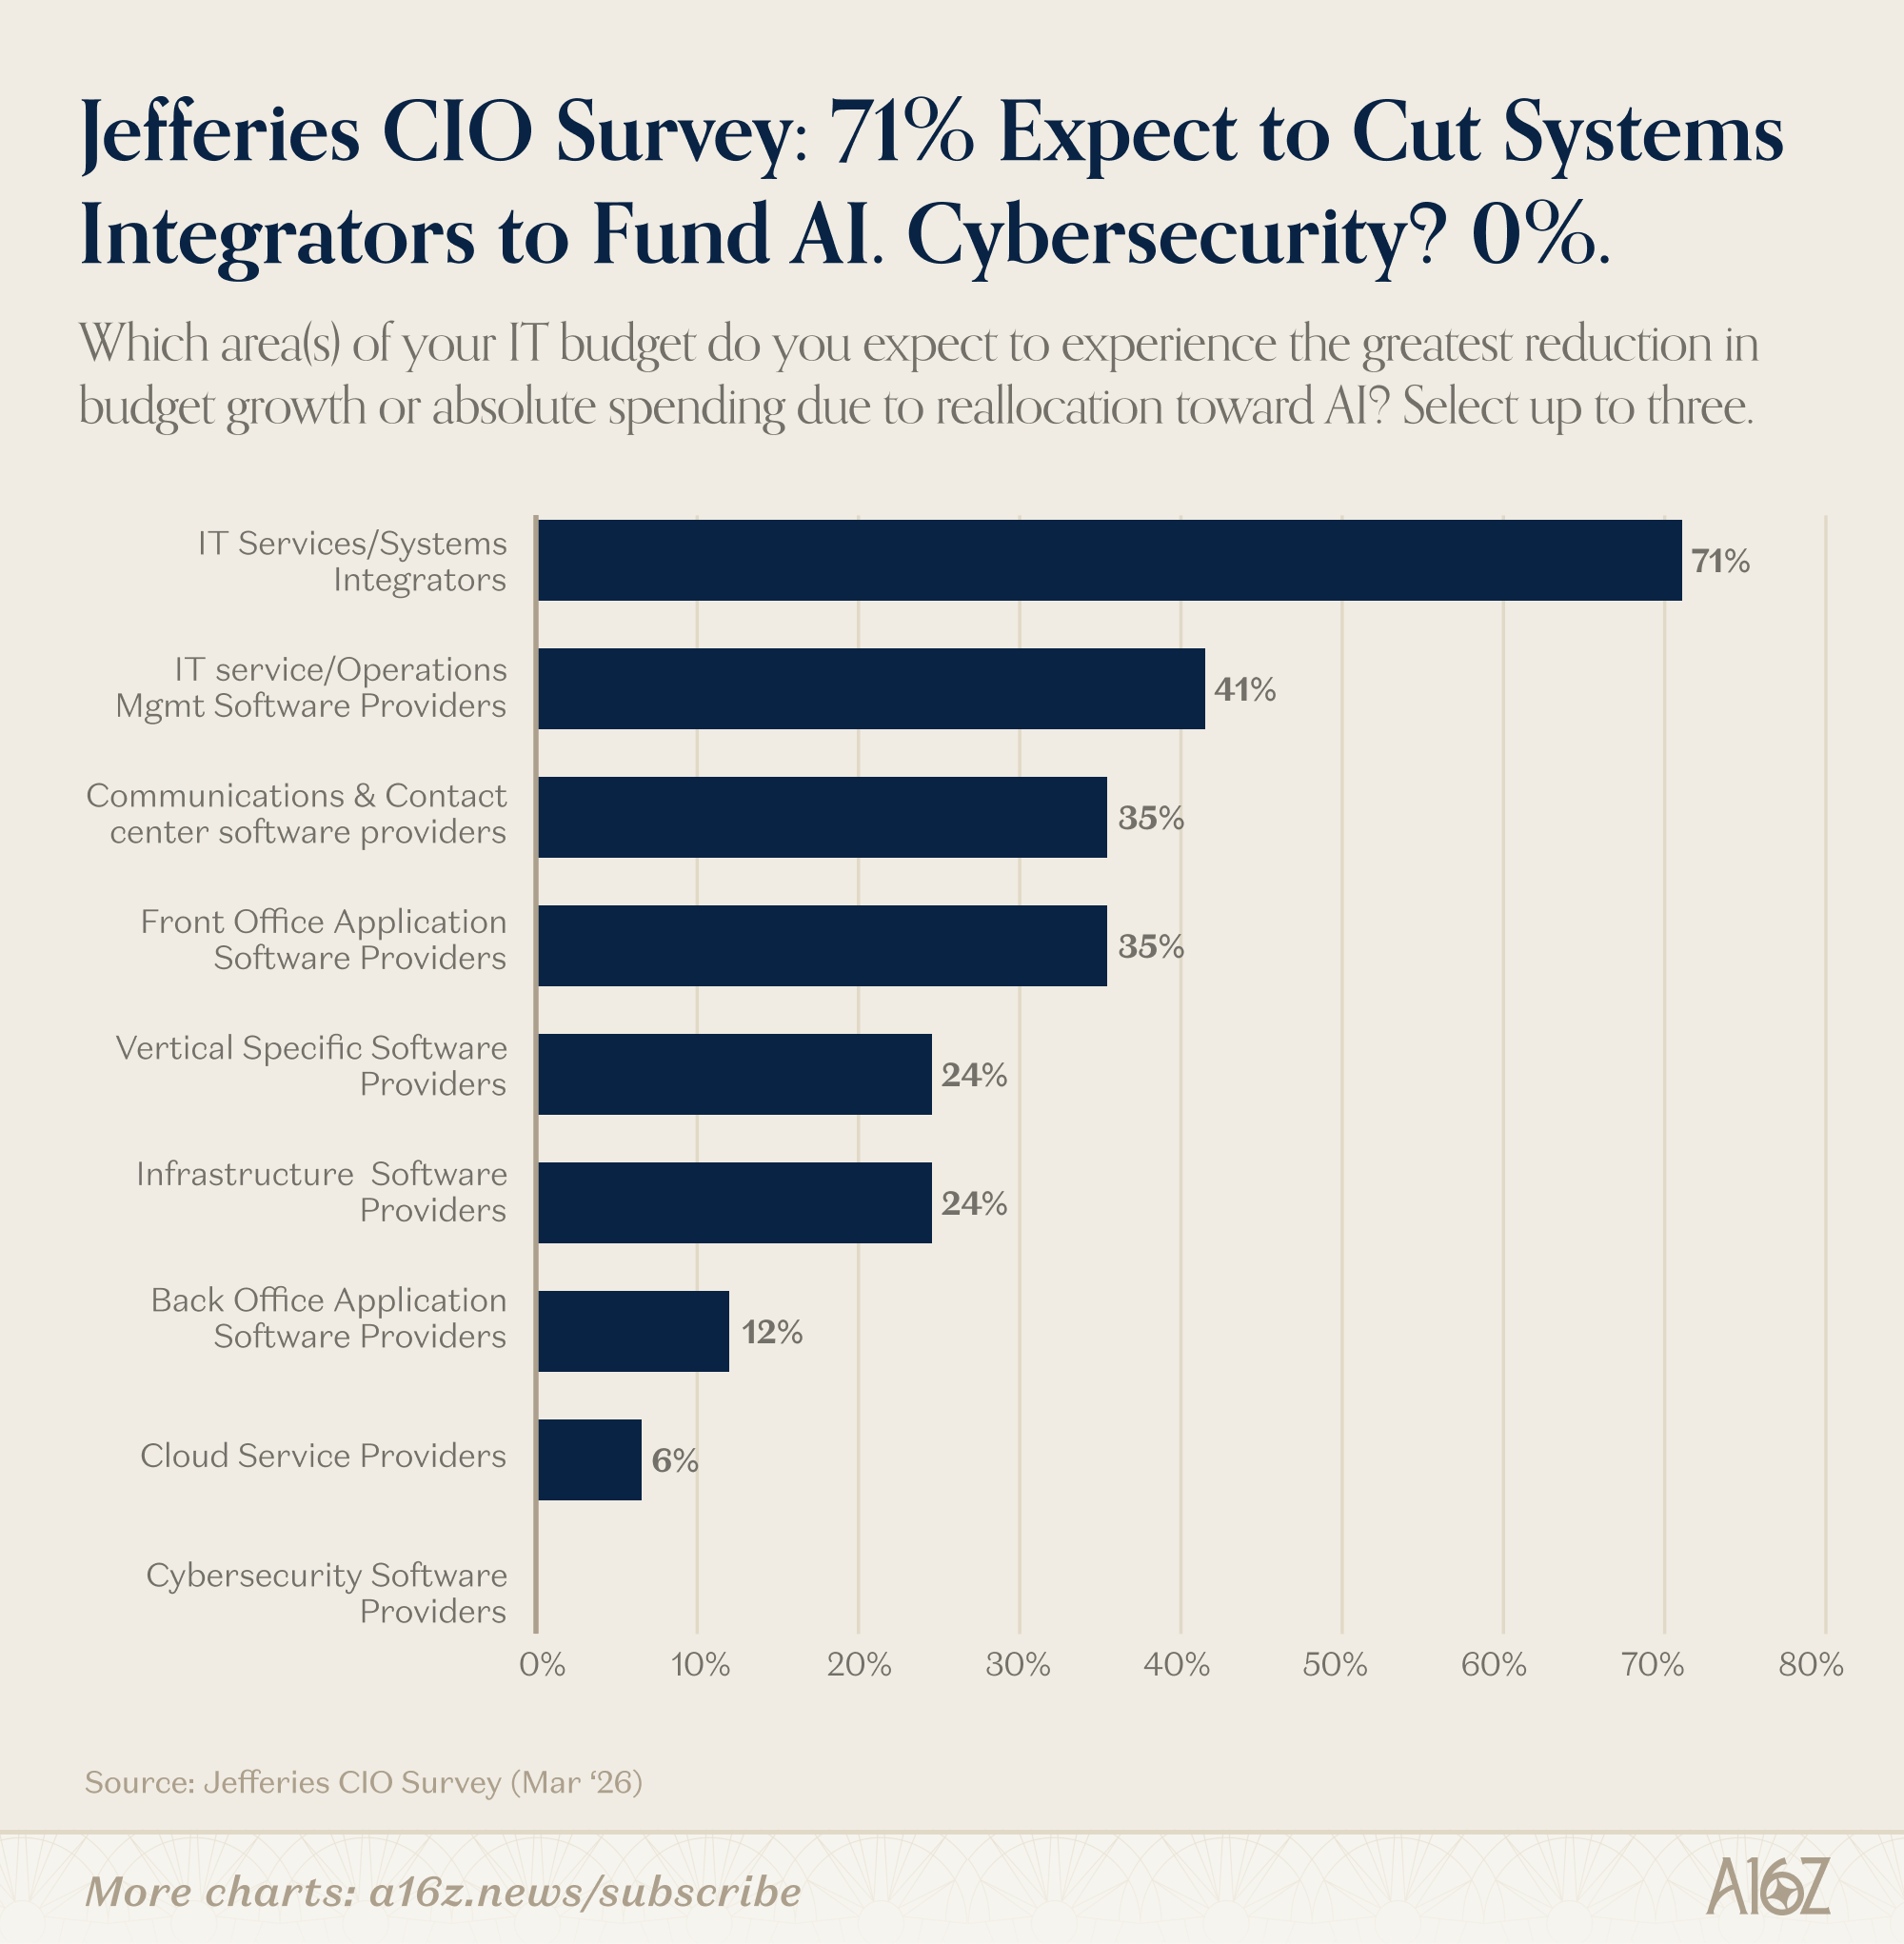
71% of CIO respondents identified as Systems Integrators as the area expected to bear the cost of AI spending reallocation.
In contrast, front-office (i.e. crms), vertical saas, and infra were somewhere in the middle, while back-office, cloud, and cyber(!) appear to be relatively safe.
Make of that what you will, but the point is that the battle for enterprise tech spending is very much on, but we’re still in the early-innings of how all of this will eventually shakeout.
Consumer AI: Room to Run
Over on the consumer side of AI things, there too, we’re still very much in the early innings.
While AI adoption is quite high, paying AI adoption (amongst consumers) is just getting going. According to BofA’s internal data, only 3% of households are paying subscribers to an AI service.
3% of households is a relatively tiny number, although it’s been growing fairly quickly, over the past year:
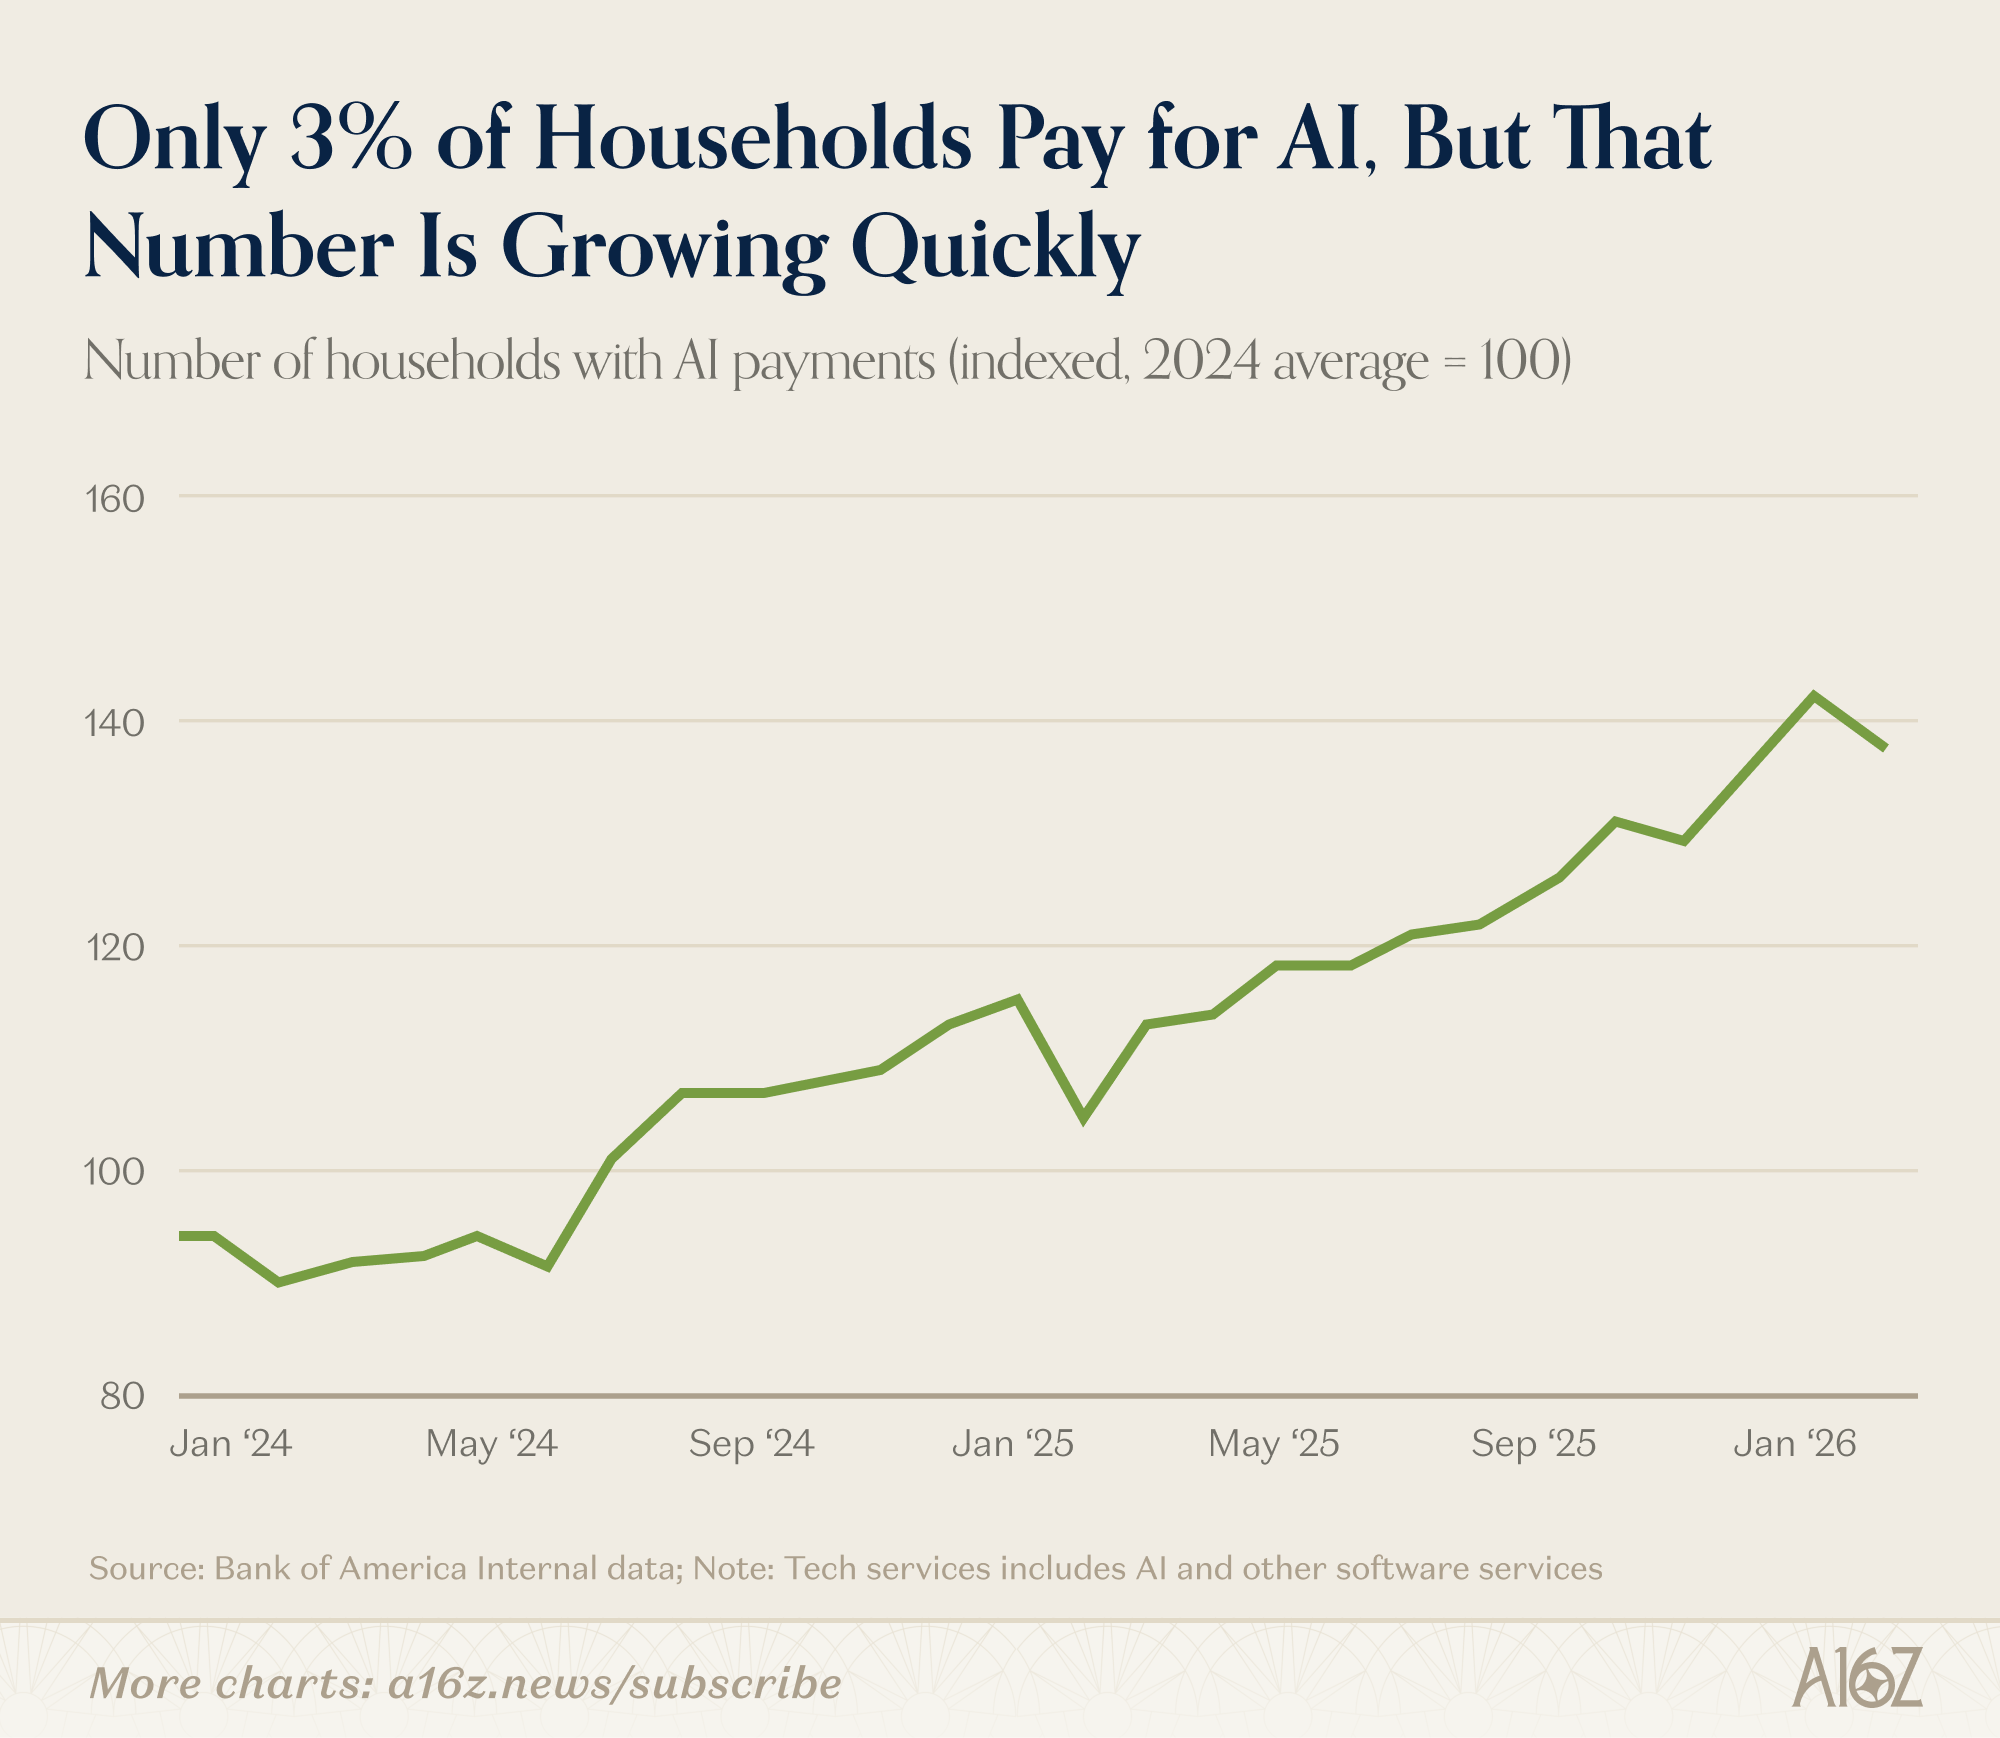
The number of households “making AI payments” is up nearly 40%, relative to February 2024.
That growth is impressive, but it’s nothing like the growth we’ve seen on the enterprise side. At only 3% penetration, there is an awful lot of room-to-run in consumer-AI.
The other thing to keep in mind is that among households who are spending on AI, the bigger spenders are increasingly a larger share of the pie:
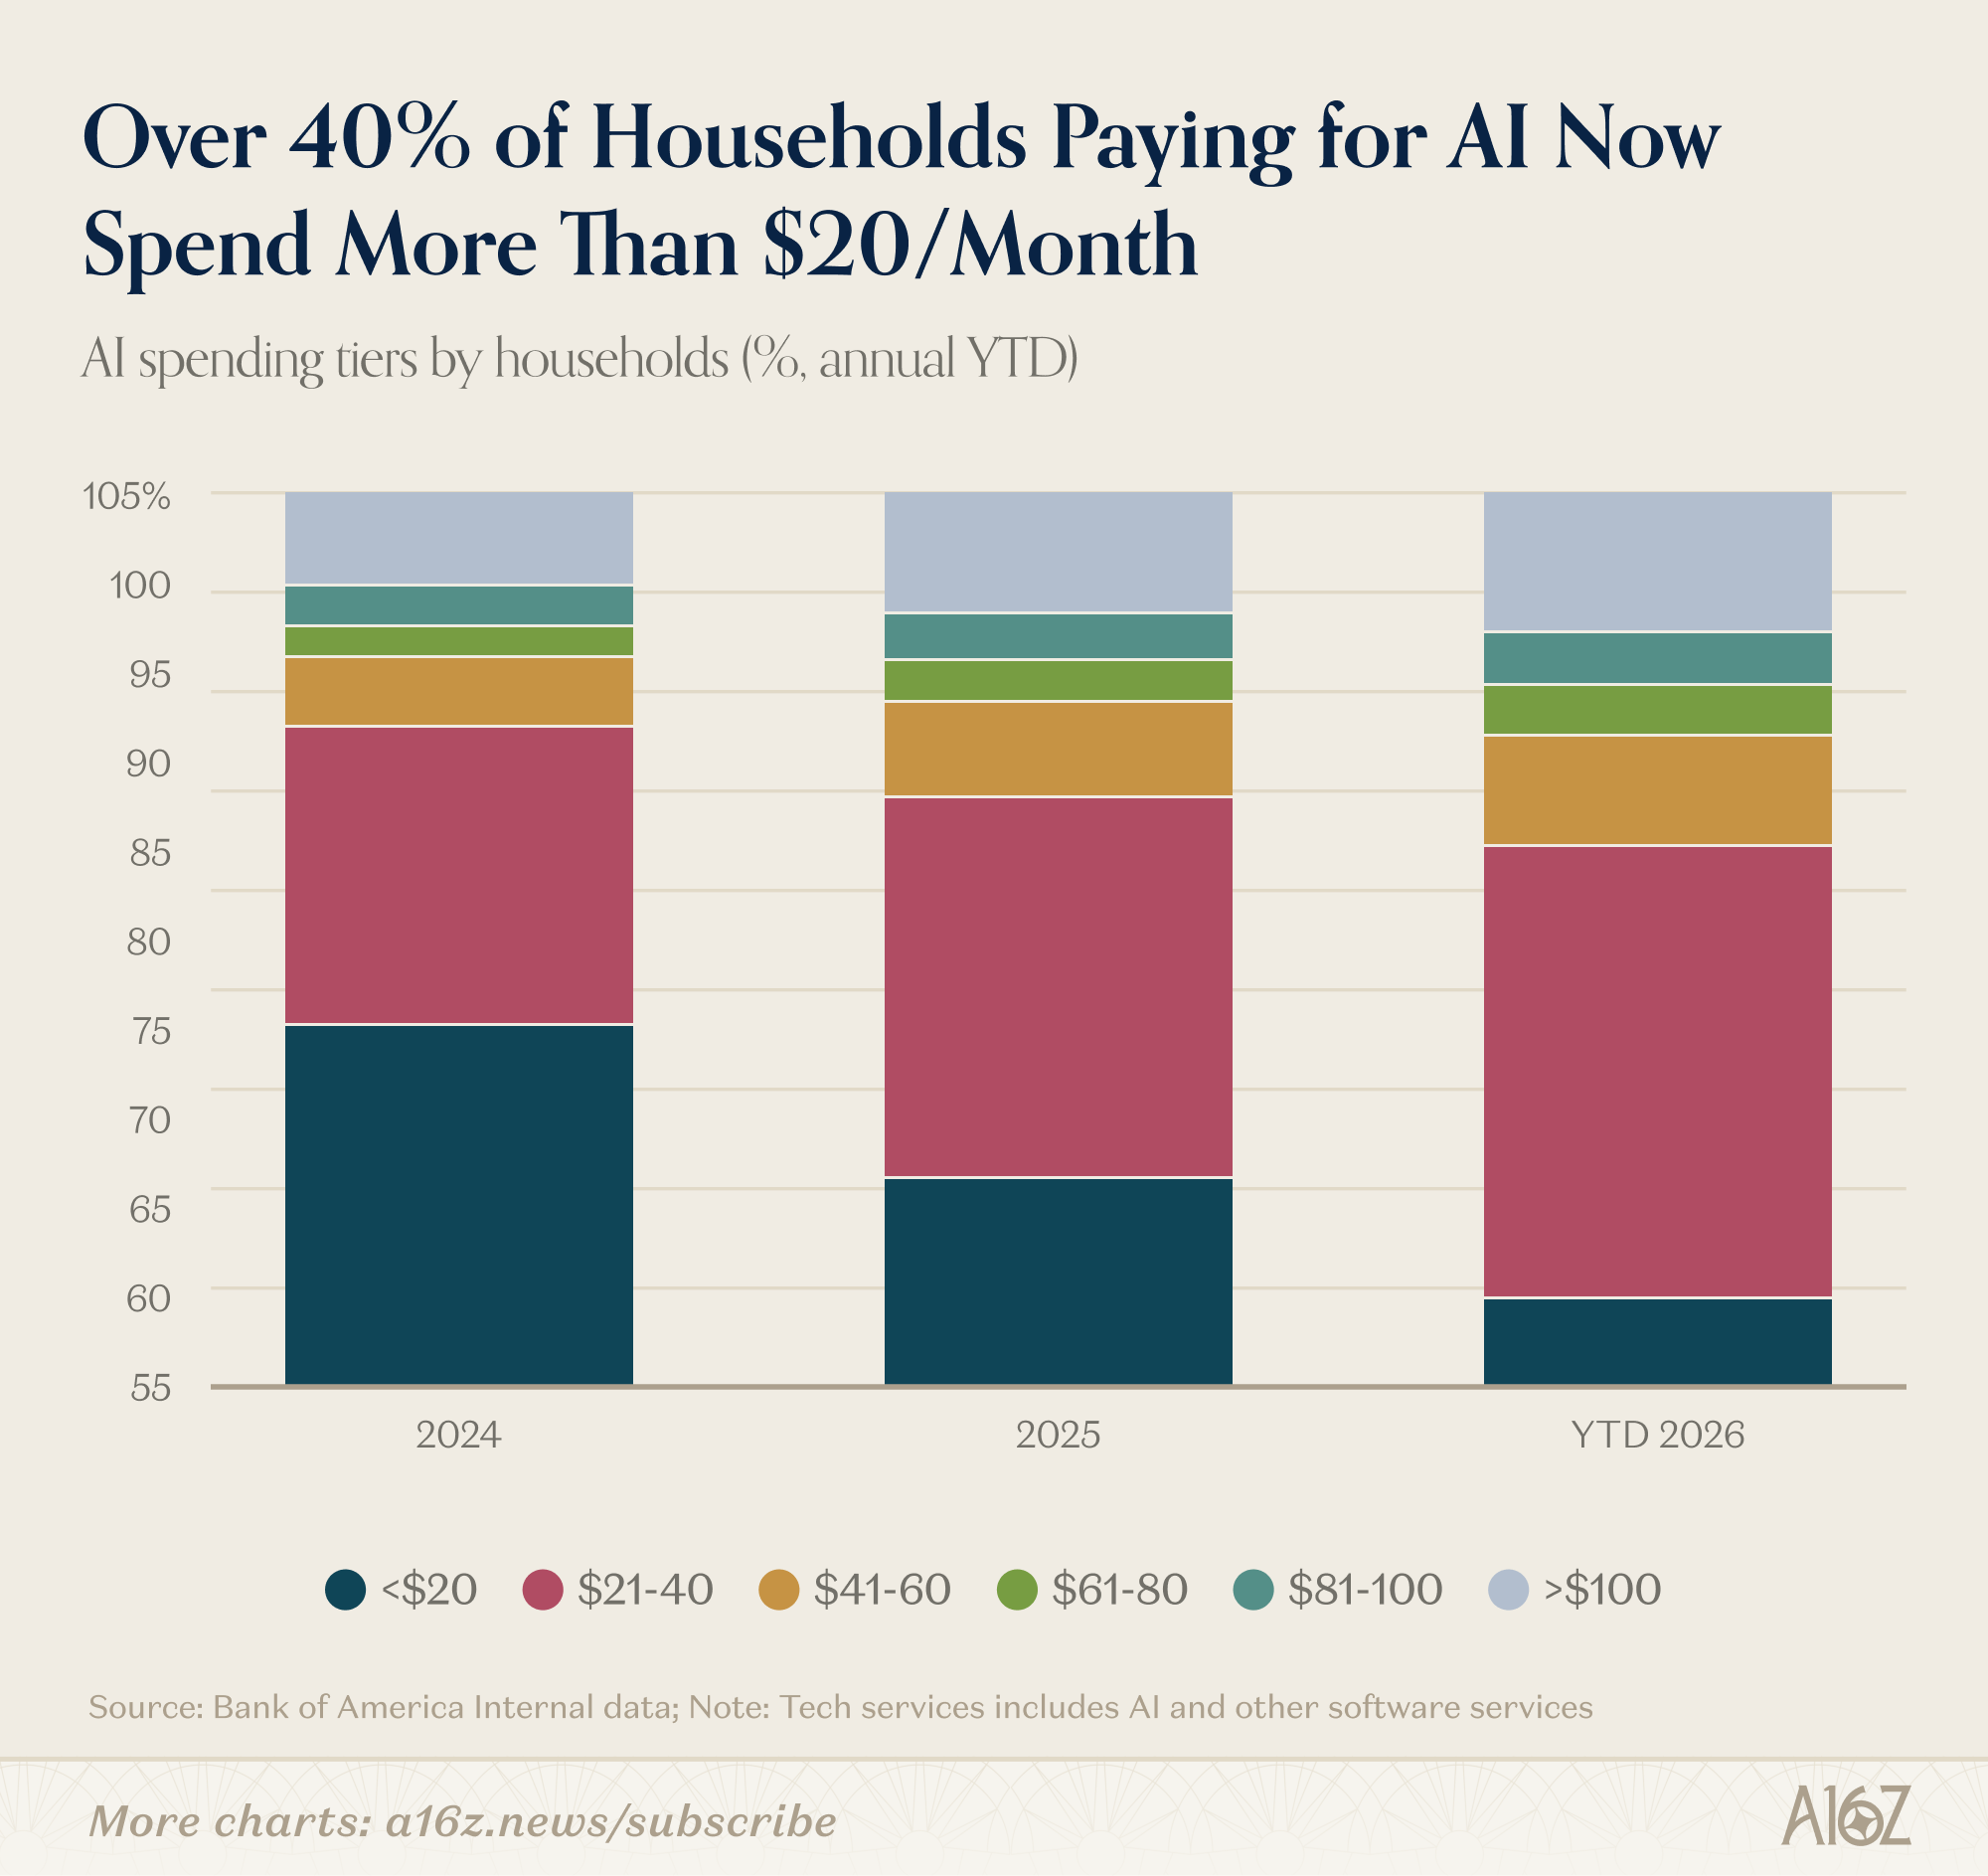
While the majority of paying households are still paying $20 or less monthly, over 40% are now paying more than that, and every “big spending” group increased its relative share.
Consumers who are spending on AI, are spending more and more.
In terms of who specifically is driving those gains? Well, the data is pretty clear on that too:
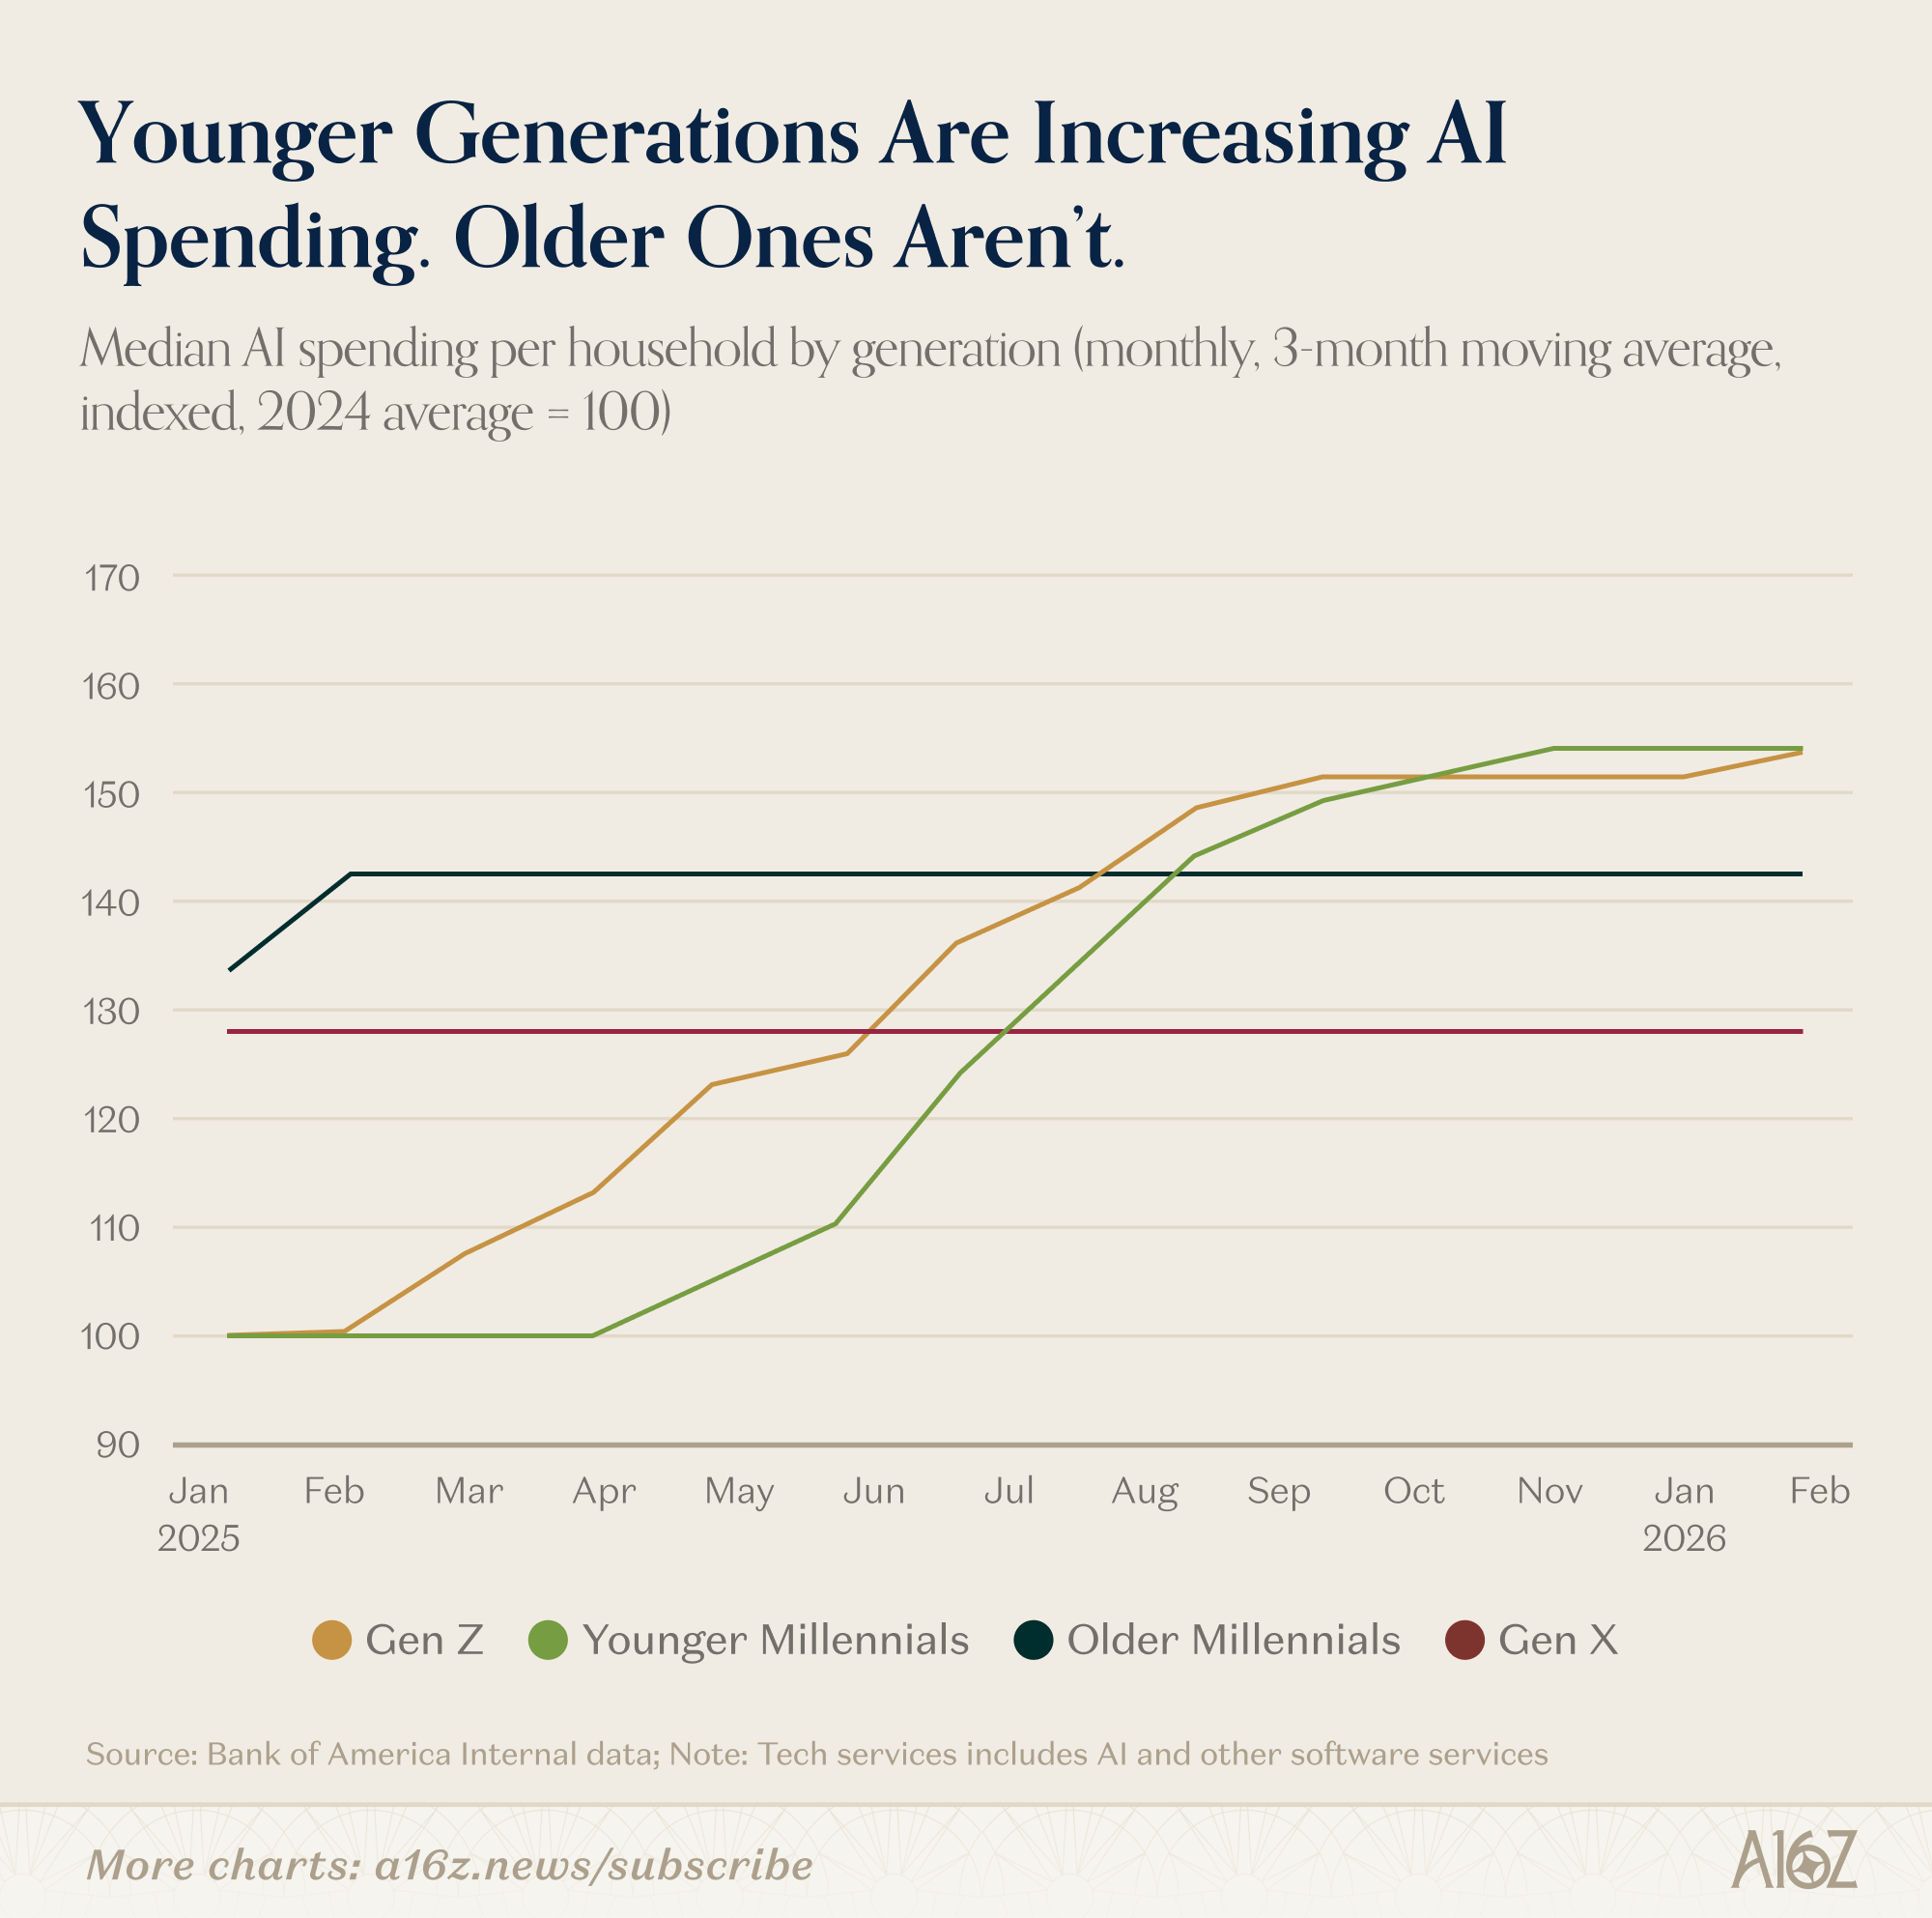
Gen-Z and Younger-Millennial households have increased their median AI spending by ~54% over the past year, while older households have been relatively flat.
Younger people are accelerating their AI spending much more quickly, over the past year. They also represent the households with the largest share of AI spenders–but even amongst Gen Z, only 5% of households are paying for AI services.
Again, however quickly growth has been, we’re still very early in this game.
Ads Come for Everything
Streaming prices are going up.
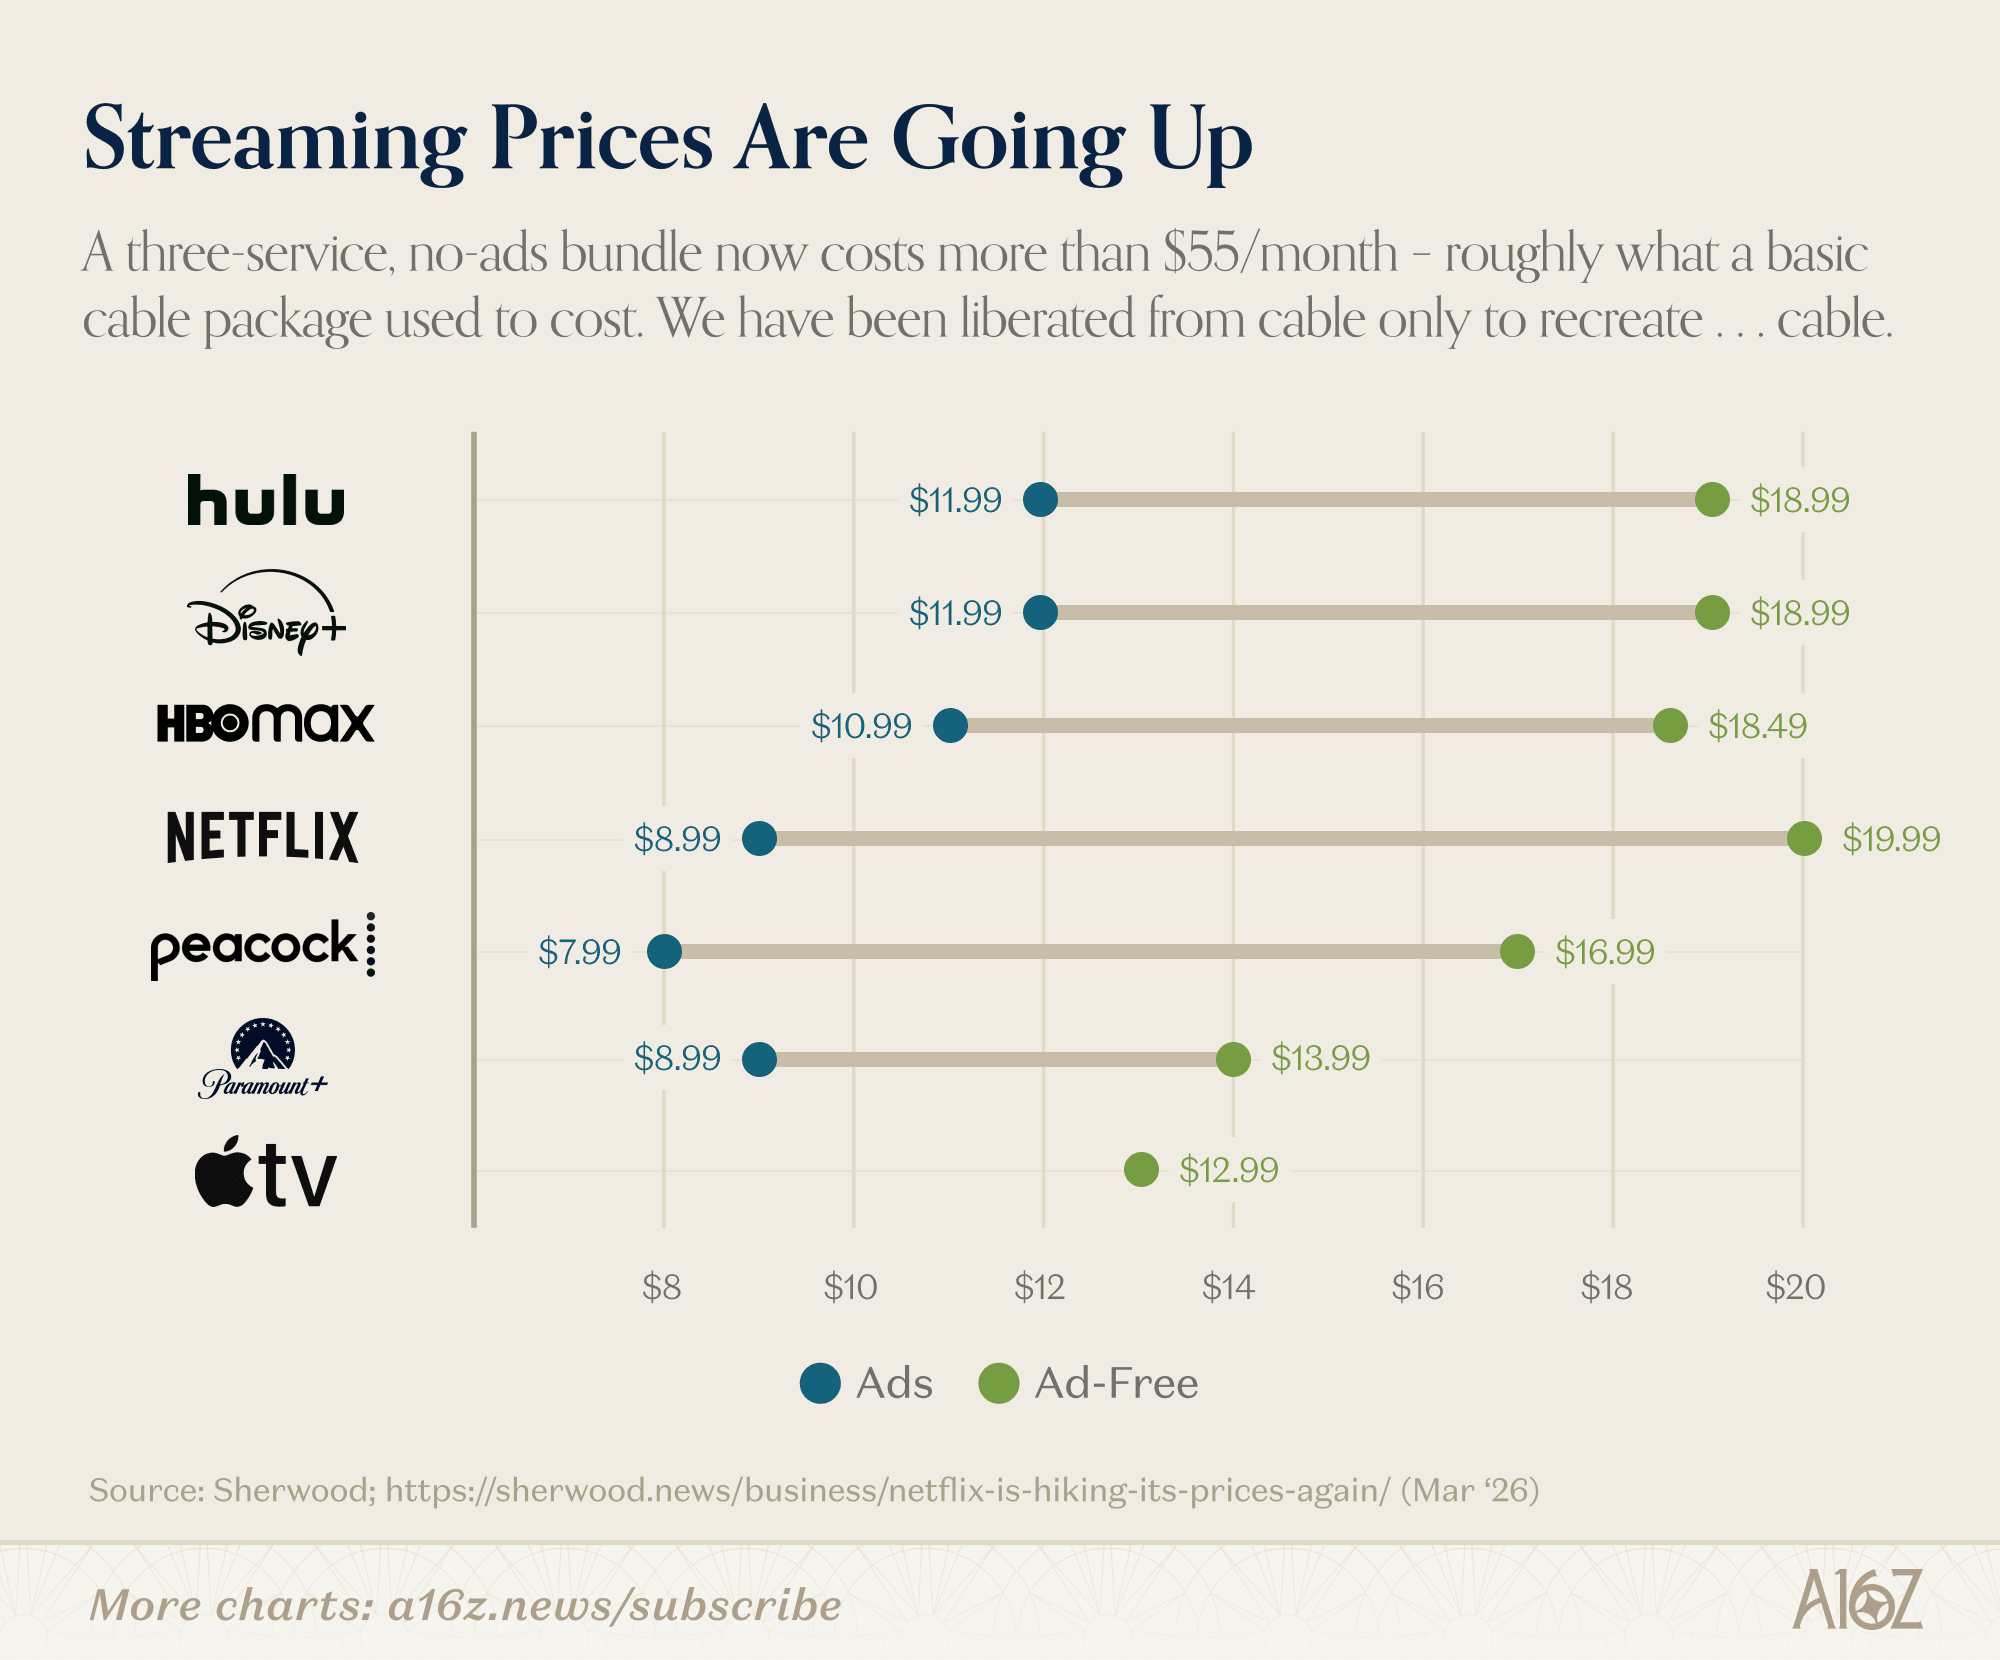
Netflix just bumped its ad-free Standard plan to $19.99. Disney+ premium is $18.99. A three-service, no-ads bundle now costs more than $55/month – roughly what a basic cable package used to cost.
We have been liberated from cable only to recreate . . . cable.
But the more interesting trend is what’s happening alongside the price hikes: the ad tier is taking over.
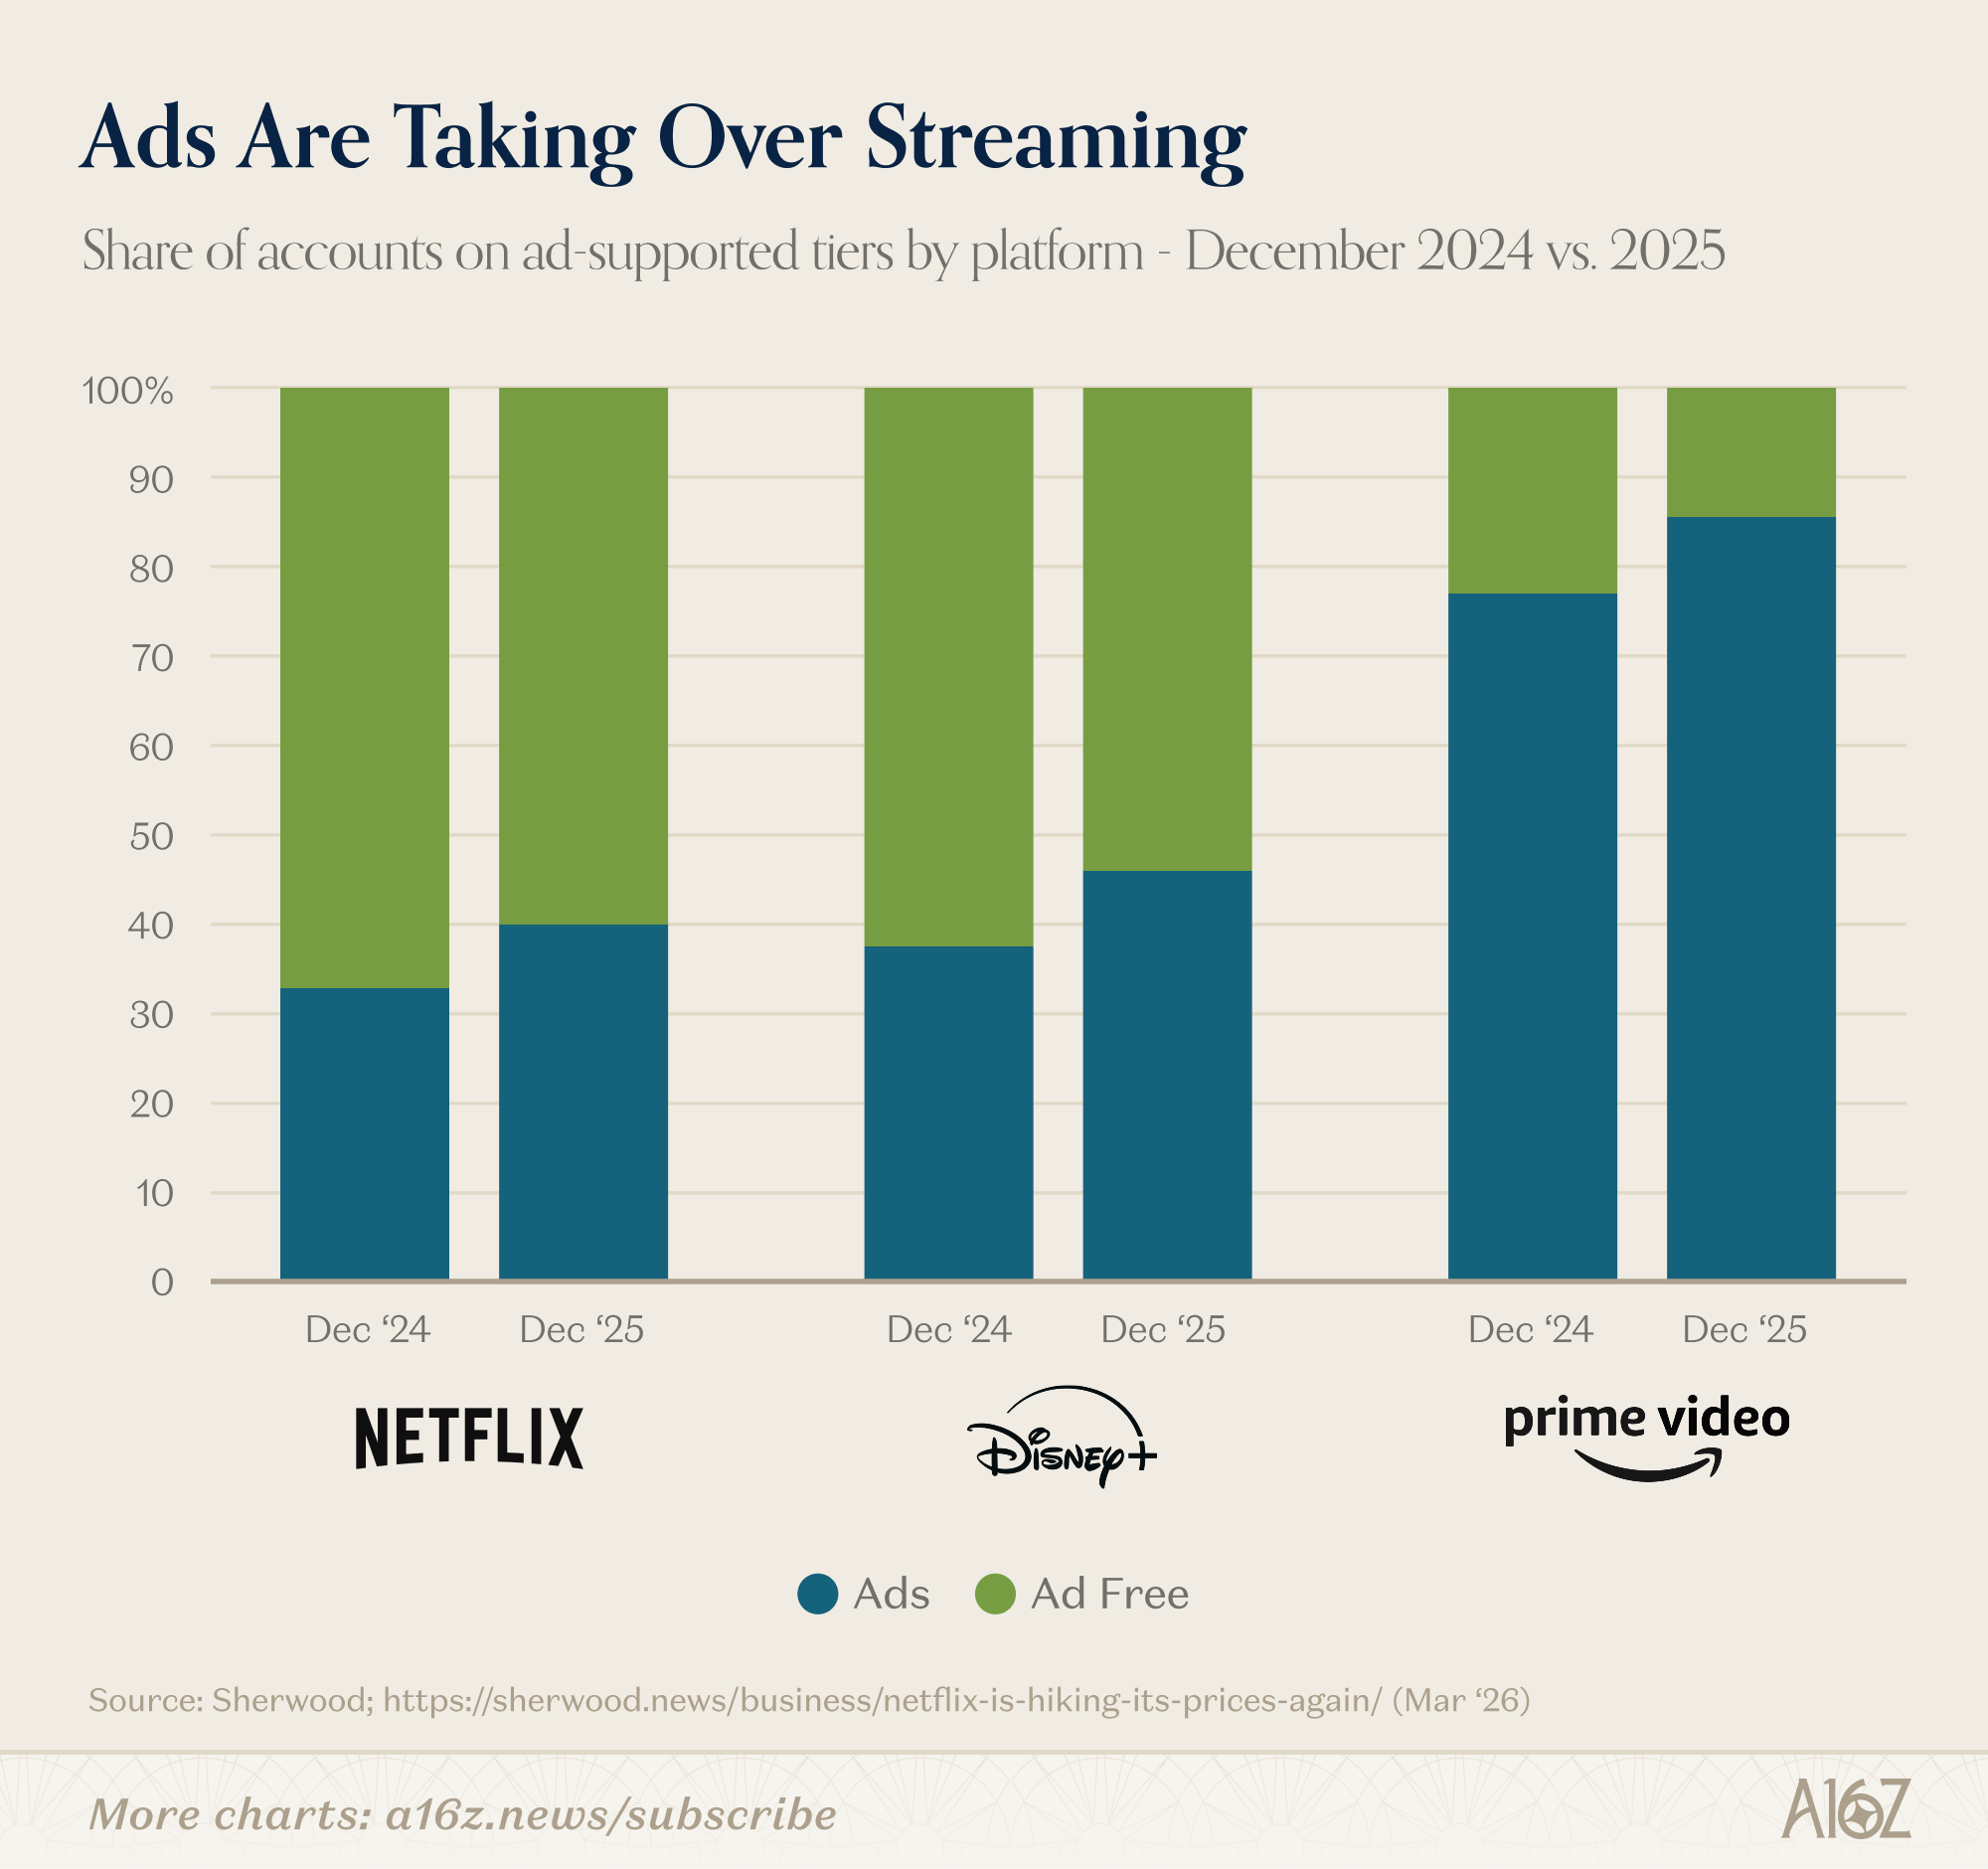
Netflix subscribers on ad-supported tiers went from 32% to 40% last year. Disney+ from 37% to 45%. And Prime Video now sits at 86% ad-supported – though that’s partly by design since Amazon defaults all subscribers to the ad tier and charges extra to opt out.
The streaming platforms are converging on the same playbook: raise the price of the ad-free tier until only the most price-insensitive subscribers stick around. Everyone else drops to the ad tier, where the platform collects a cheaper subscription plus ad revenue on top. The streamers are extracting maximum revenue from the people who hate ads, and maximum attention from the people who tolerate them.
If the trend holds, ad-supported will be the majority of accounts on every major platform not named Apple TV within a year or two.
Trucks Are Busy
There are some early signs that manufacturing activity may be picking up. Most of the evidence so far is survey-based, but if you want a more tangible signal, well, we’ve got that too.
Consider the freight market. Freight may be a leading indicator of industrial and manufacturing activity, which makes sense, given that more manufacturing means more stuff to ship.
And right now, some data suggests that demand for freight is surging.
The national outbound tender rejection index has more than doubled from roughly 5-8% last year to over 15% today.
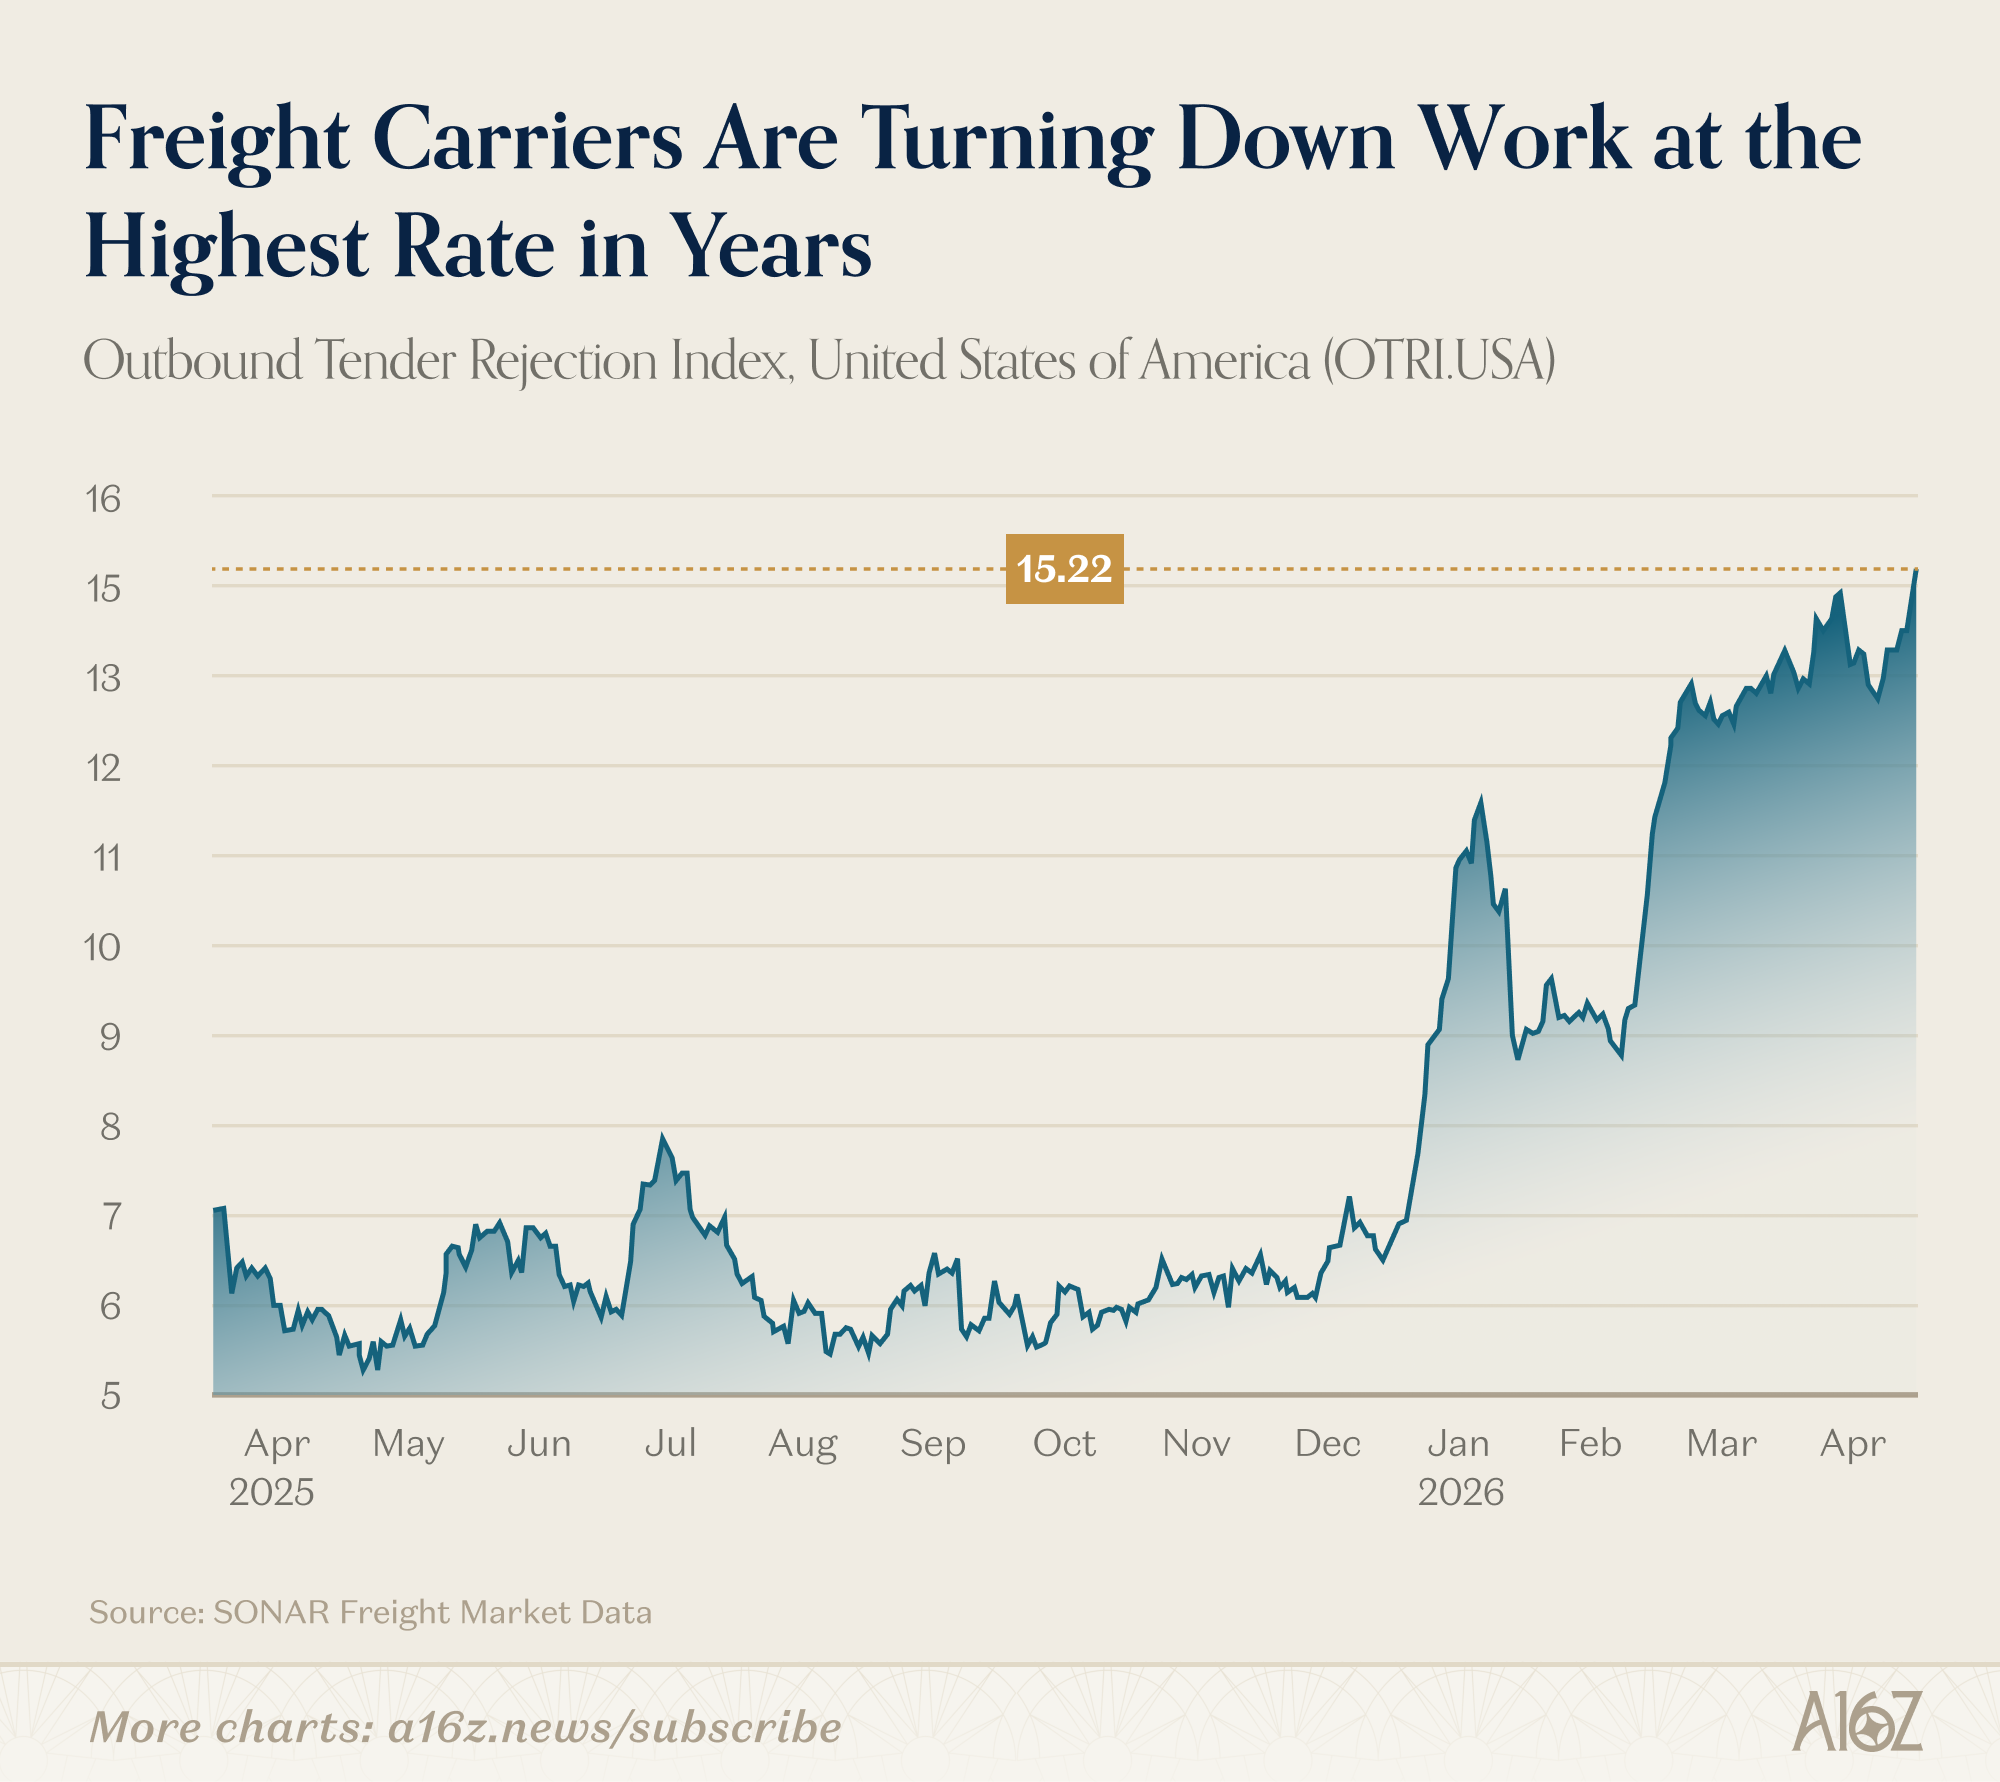
When a shipper has freight to move, they “tender” it to a carrier under contract. The carrier can accept or reject. When rejection rates are high, it means that carriers are turning down shipments, usually because demand is outstripping supply.
Flatbed is even more striking, with nearly half of all contracts rejected:
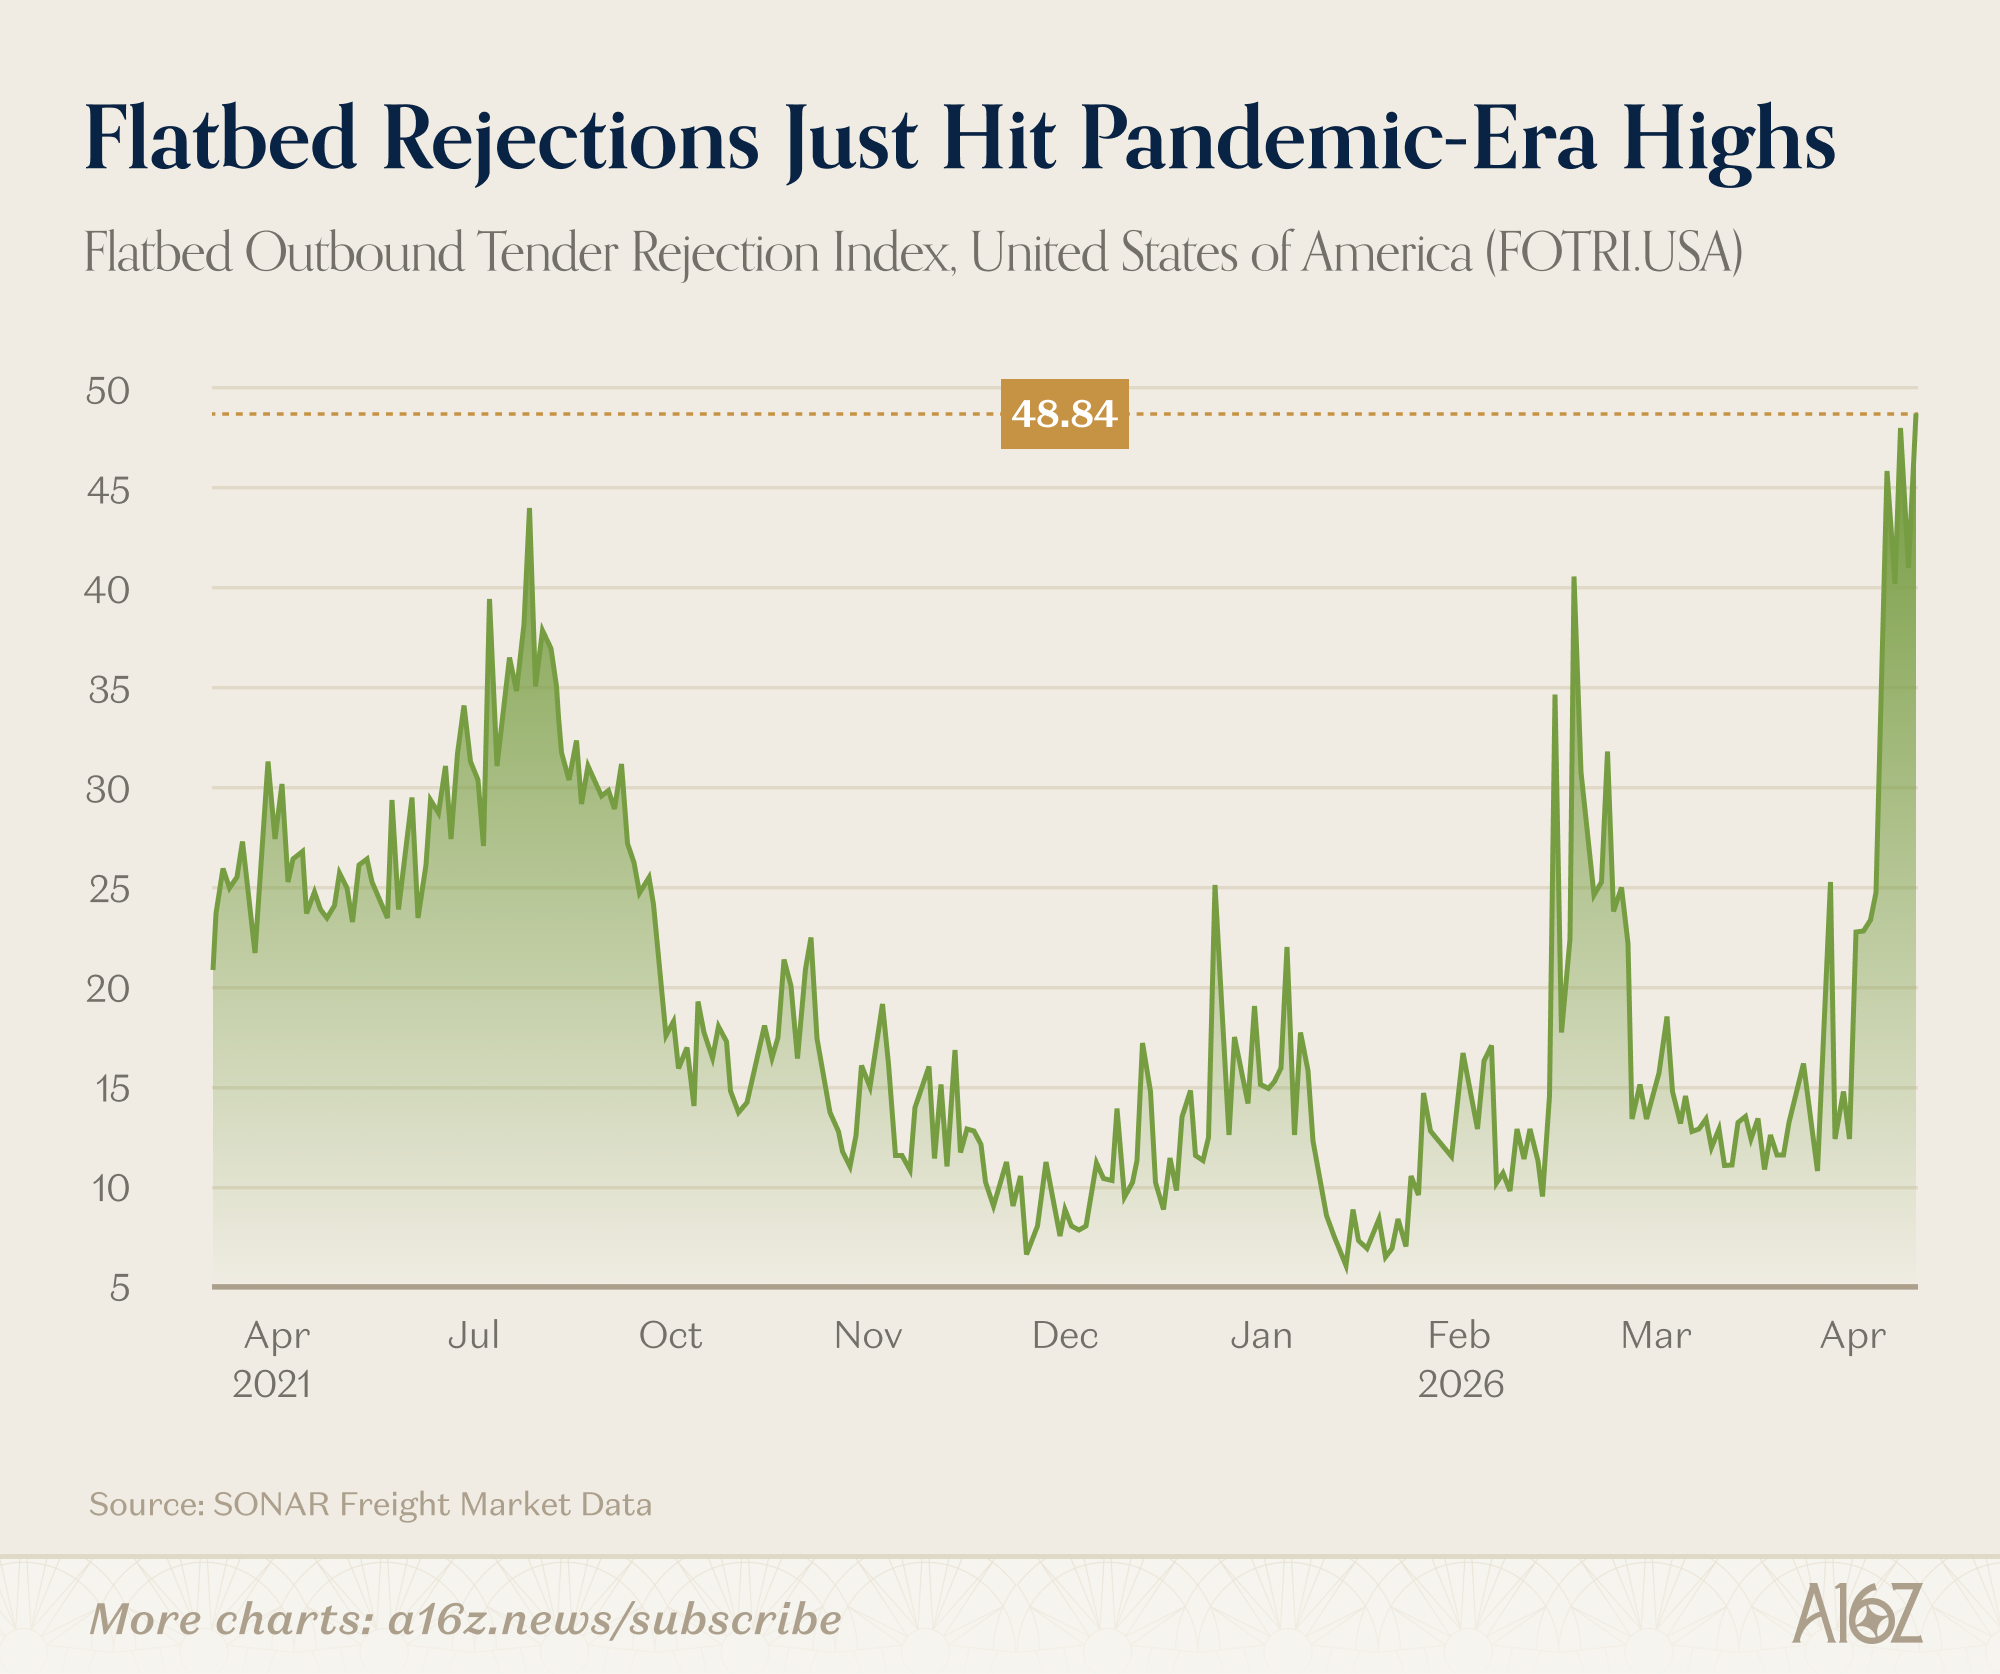
A 49% rejection rate for flatbed trucking is higher than it was during the early-2022 pandemania surge.
Flatbed is the segment most tied to industrial and construction activity (steel, lumber, heavy equipment), so when carriers are rejecting nearly half of all tenders, it tends to mean the physical economy is busier than the headlines suggest.
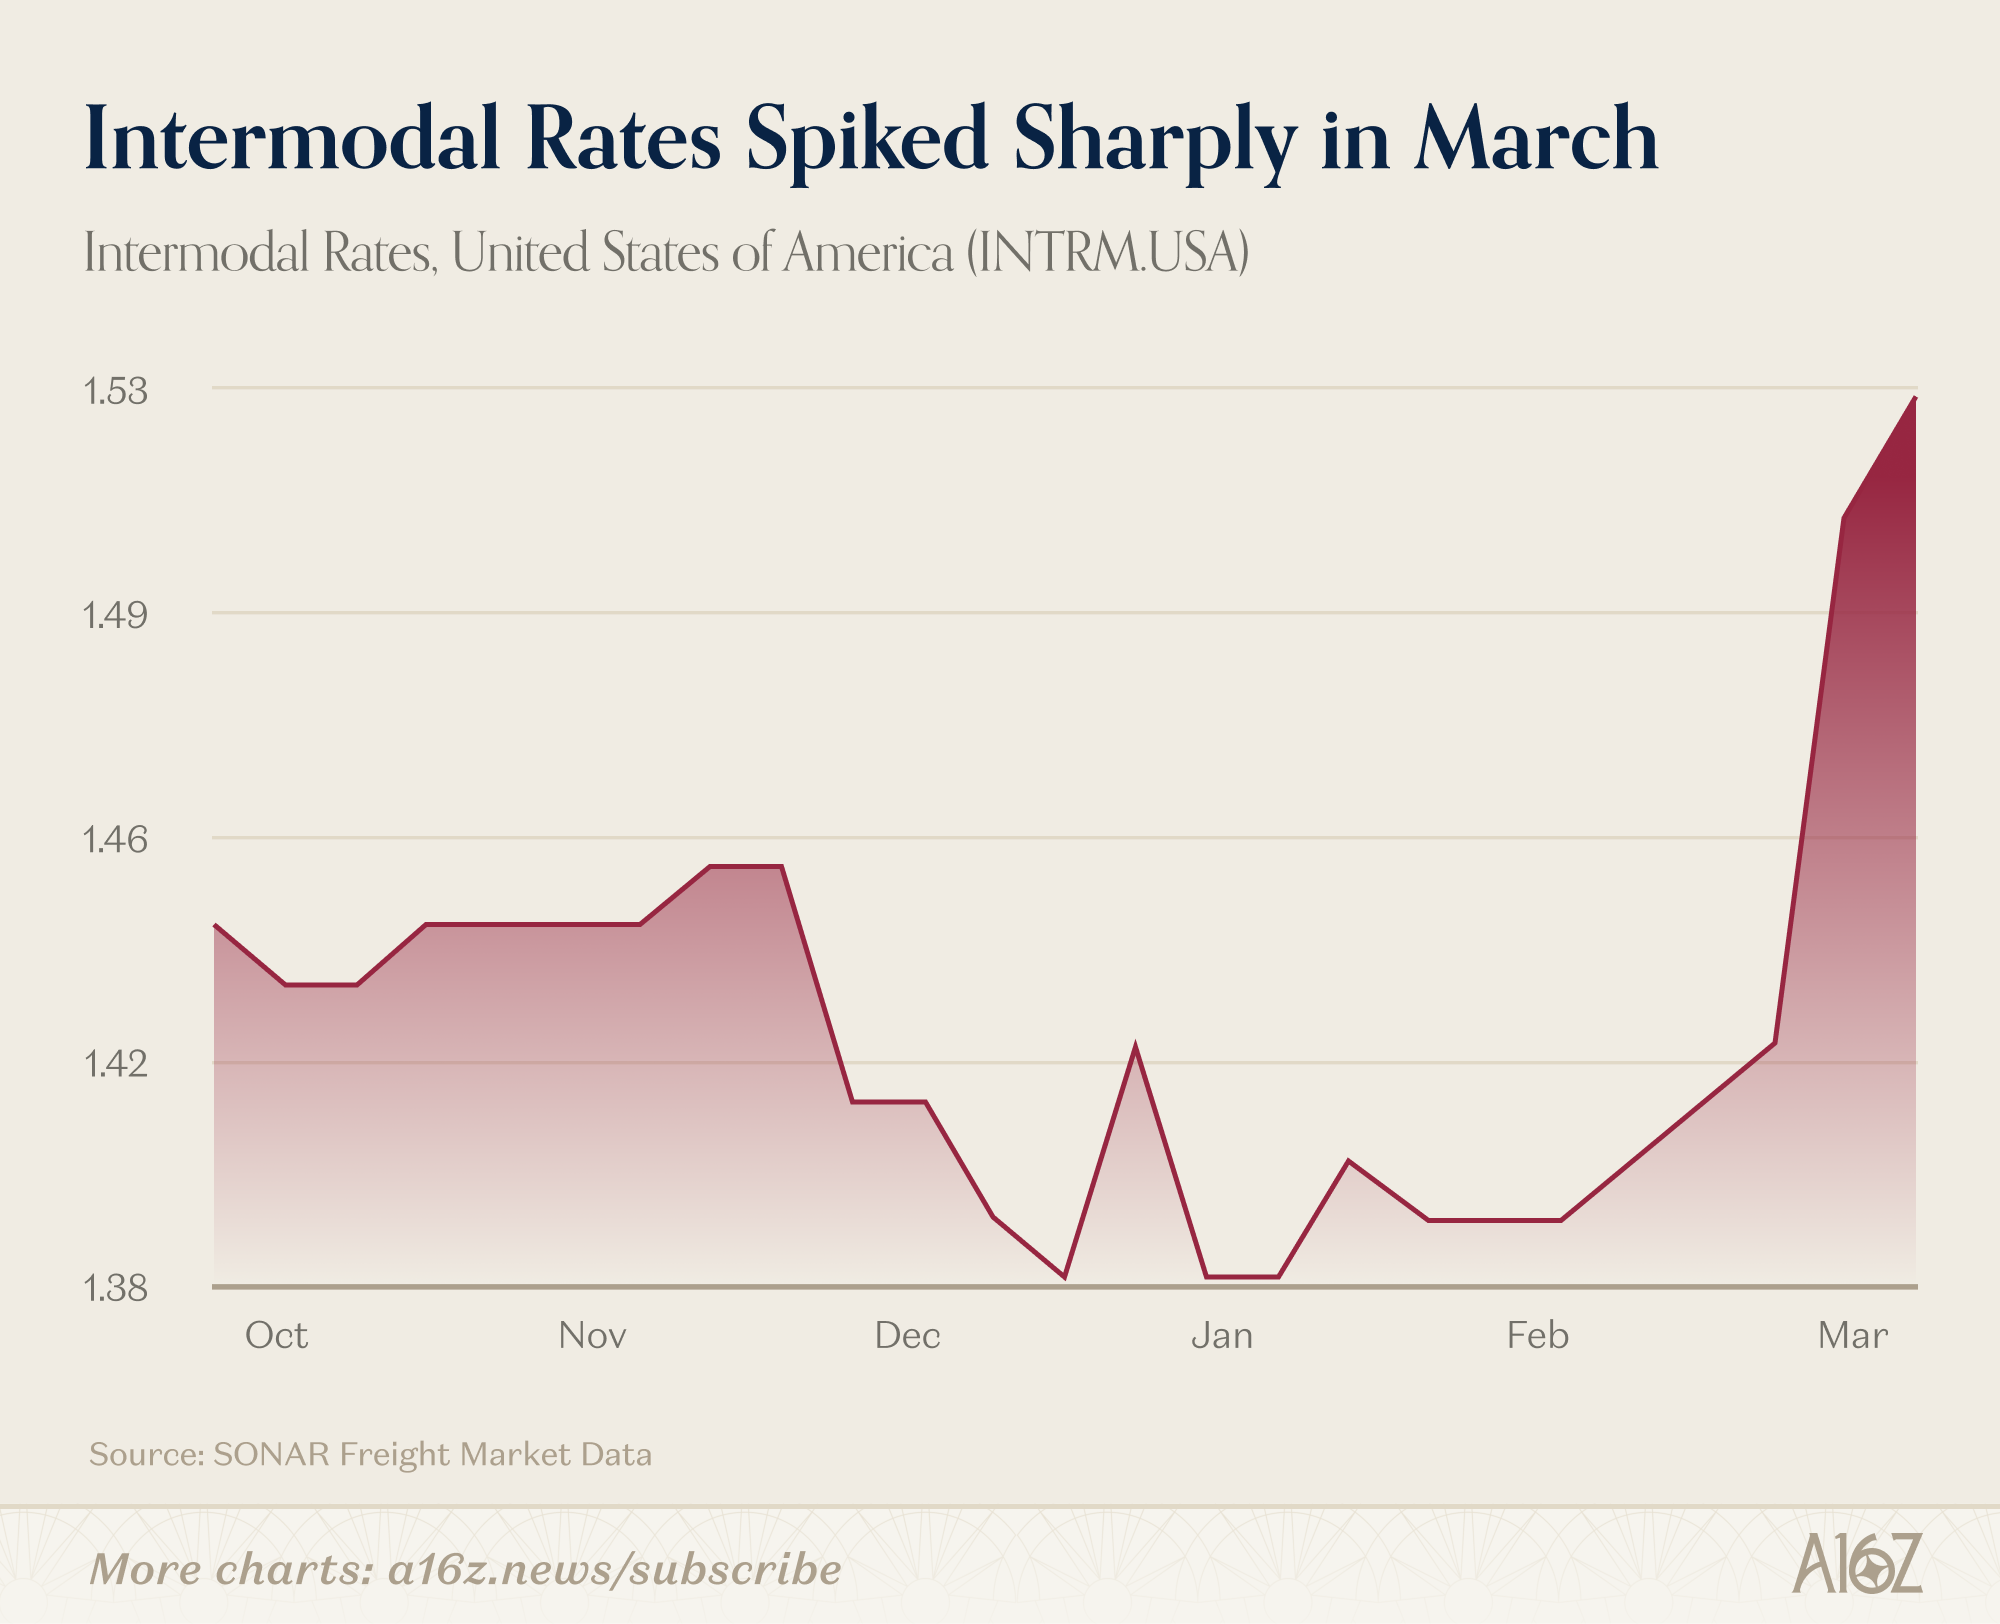
Intermodal rates are telling a similar story – after trading flat for months, rates spiked roughly 10% in March:
Of course, rejections can spike for two reasons: more freight or fewer trucks. And after three years of a freight downturn (that drove trucking companies out of business), there are genuinely fewer trucks out there. In other words, surely some of what we’re seeing is a supply-side story, as well.
That said, 49% flatbed rejections are hard to explain on supply alone. Domestic demand for big-stuff shipping is ripping. Whether it keeps on ripping remains to be seen, but the freight data says the physical economy is tighter than it’s been in years.
Earnings Go Up, Prices Go Down
Here’s something that you don’t usually see.
Normally, when earnings go up, share prices go up too. And yet, forward earnings for the S&P 500 just hit an all-time high, but the index price is rolling over:
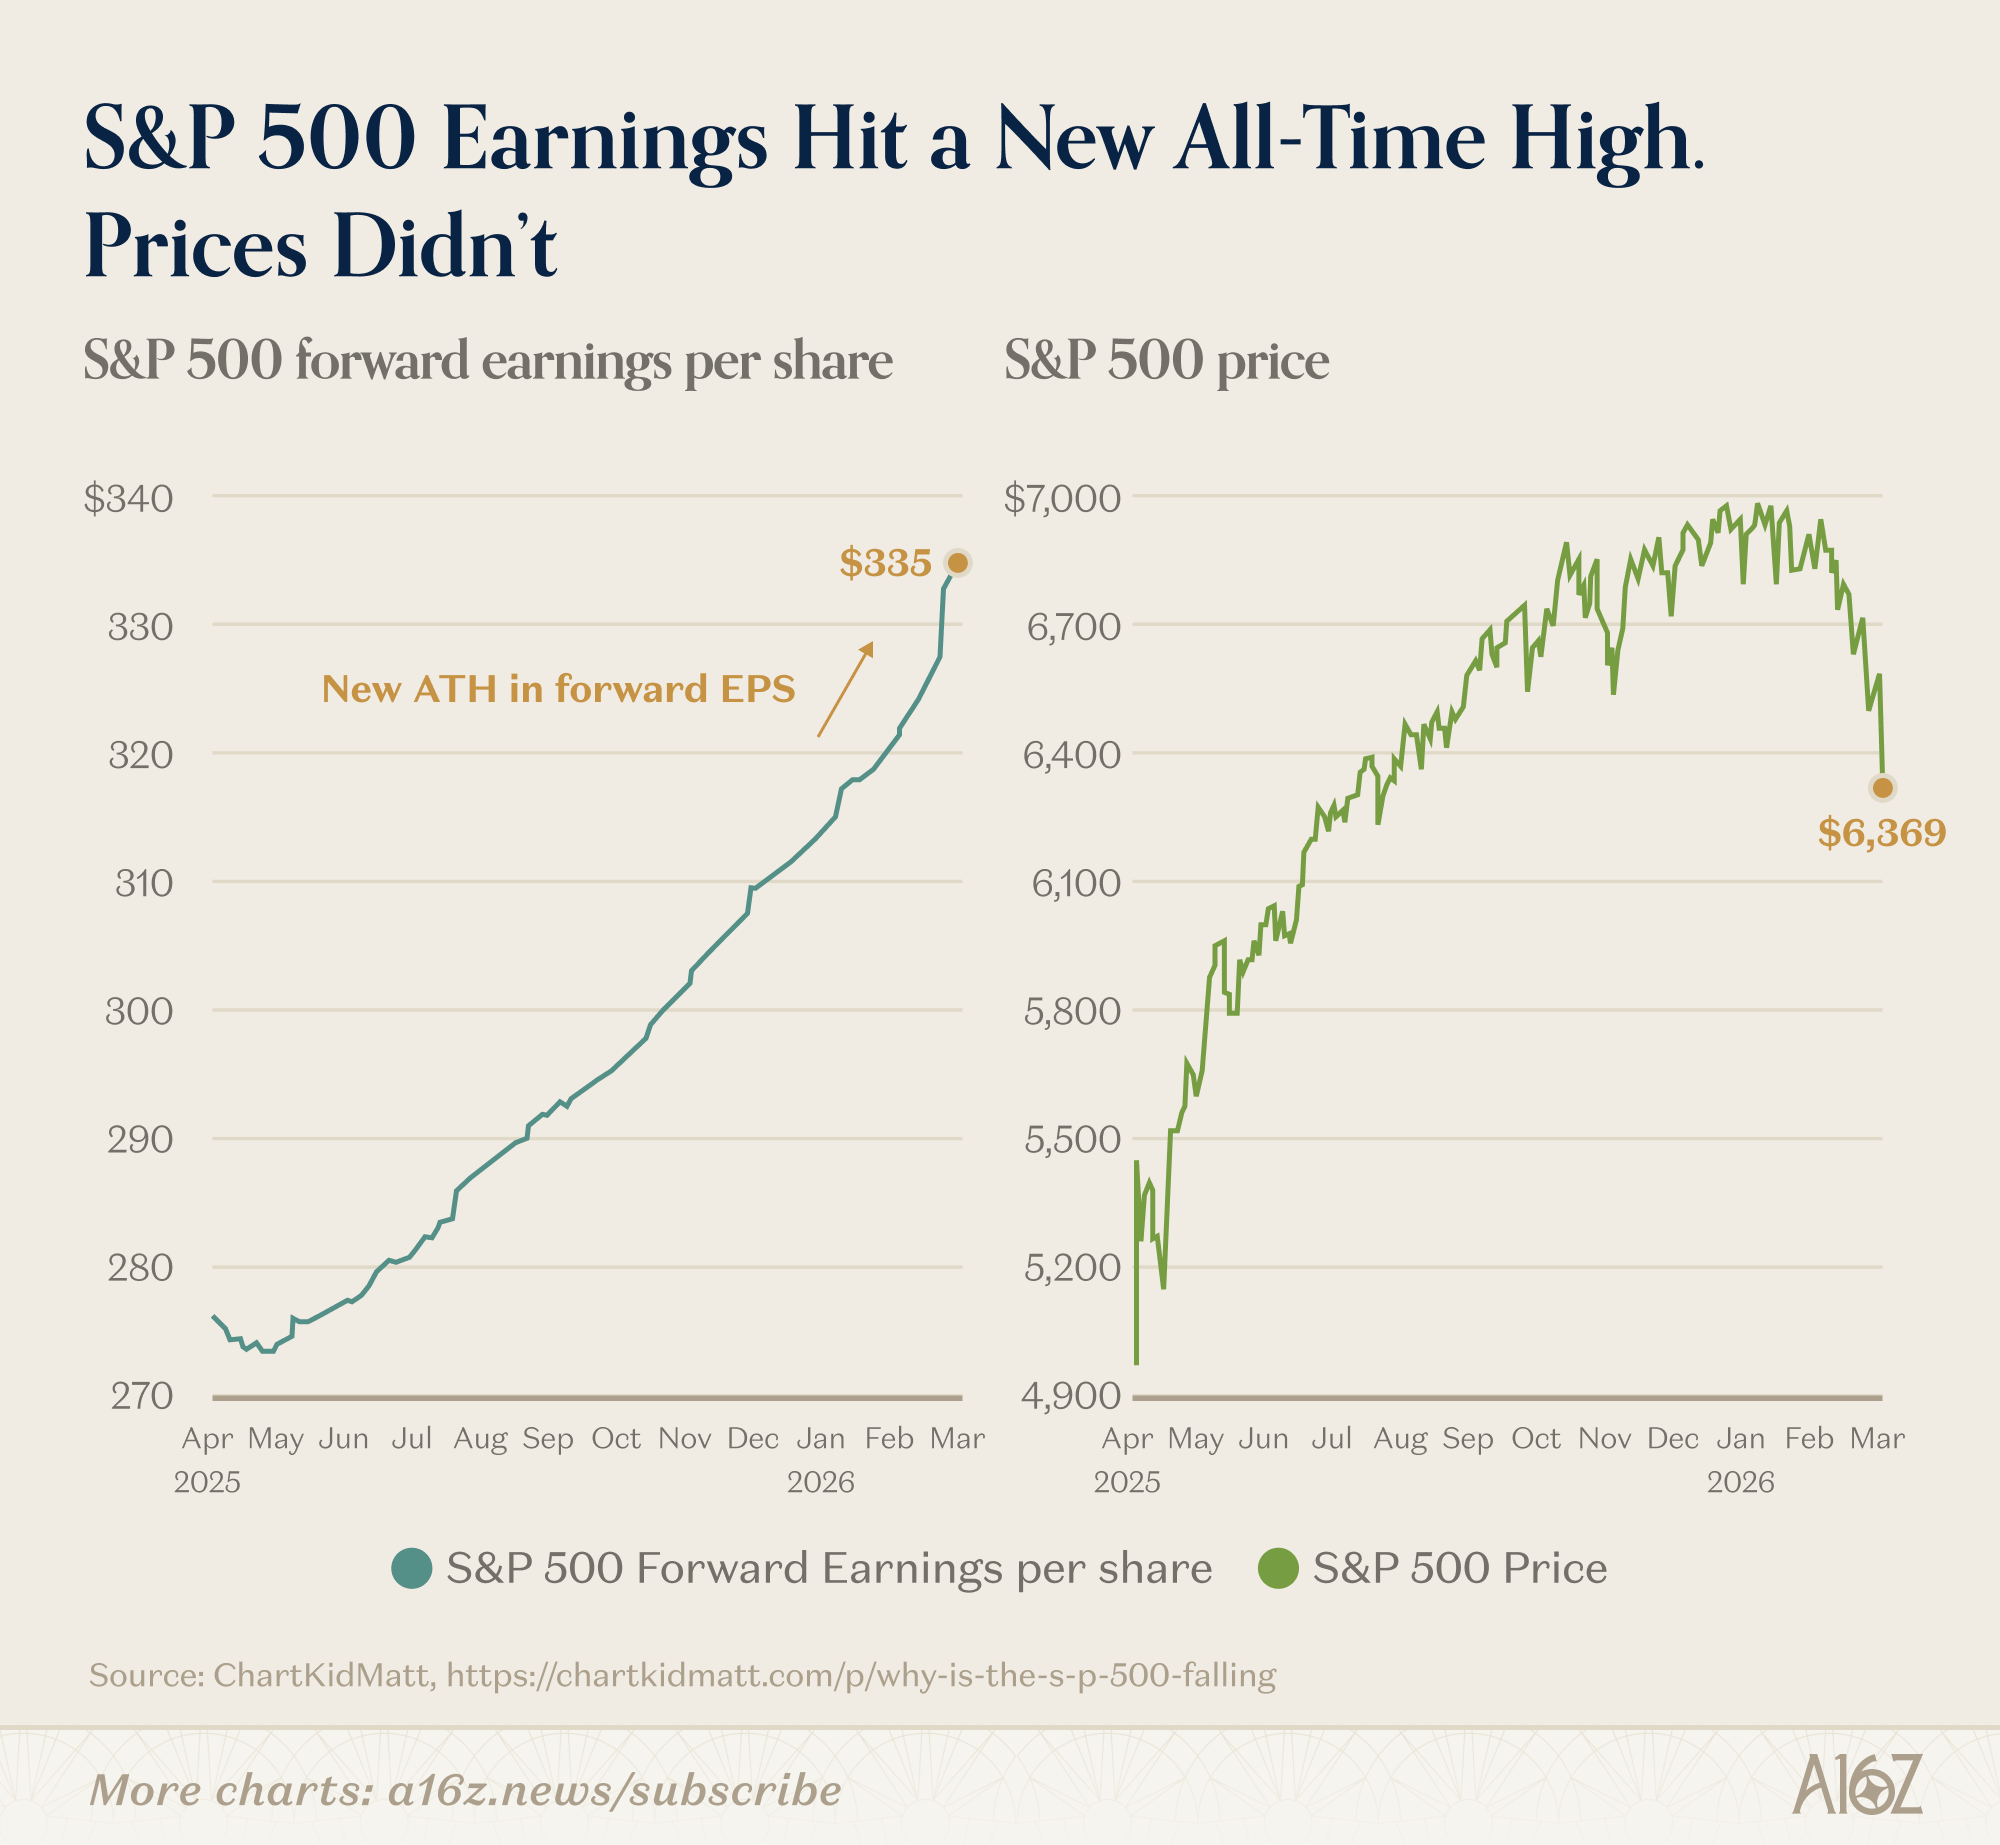
When earnings increase, but share prices decline, it necessarily means one thing: multiple compression.
Forward P/E for the index has retreated to ~21.5x, which is still quite high, but not quite as high as its top centile range of ~23x.
Why are earnings multiples compressing? There’s never just one reason, but some possibilities include simple mean reversion, plus a healthy dose of geopolitical risk, volatile commodity prices, and general uncertainty.
Another likely factor is earnings quality. Profits are still going up, but free cash flow is going down, down, down:
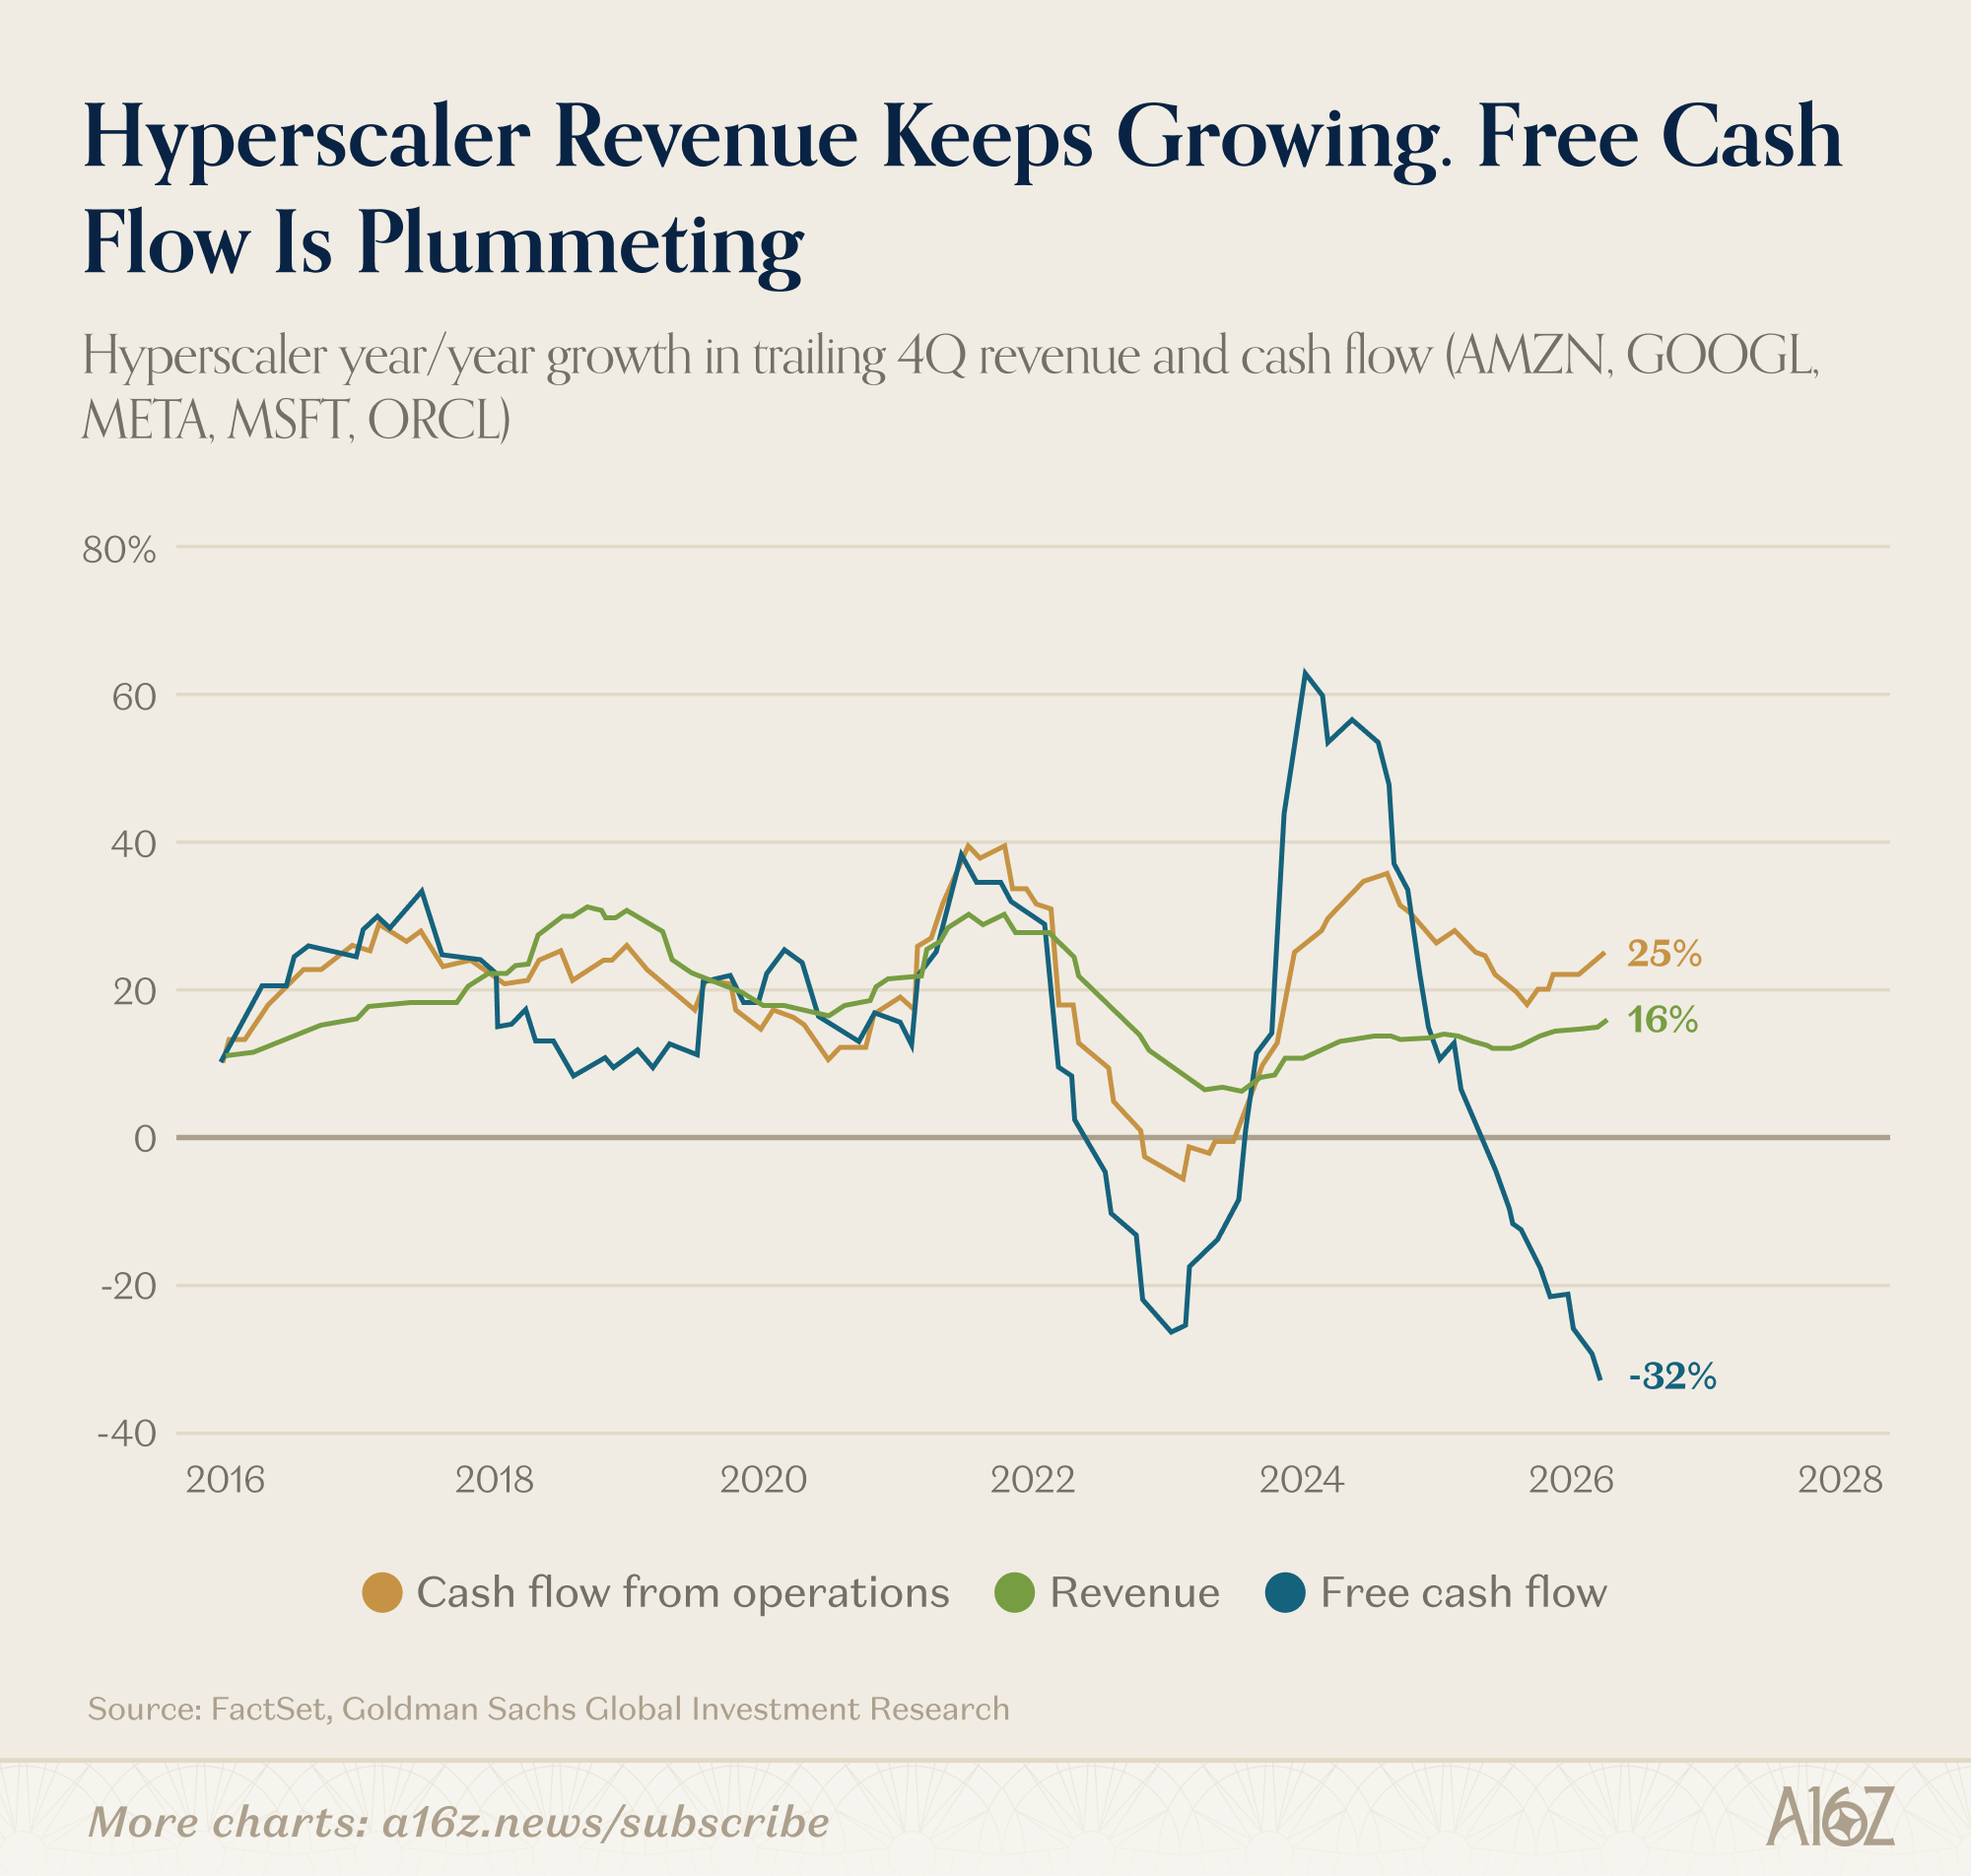
For the hyperscalers, revenue and operating profits continue to rise, but free cash flow has plummeted, as they plow more and more money into the AI buildout.
Gotta spend money to make money, as the saying goes. Doesn’t mean the market is going to like it, however.


This newsletter is provided for informational purposes only, and should not be relied upon as legal, business, investment, or tax advice. Furthermore, this content is not investment advice, nor is it intended for use by any investors or prospective investors in any a16z funds. This newsletter may link to other websites or contain other information obtained from third-party sources - a16z has not independently verified nor makes any representations about the current or enduring accuracy of such information. If this content includes third-party advertisements, a16z has not reviewed such advertisements and does not endorse any advertising content or related companies contained therein. Any investments or portfolio companies mentioned, referred to, or described are not representative of all investments in vehicles managed by a16z; visit https://a16z.com/investment-list/ for a full list of investments. Other important information can be found at a16z.com/disclosures. You’re receiving this newsletter since you opted in earlier; if you would like to opt out of future newsletters you may unsubscribe immediately.
Twilio is the one that doesn't make sense to me- don't all of these new vibe-apps need to send email/sms? Or do they only communicate via agent-native protocols?
On the other hand Canva and Figma are tools for a legacy form of development- they should go away. Figma in particular has always been the source of awkward handoffs- it's a drawing program more than it is a UX tool.
Vercel is just a terrible company, built on the back of the most overcomplicated Javascript/Typescript mess, it will collapse under the weight of its own mess.
I could have Monday.com cloned by next Tuesday.
Hubspot has allowed people to create their own huge data messes in there- I think that will stick around.
--
No Ads.
The freight section is the sleeper insight here. Everyone's focused on the AI vs. SaaS narrative, but a 49% flatbed rejection rate (higher than the 2022 pandemic surge!) is a genuinely surprising signal about the physical economy
It makes me wonder if there's a connection to the AI buildout itself: all those data centers and GPU clusters need steel, concrete, and heavy equipment to get built.