



America | Tech | Opinion | Culture | Charts

Software’s Selective Sell-Off
The trials and travails of publicly traded software companies mostly continues apace, but as we touched on before, the current state of affairs is not an undifferentiated ‘bloodbath.’
It’s also the case that the software sell-off isn’t so much a reflection of present or recent performance, but rather the market’s collective doubt as to whether software cos can keep it up, over the longer-term:
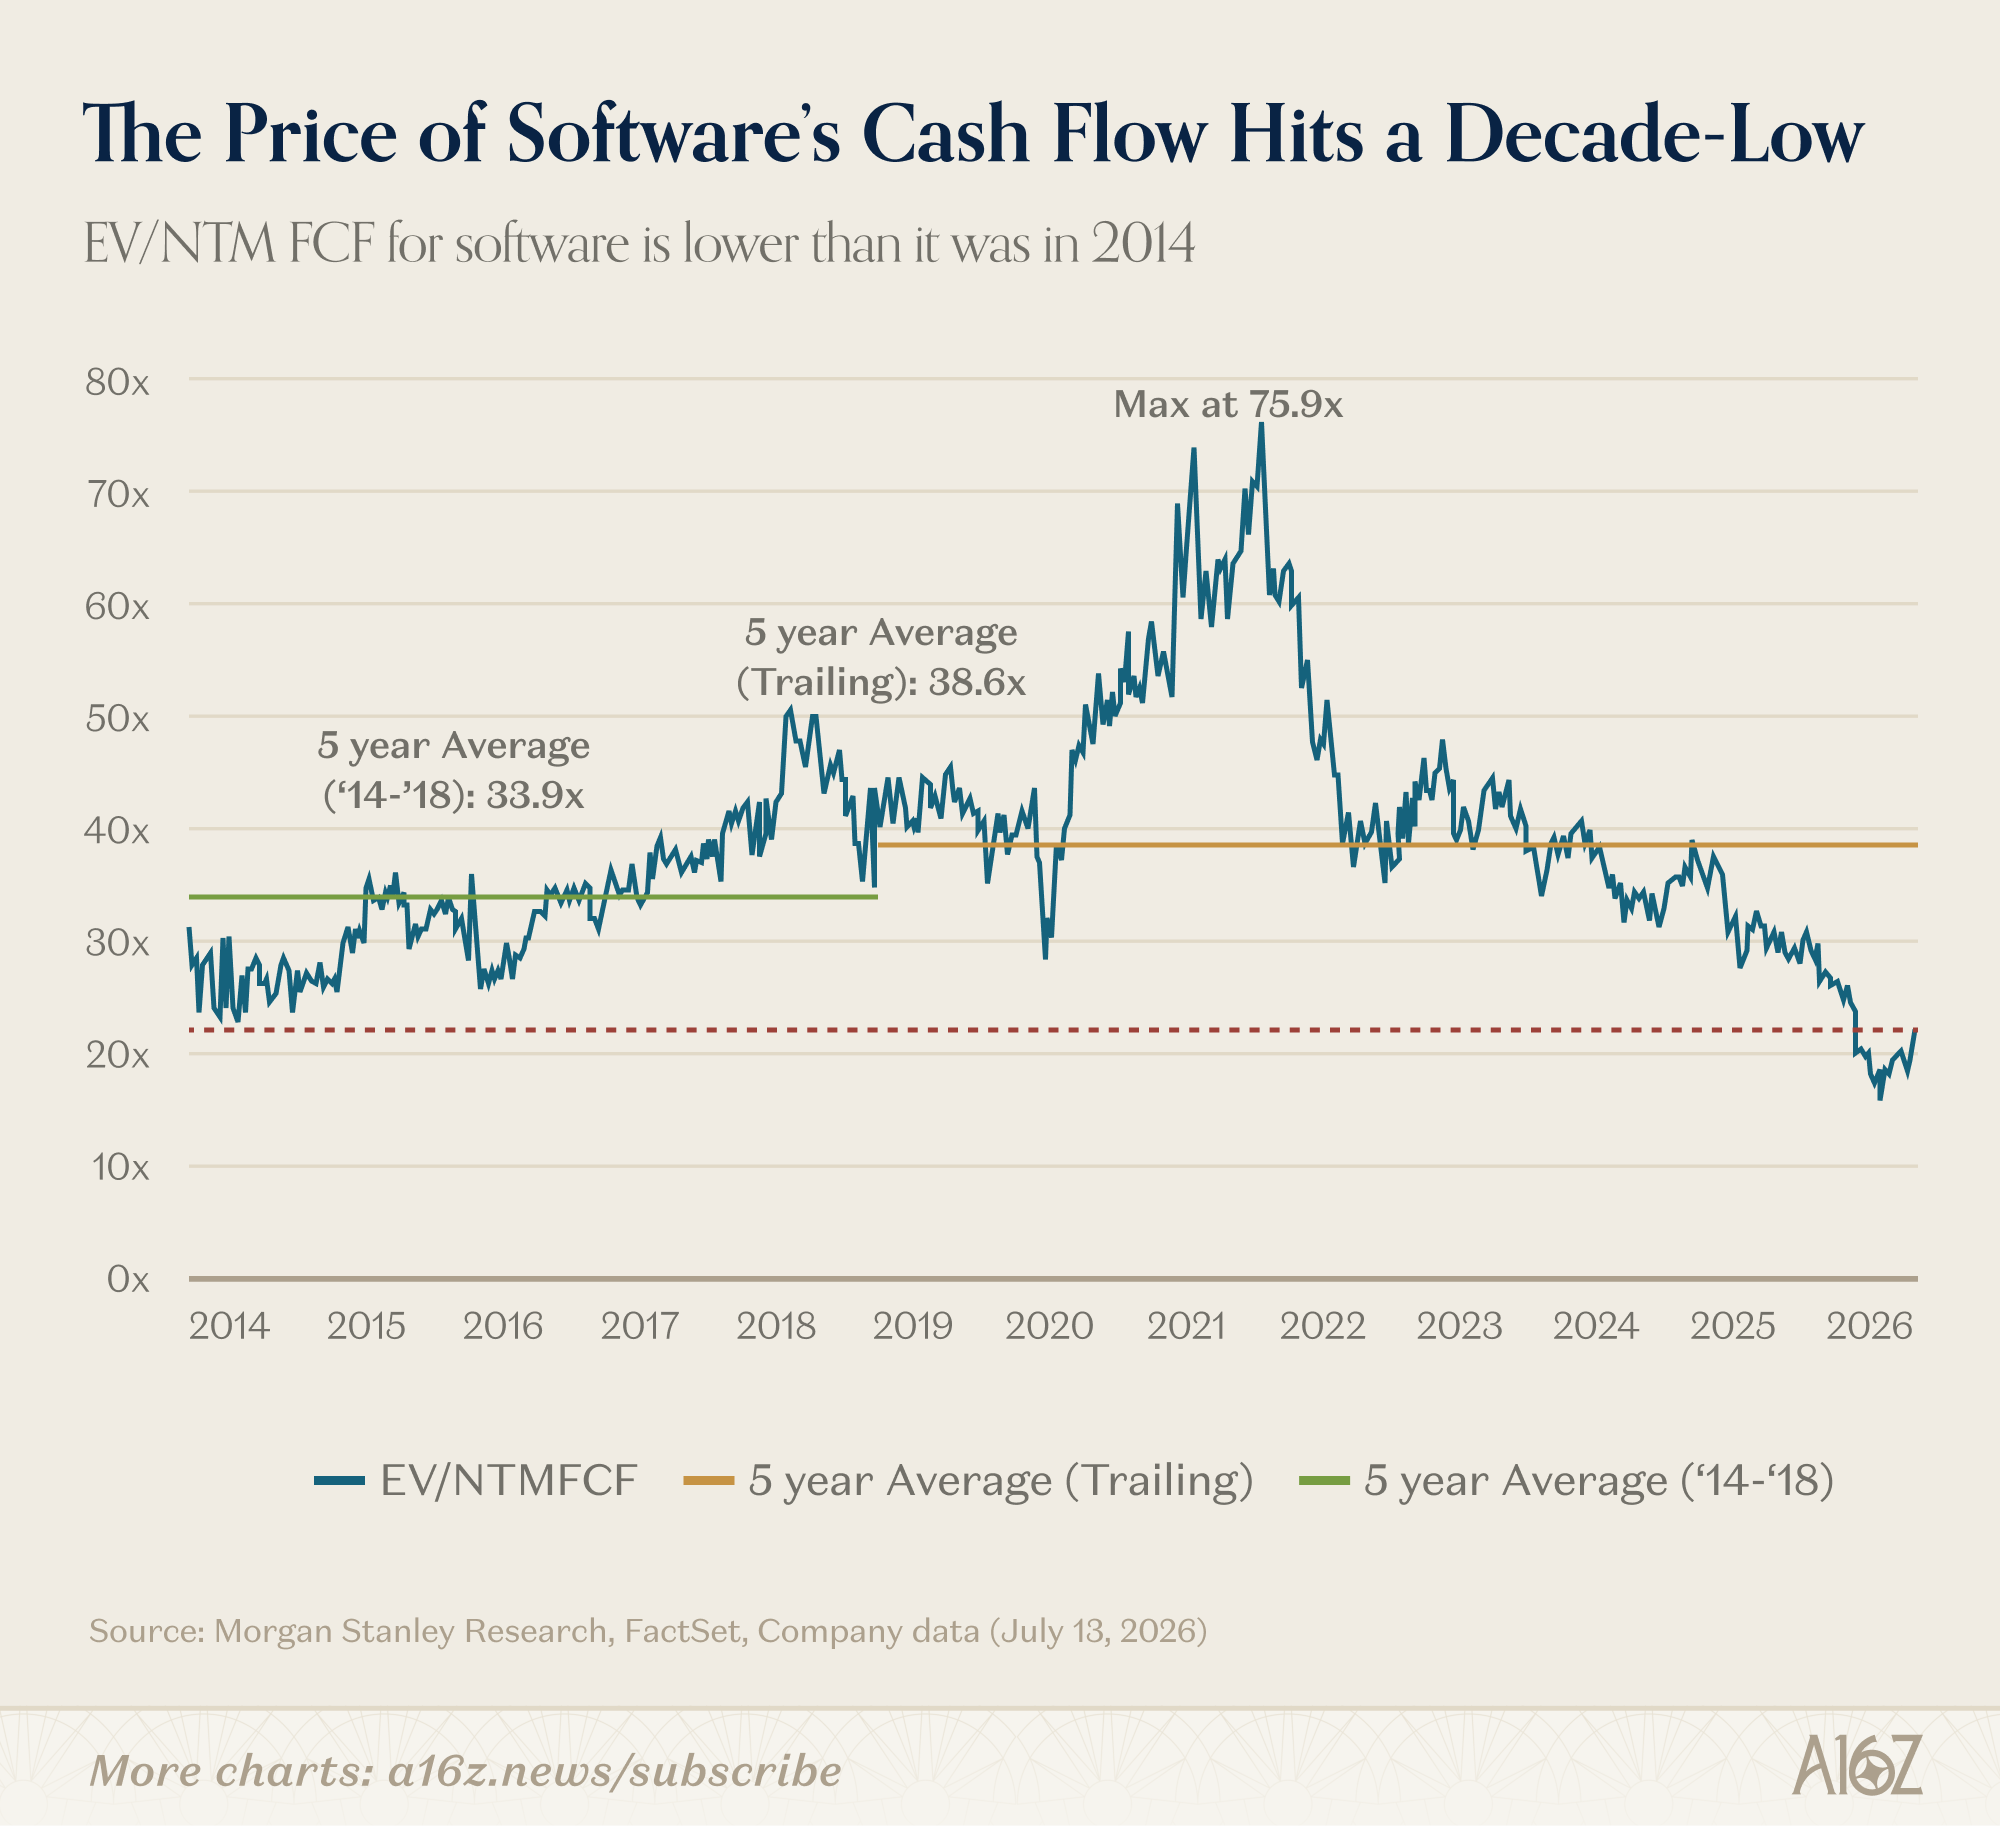
Multiples on next-twelve-months free cash flow are at or below 2014 levels. In other words, investors are assigning their lowest premium on software’s cold-hard-cash generation in over a decade.
While the “market” never really speaks with one mind, the simplest explanation for the discount is that the market does not think the next twelve months will reflect the next twelve months after that.1 It’s an AI disruption story, of course. Performance is fine now, but how long can it go? After all, print media stocks traded down well before their doom was reflected in earnings, and investors were surely right to be early (so the story goes).
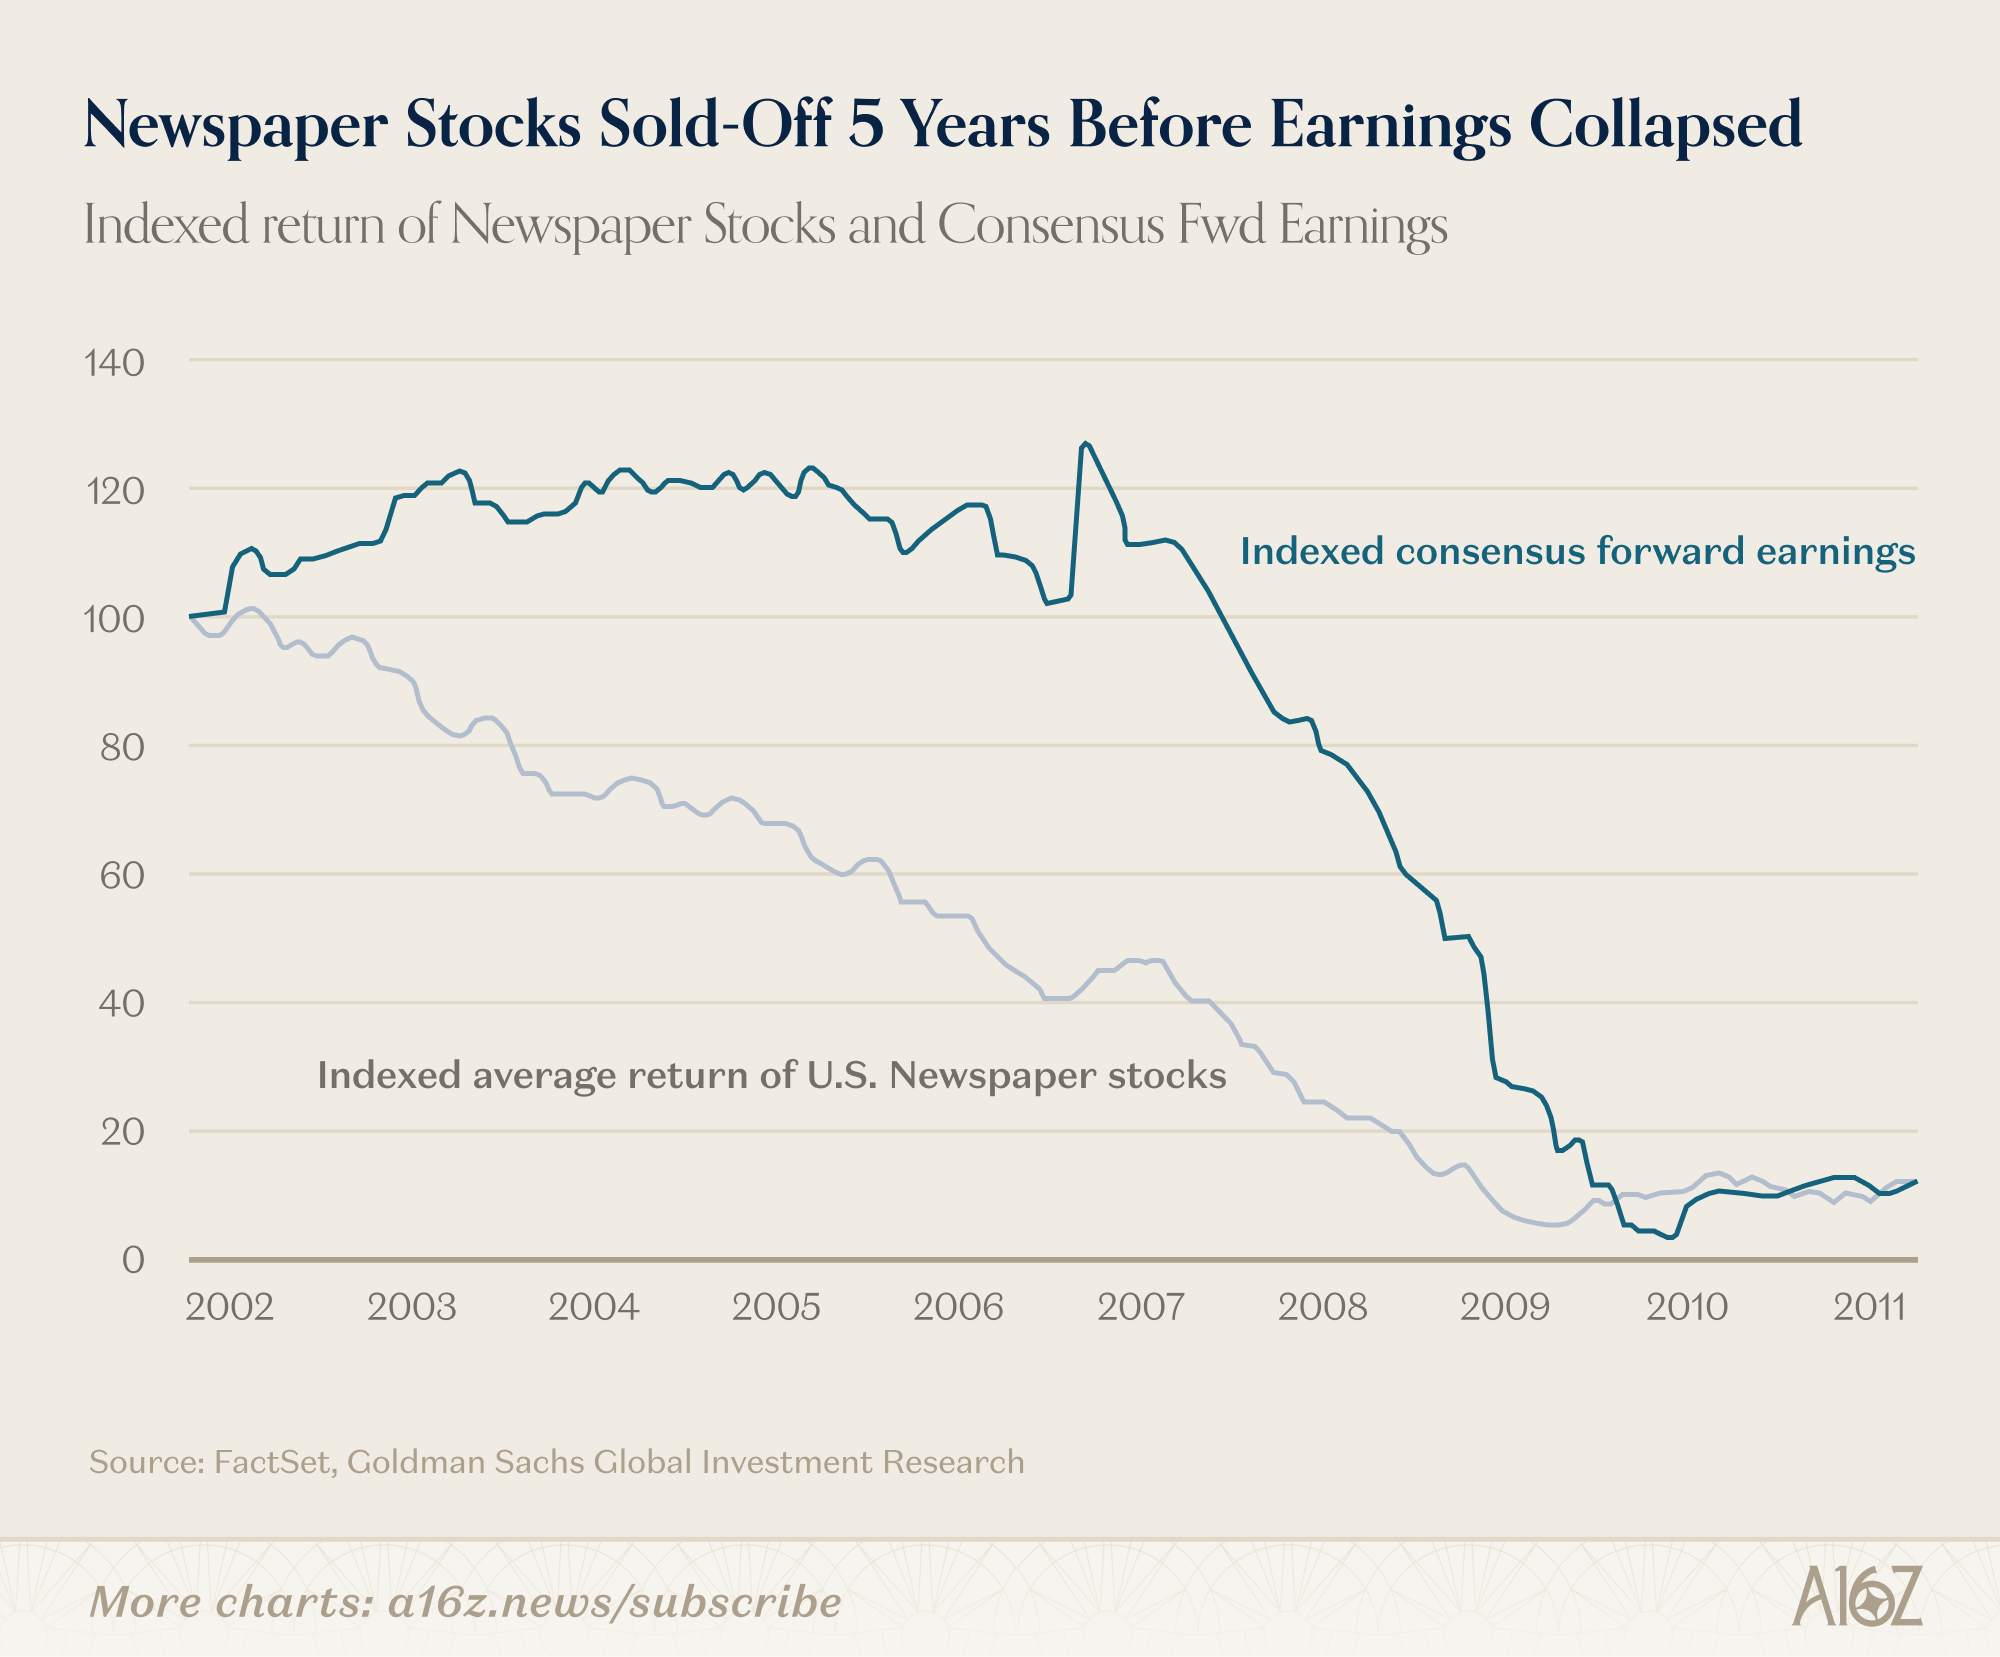
The point being that even if the evidence for the death of SaaS is a bit thin right now, investors are paid to have a view of the future, and the future is (in their view), a bit gloomy.
Gloom is not the outlook for all software companies, though. Again, differentiation and discernment is increasingly the name of the game. You can see it a few different ways.
First consider the gap between the median, top- and bottom-quartiles of the IGV’s performance:
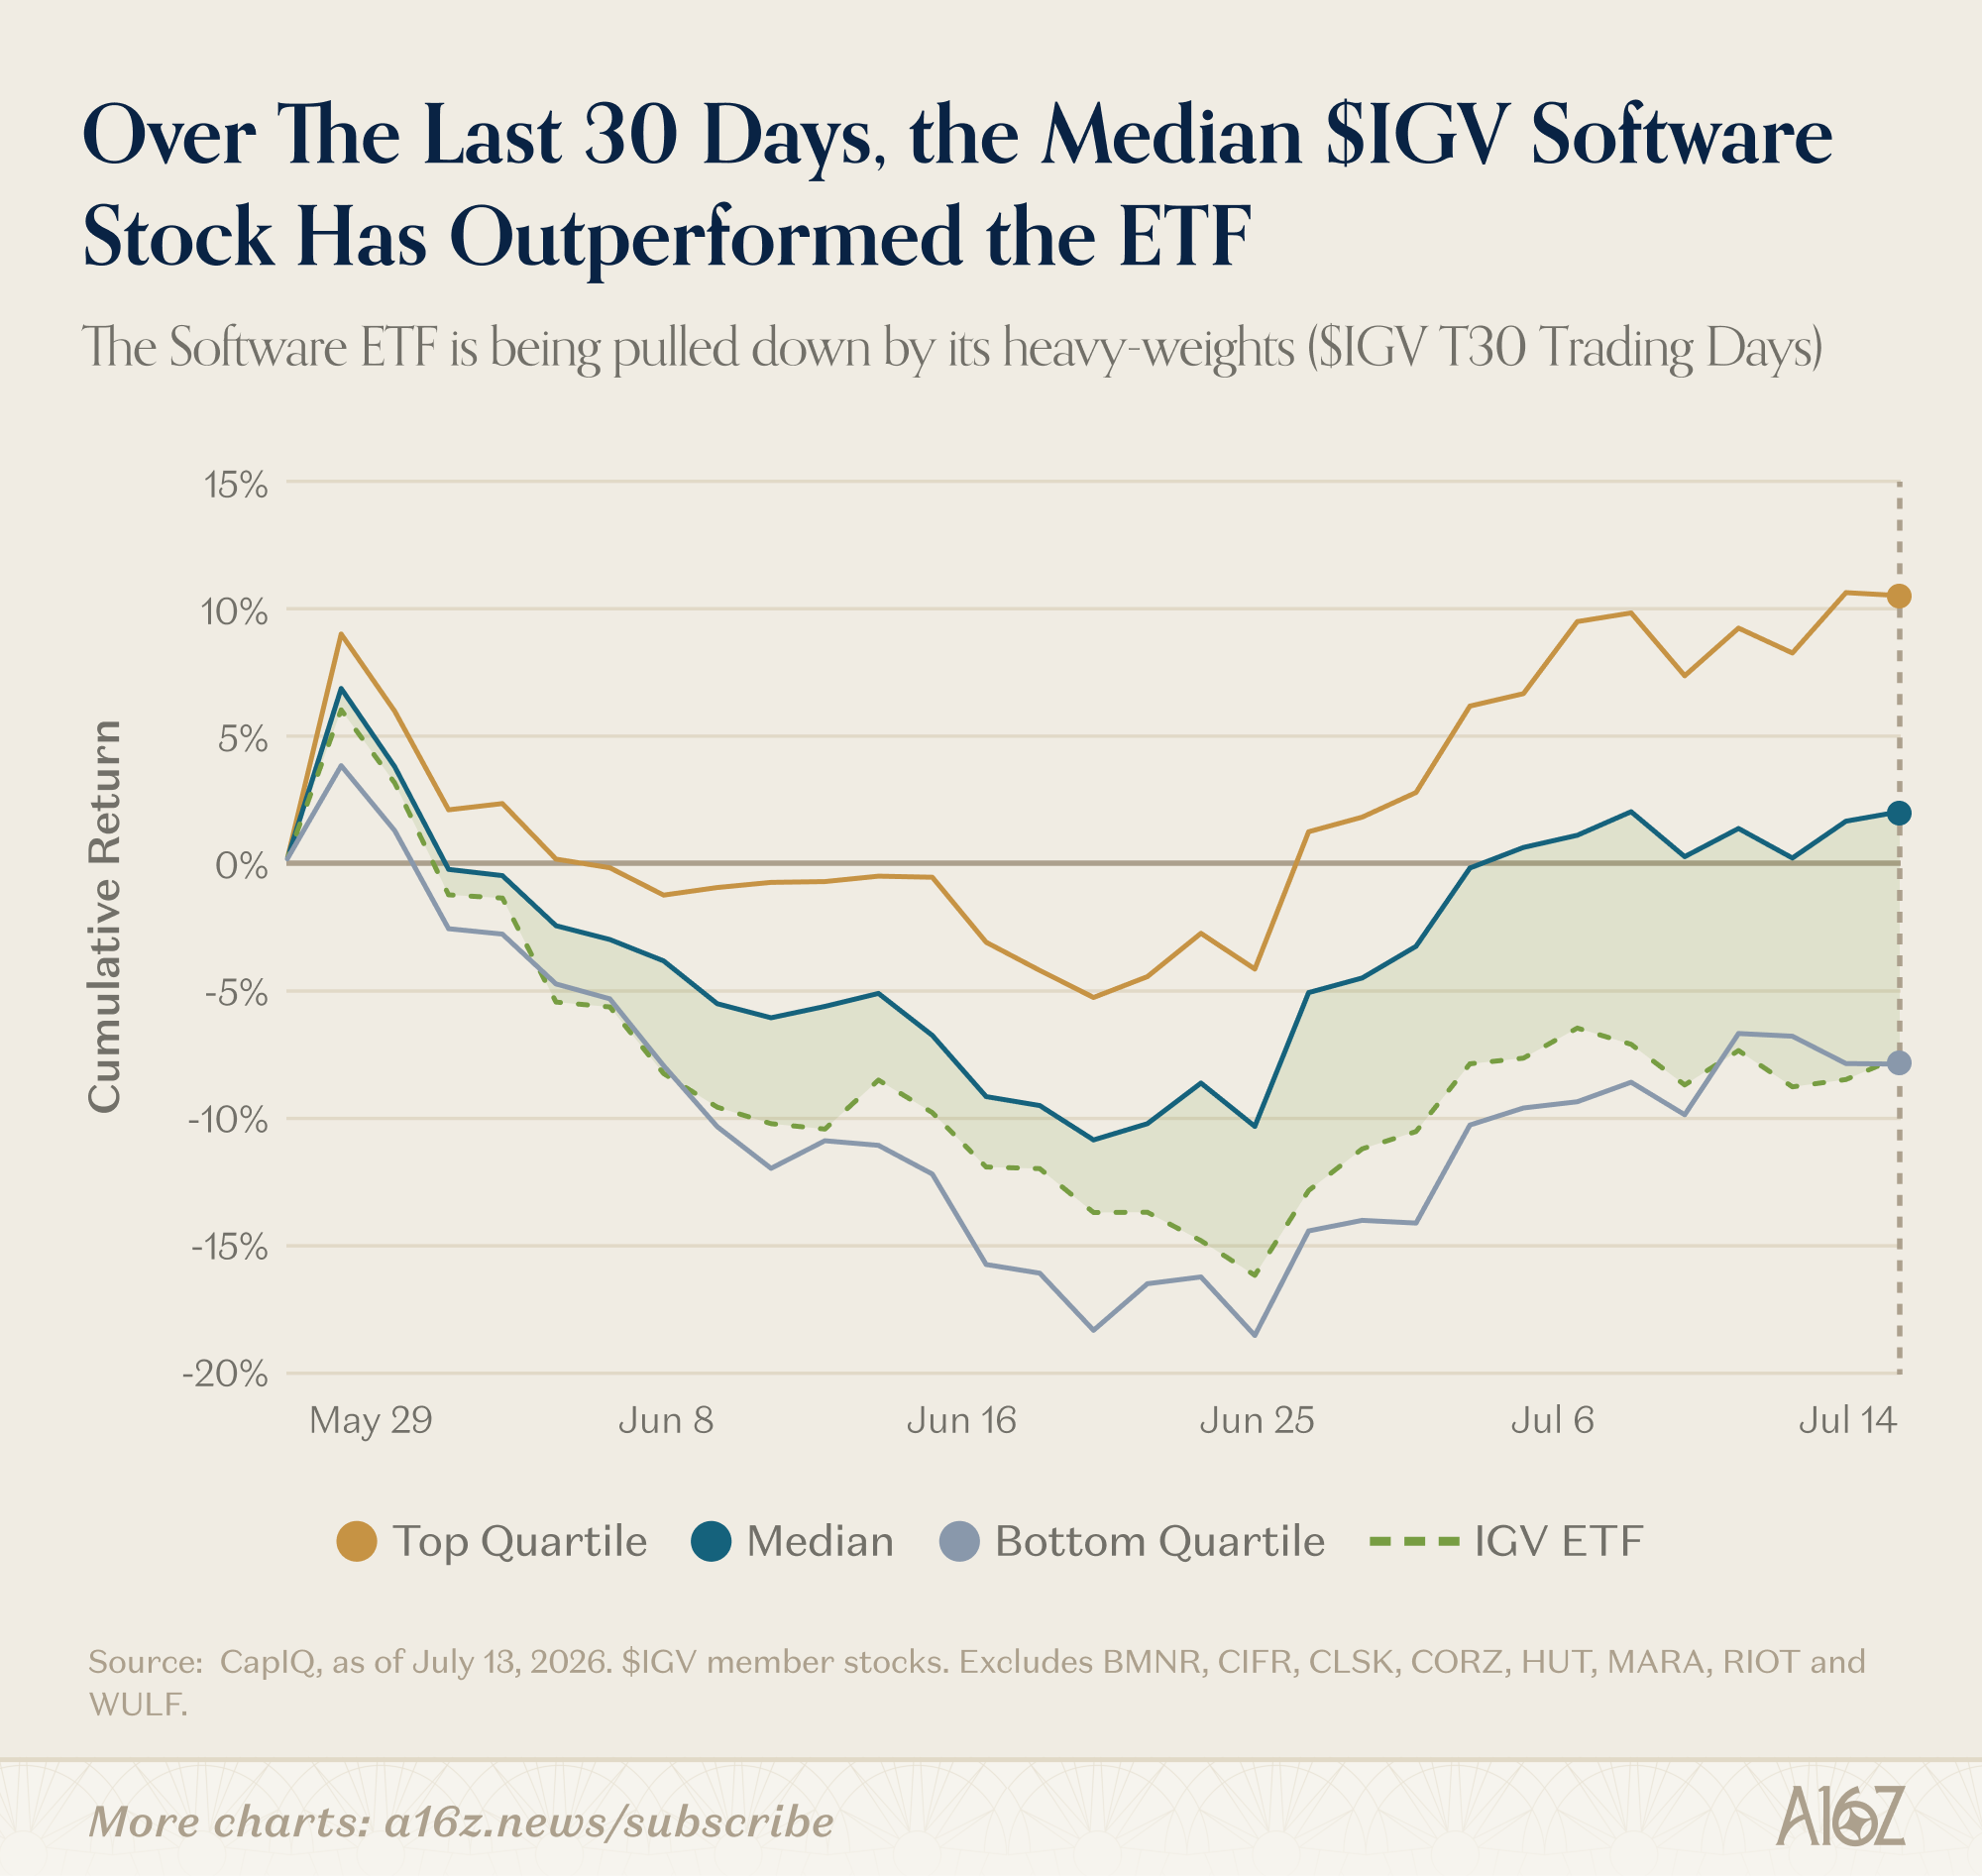
Over the last 30 trading days, both the top quartile and median IGV stock have outperformed the ETF as a whole—it’s the bottom quartile (which include some of the largest companies) that’s pulling down overall performance.
Compare that with a yearly lookback, and it’s mostly a different picture:
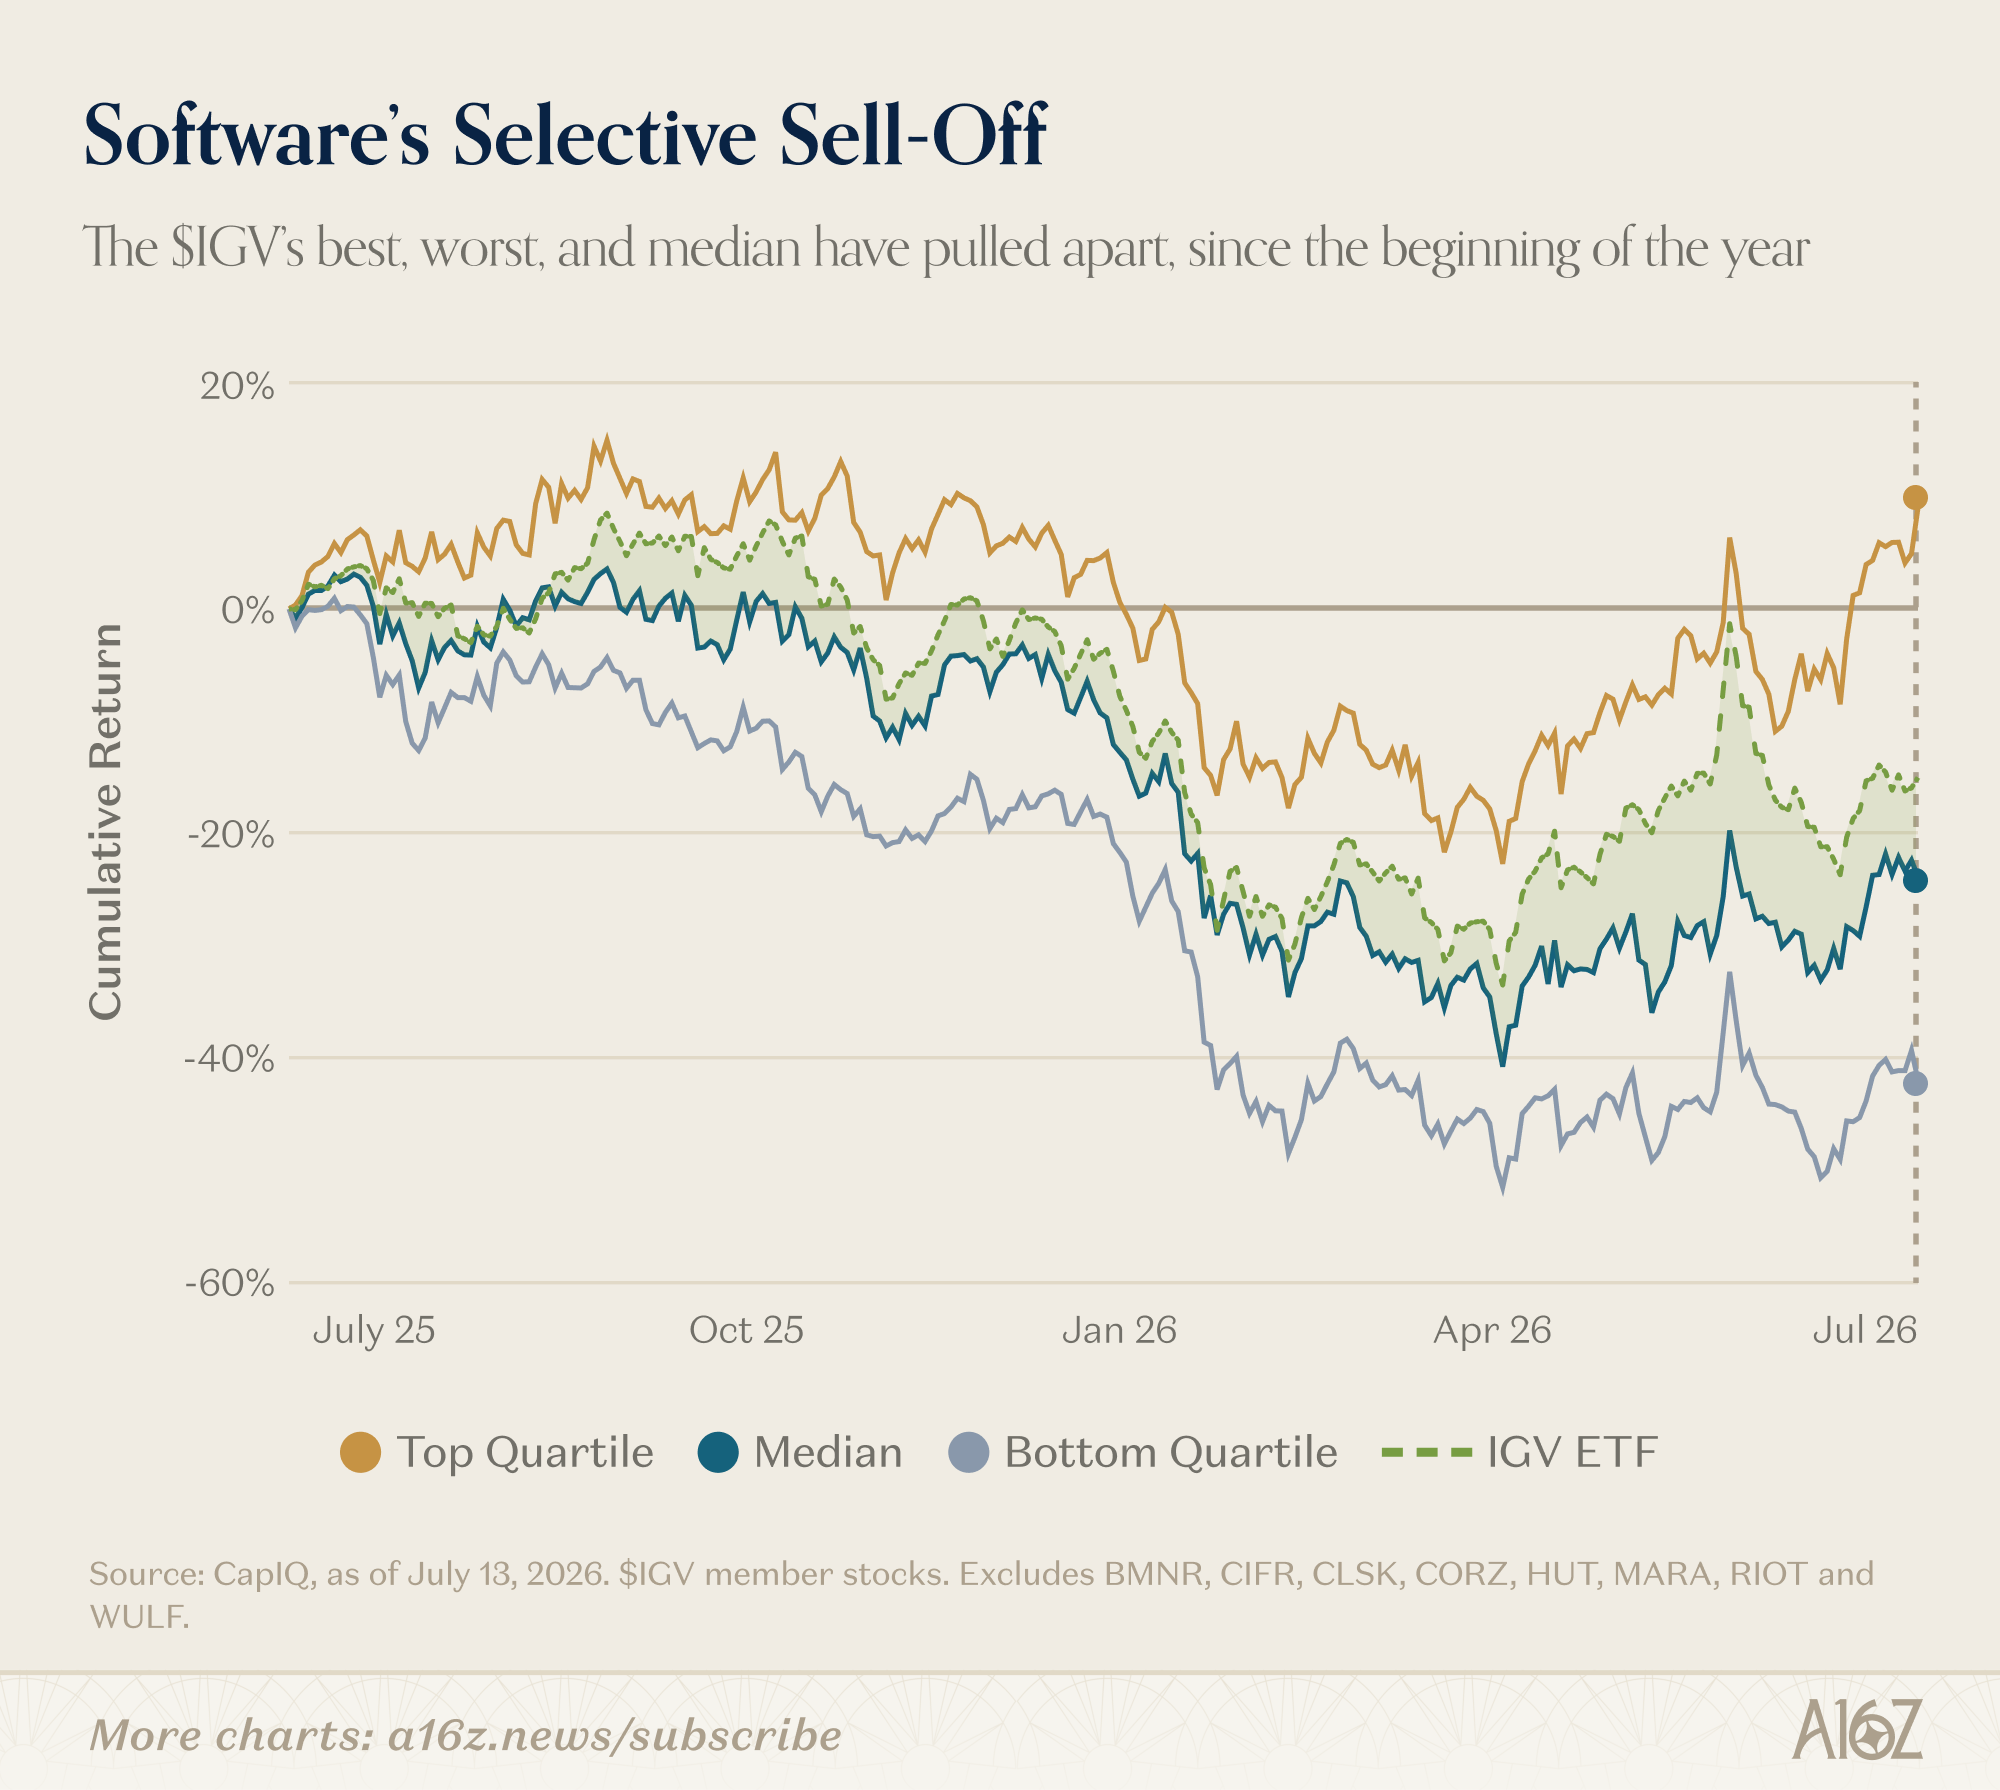
Over the past year, the median tracks the overall ETF much more closely—it was only around the turn of the calendar year that performance quartiles began to disperse (with now a ~50pp spread between the top and bottom).
Returning to the 30-day view, it’s also clear that fundamental performance is not strictly speaking the driver of recent stock performance:
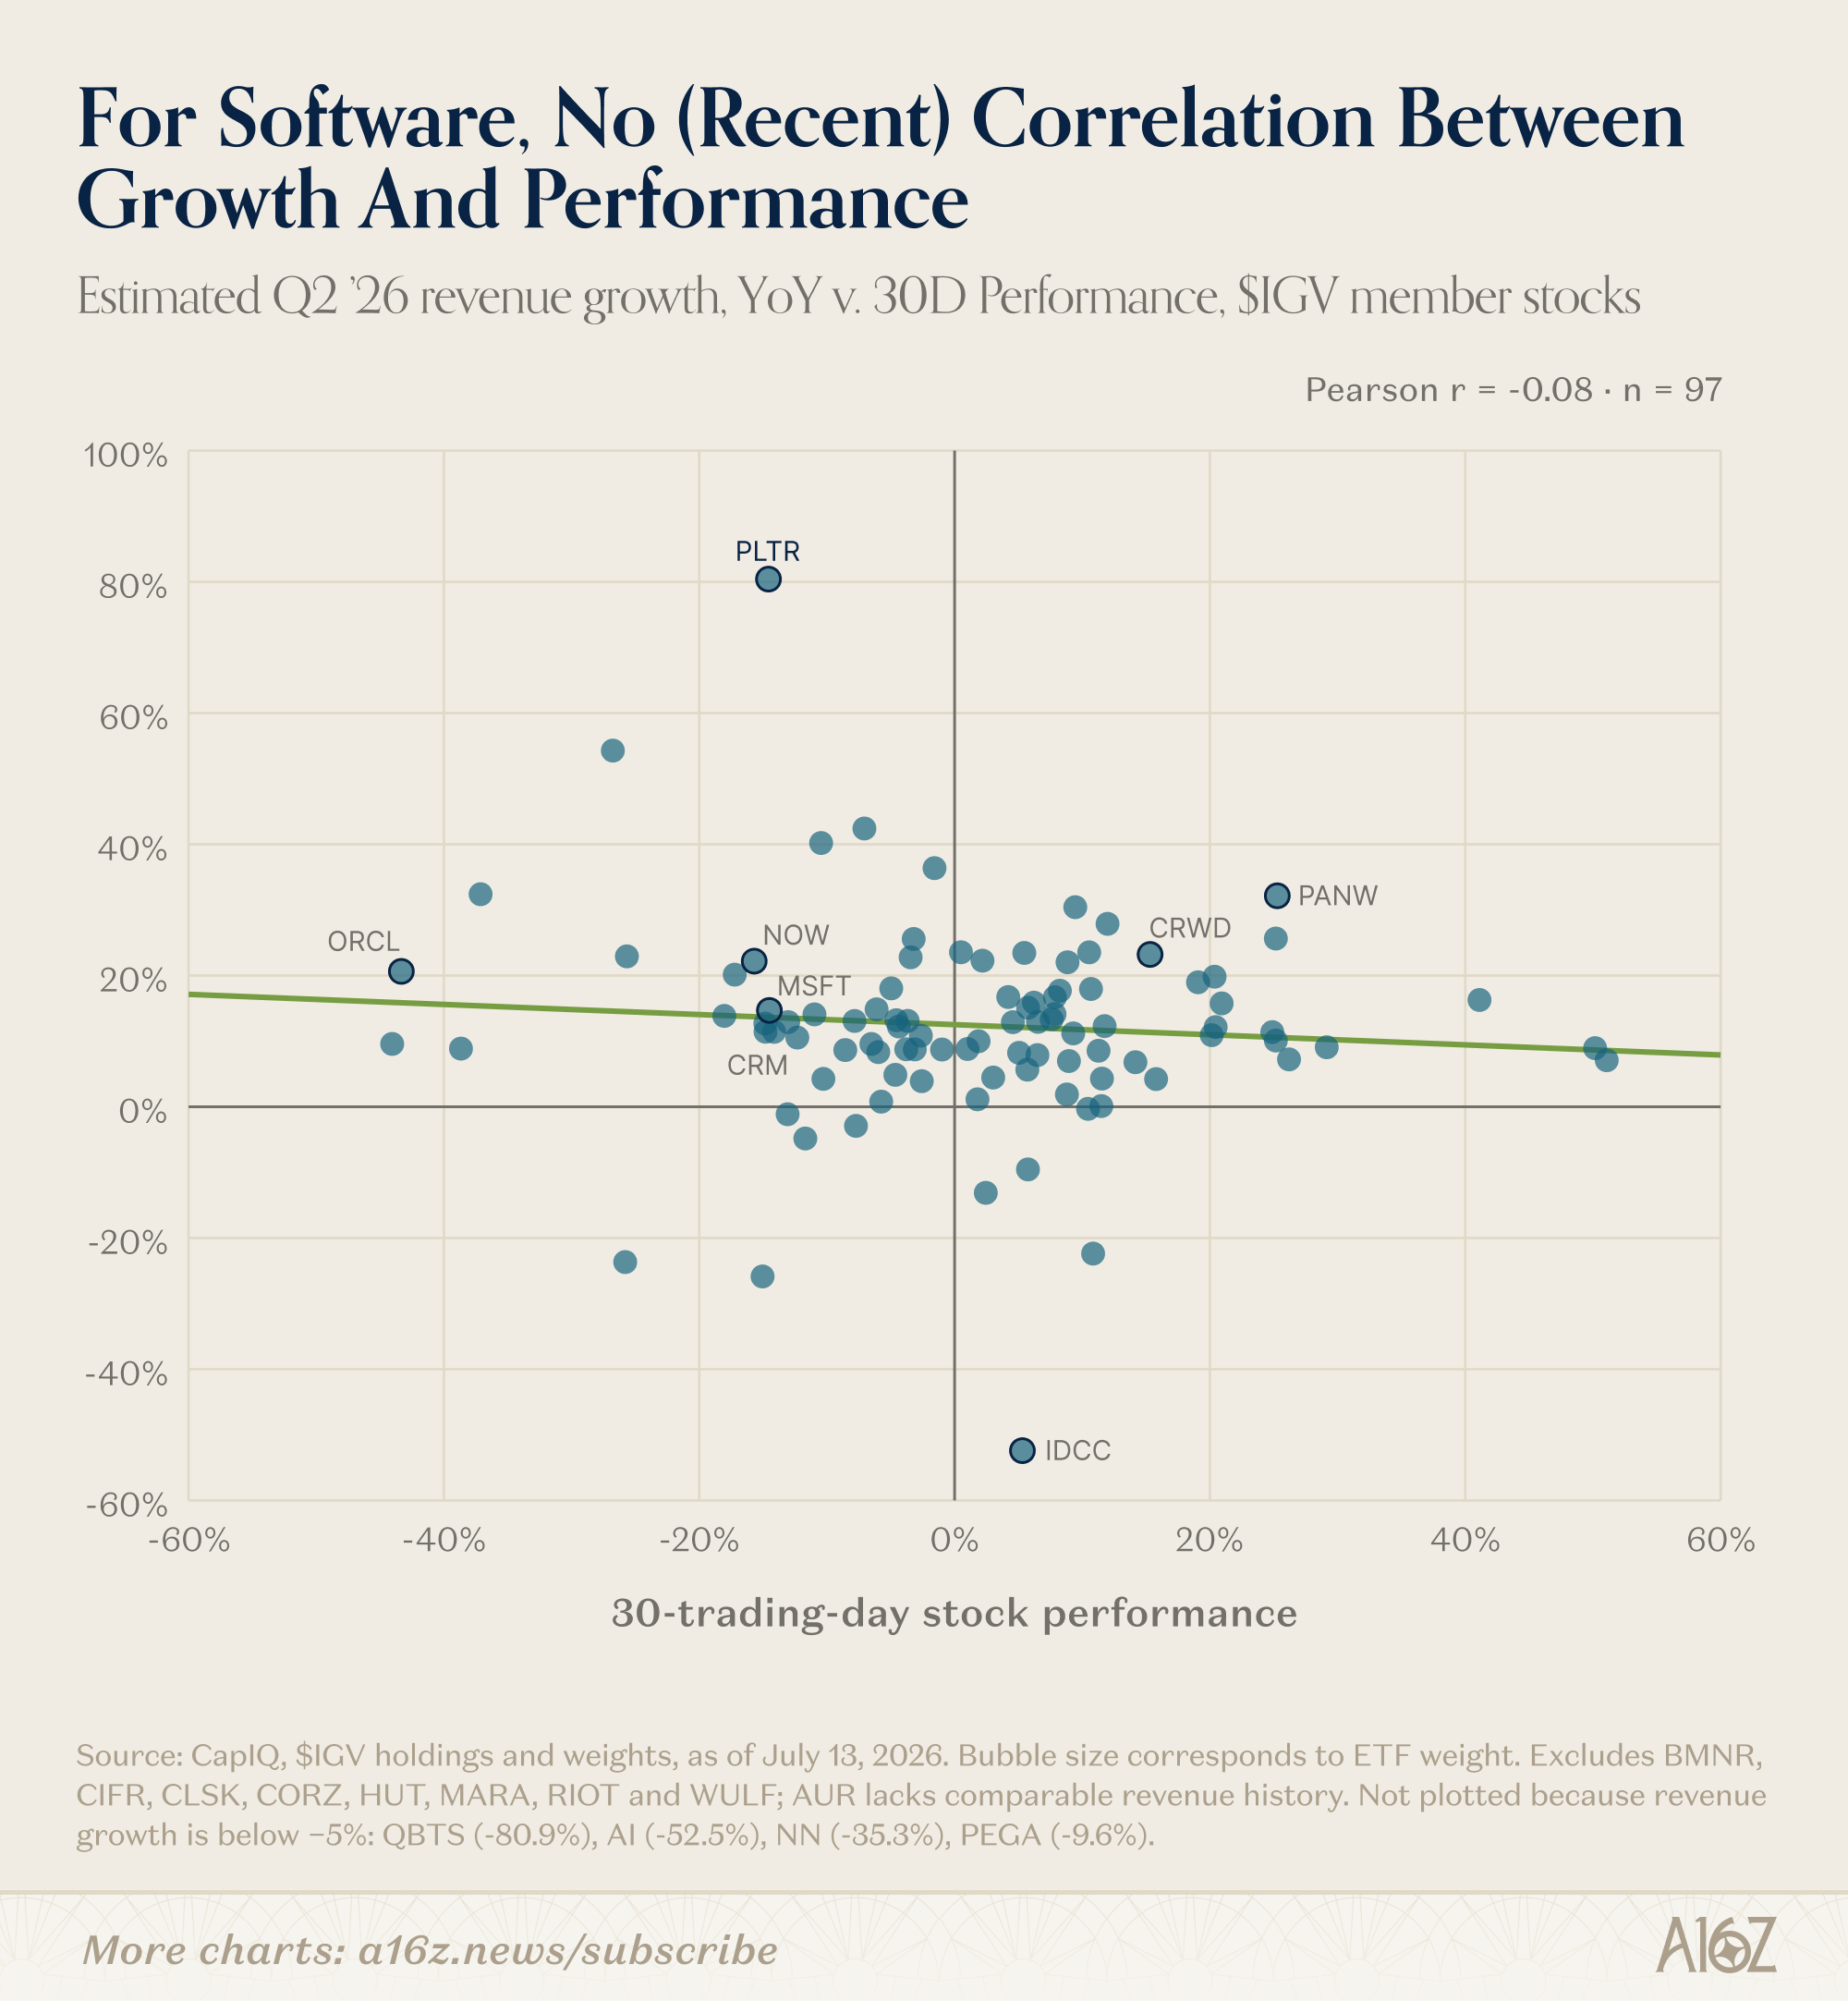
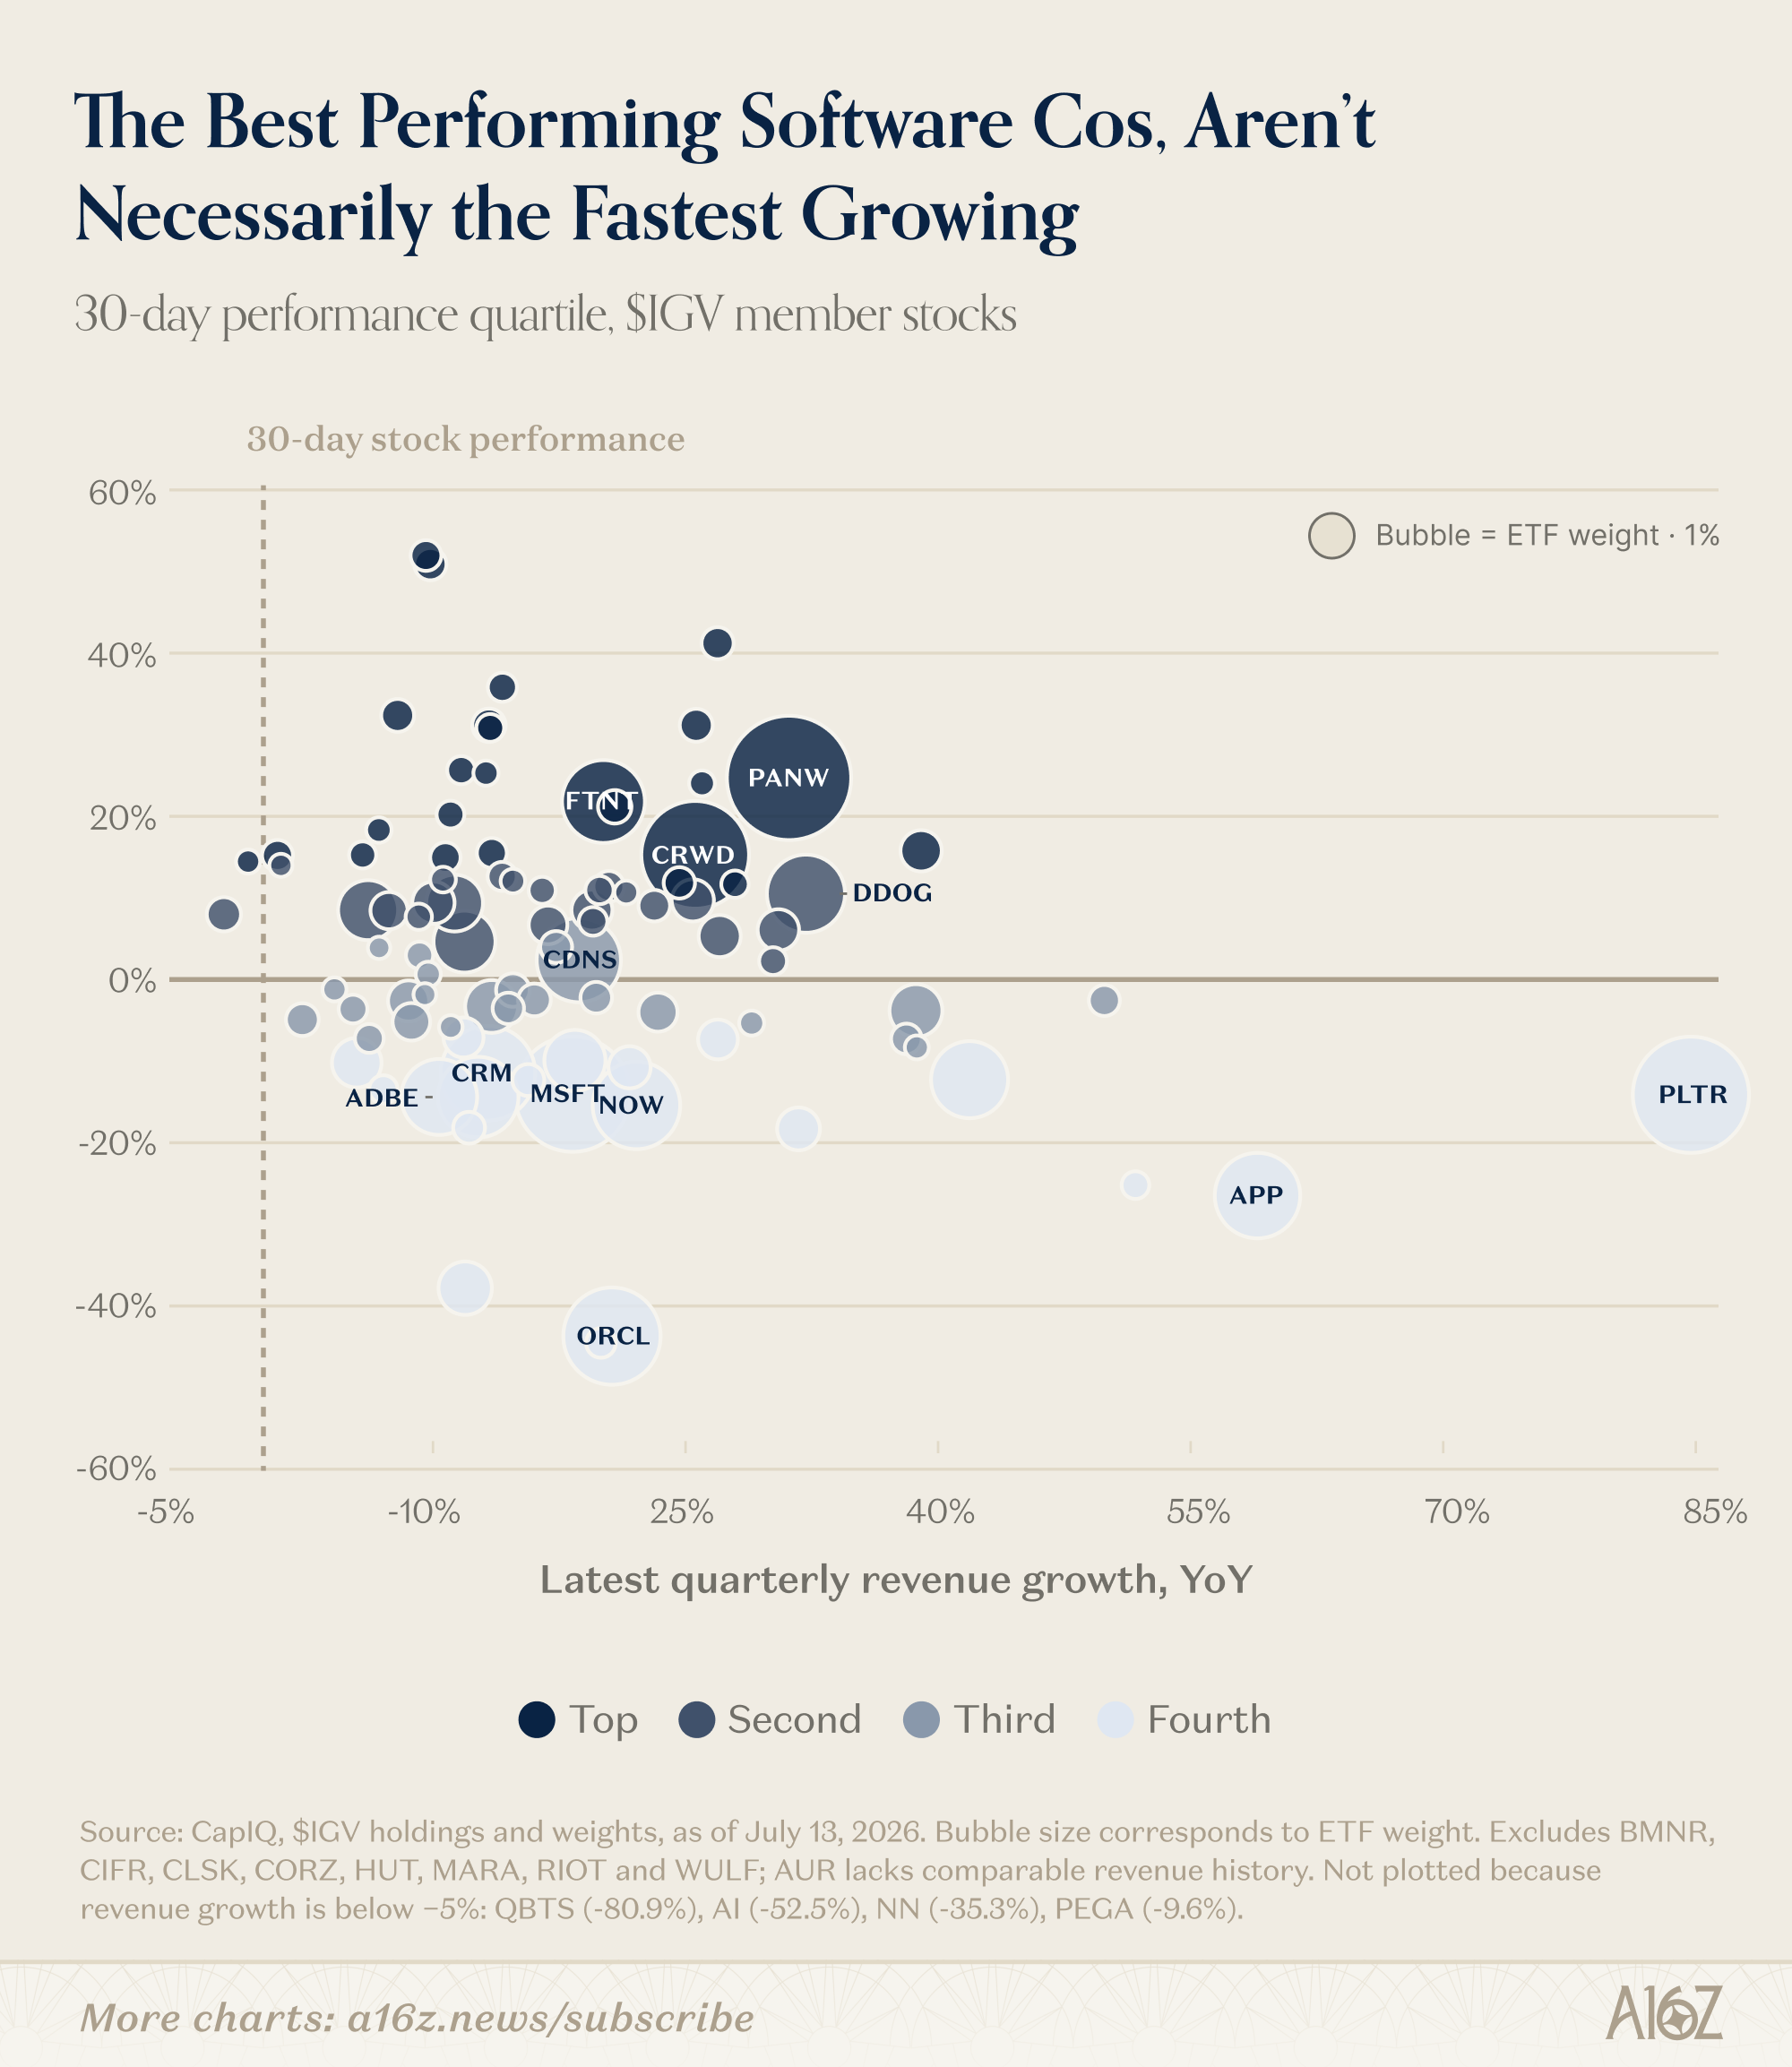
From a revenue growth perspective, there is basically no correlation between growth and recent performance (although, to be fair, a lot of that is explained by changes in growth, rather than levels). When broken out by performance quartile, the same pattern emerges: there are lots of software companies clustered in the high-teens low-twenties of revenue growth, but performance is stacked almost vertically, with some of the fastest topline growers (and largest companies in the ETF) in the bottom quartile of performance.
Rather than growth, what matters more is perceived longer-term durability. Here’s the same chart broken out by sector:
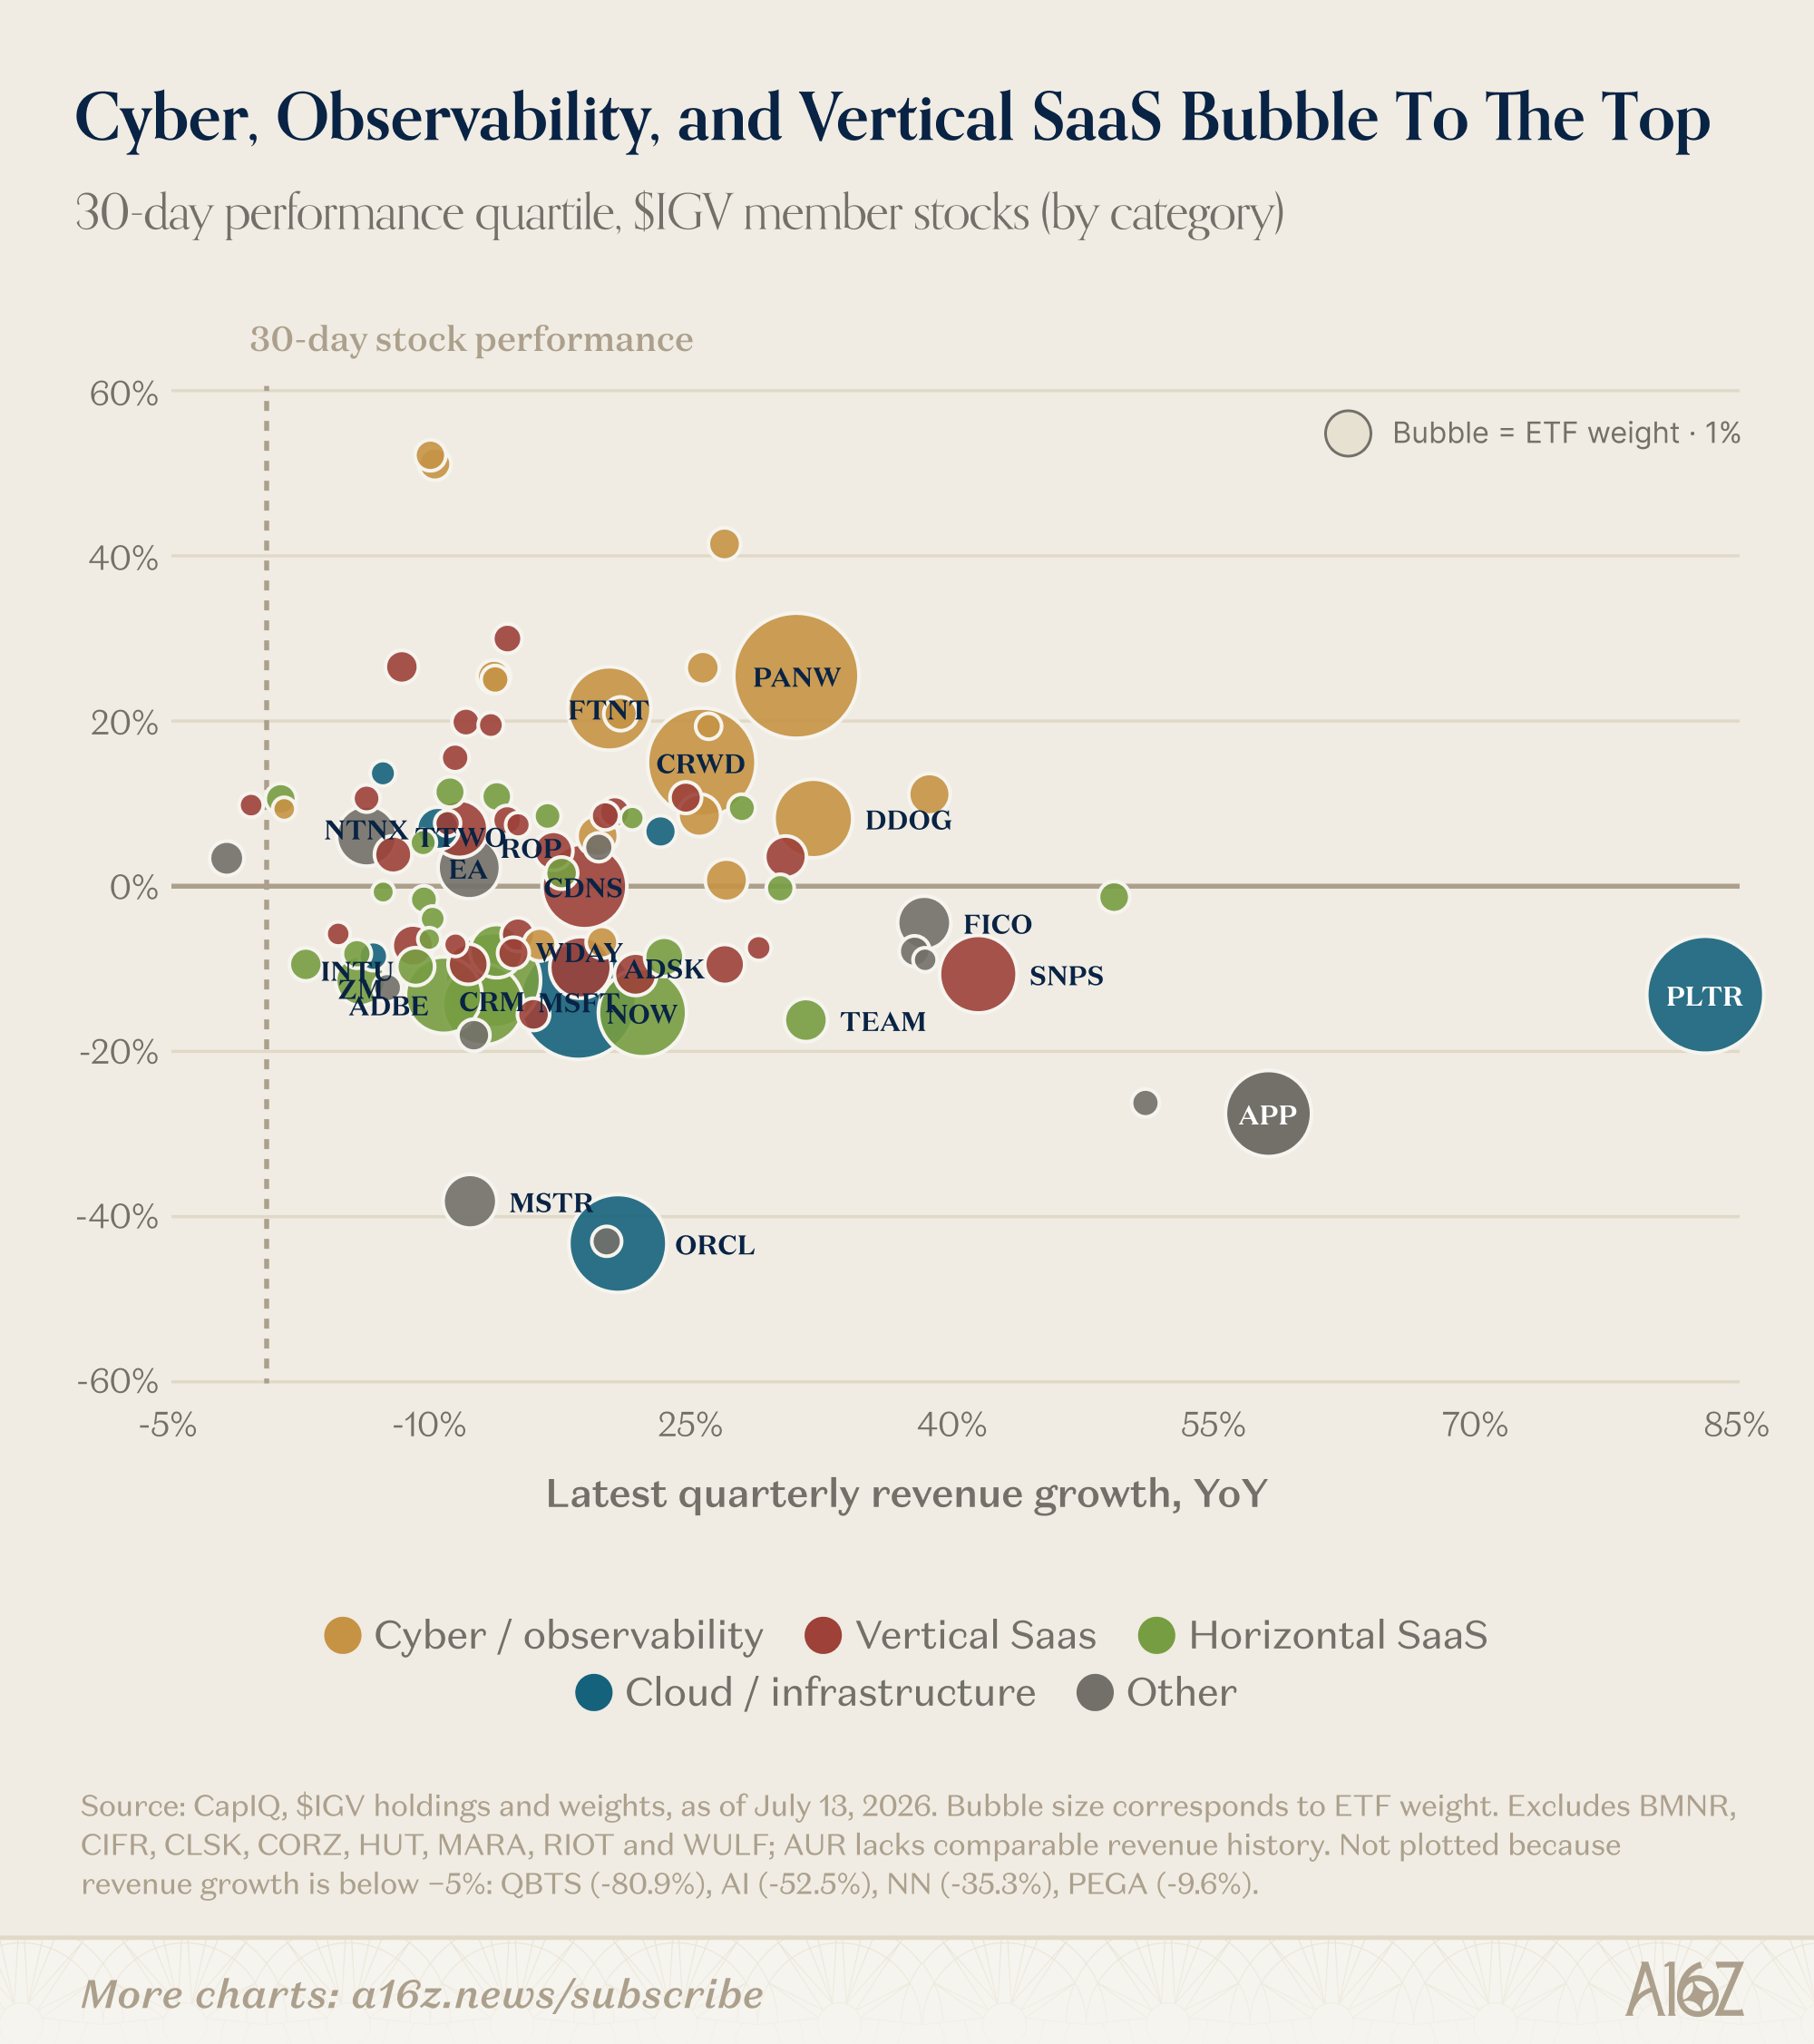
While it’s not so easy to cleanly categorize every company, the top and second quartile performers tend to be dominated by (1) cyber/observability; and (2) vertical SaaS. The bottom two quartiles, by contrast, are some combination of horizontal SaaS, cloud/infrastructure, and the “other” category, which includes marketplaces, ad tech, and point solutions (and whatever MicroStrategy happens to be).
The point here is pretty clear. Rightly or wrongly, the market has perceived a clear difference between software companies that seem to have some degree of AI defensibility and/or tailwind (and those that don’t).
For cyber and observability, AI is expected to increase buyer urgency (and incumbents have a trust premium that AI upstarts will find harder to disrupt).
For vertical SaaS, specialized information around workflows, data and customer relationships is considered a barrier-to-entry for AI challengers (while the same cannot be said of horizontal platforms).
For everyone else, though, the message is pretty clear: software alone is not a moat.
Years of sticky and accumulating ARR, huge feature-sets, and widespread adoption are just that—yesterday’s news. It very well may be that a few quarters of steady and/or improving growth will flip the script, but for now, the market is unimpressed and unconvinced.
AI Demand Growth > AI Spend Growth
You may have heard recently that there’s a perceived shift from token-maxxing to token-optimizing, and it’s a big deal.
The gist of it is as follows: while frontier models are increasingly expensive to train, the marginal benefits of those frontier improvements may not be enough to persuade customers to absorb the additional cost. Rather than maxxing out on the latest and greatest tokens, customers may instead downshift where they can to cheaper, less-powerful models (including open-weight models).
For some people, they see that shift as calling into question the sustainability of frontier model development—if customers won’t support the cost of the latest and greatest, then how can the labs? Fair enough, although the objection is somewhat ironic, if only because the supposedly rapid obsolescence of non-frontier models was also supposed to threaten the sustainability of frontier model development . . . and now that non-frontier models are increasingly not-obsolete, that’s still apparently a bad thing. OK, alright.
Without getting too far into the merits of that debate, we’re only here to observe that it is indeed true that the cost of intelligence is falling rapidly, and that it appears to have positive implications for AI demand. In other words, the Jevons-ish dynamic continues to hold: the cheaper AI gets, the more people/firms want to use it (for more things).
Increasing the surface area for demand is exactly what you want to see.
Let’s start with some precedent from another innovation that started concentrated and expensive, but became diffuse and cheap: computers. In comparison to the previous tech-leap forward driven by PCs, when it comes to AI, the cost of intelligence is dropping much more quickly:
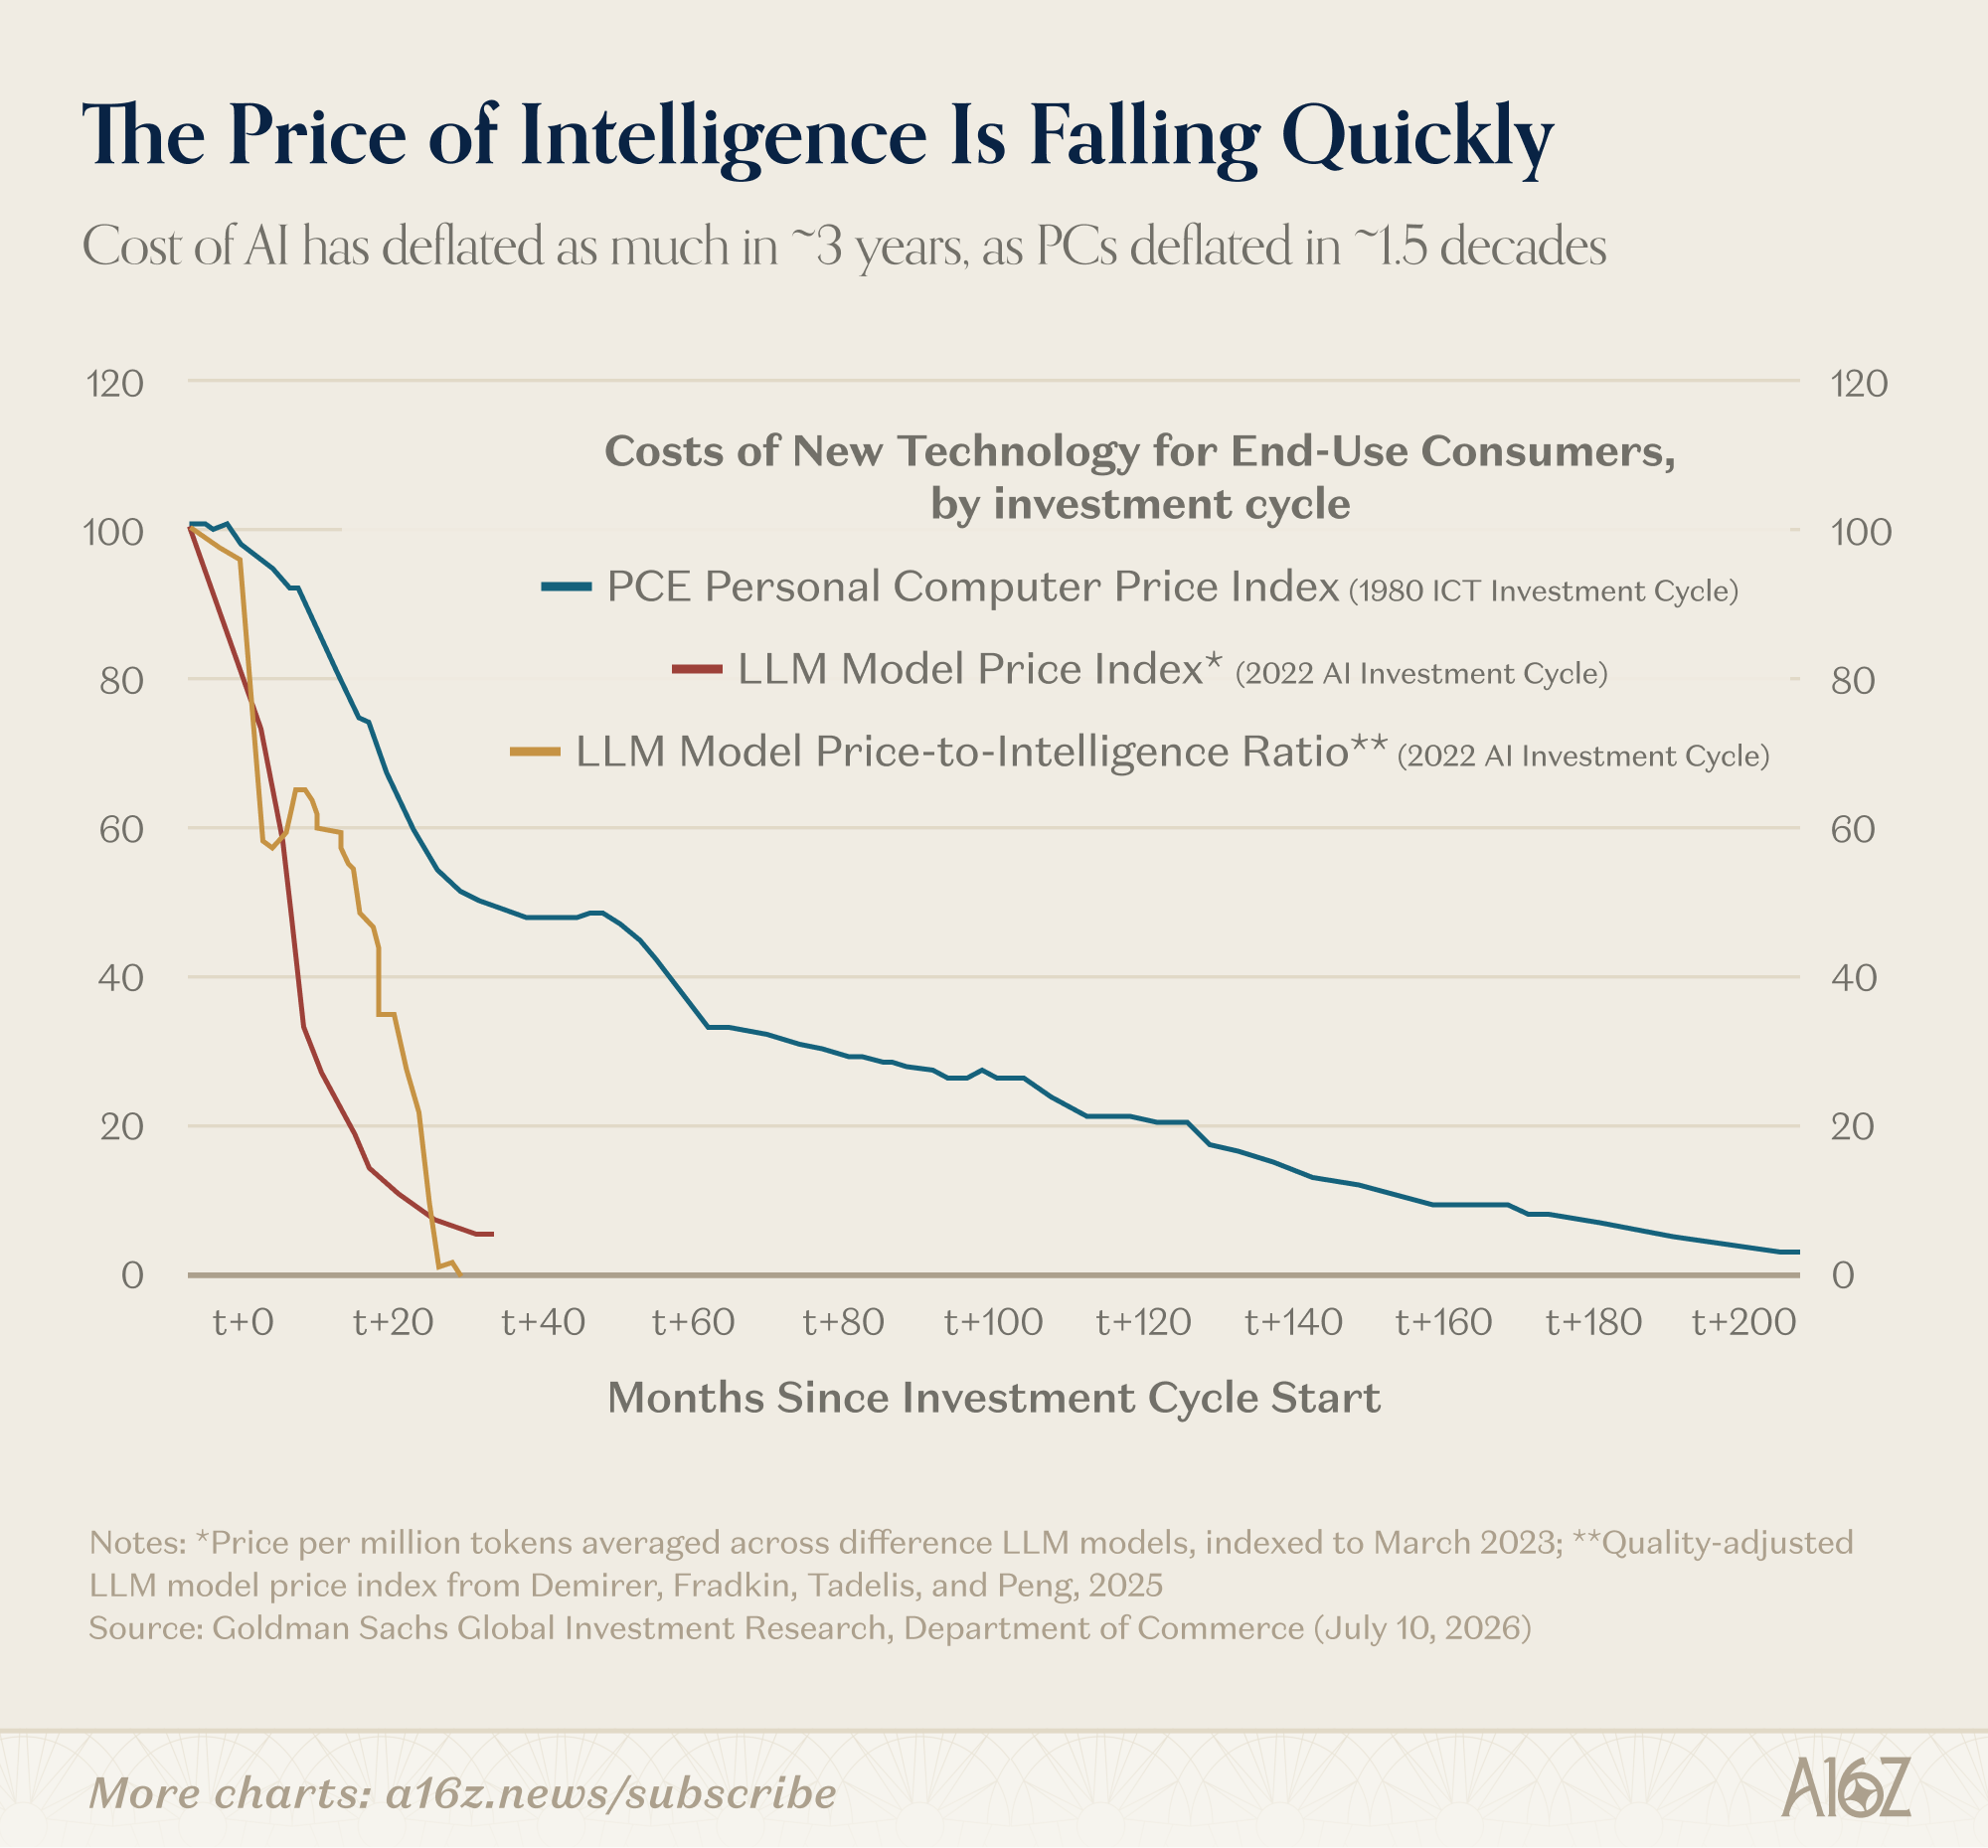
It took PCs almost two decades to achieve the affordability gains that AI has achieved in ~3 years.
That’s a remarkable trajectory, and as with computers, it seems like falling costs are helping push AI demand up-and-to-the-right (with a lot more runway to go).
On the consumer side, according to data from PNC Bank, paid penetration is still tiny, but definitely growing:
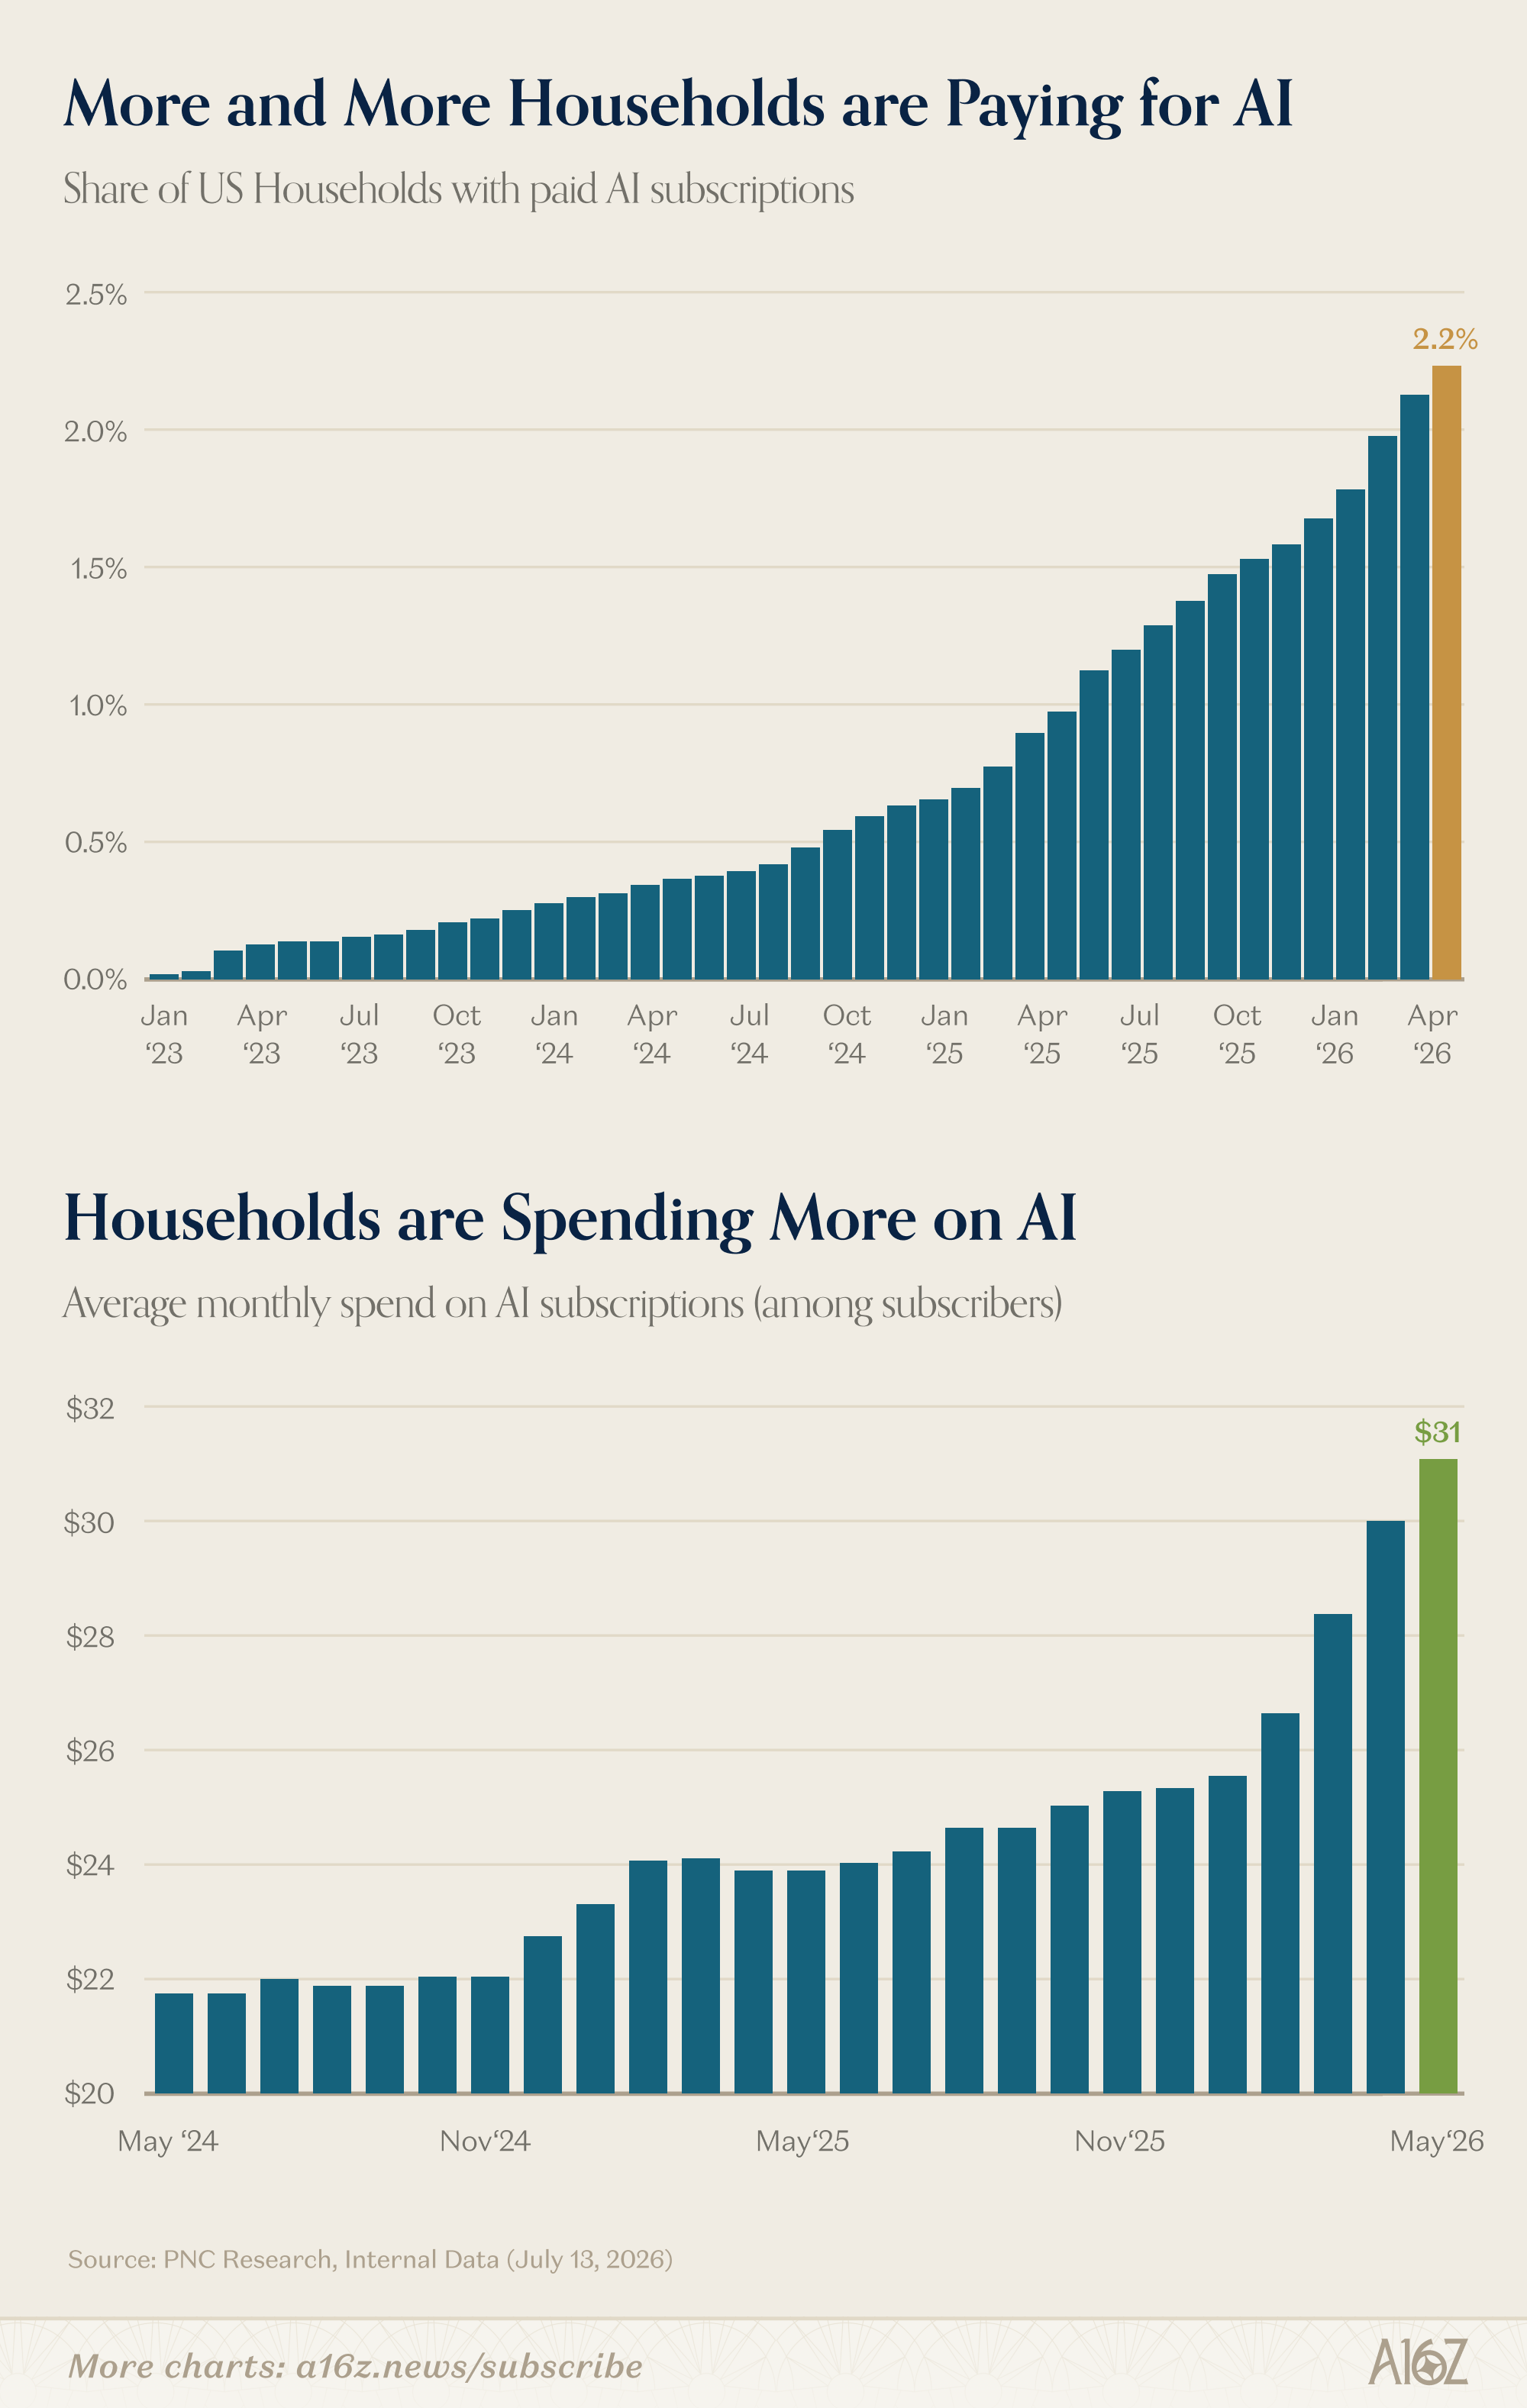
Both the share of households paying for AI, and their average monthly spend, continue to climb—monthly spend has increased even more steeply, rising ~25% since the beginning of the year.
They’re obviously not perfect comparisons, but for some perspective, in 1997 only ~45% of adults aged 35-54 reported owning a PC (decades after computers had been released for commercial use, mostly on the enterprise side). Currently, the share of households with a computer is ~90%, and closer to 97%, if you include smartphones—the point being that mass market adoption can take some time, and it scales with both utility and cost.


There are, of course, no free versions of PCs (as there are with LLMs), but at only 2.2% paid household penetration (and with bang-for-the-buck increasing exponentially), it seems reasonable to assume that wider consumer adoption still has a ways to go—even as the average price point rises, albeit not as quickly as intelligence.
There’s other data, as well, that shows demand for AI rising in tandem with cost-efficiency.
According to YipitData’s analysis of OpenRouter data (which measures only a subset of overall token consumption), frontier token usage continues to grow, at the same time as open-weight tokens continue to rapidly gain share:
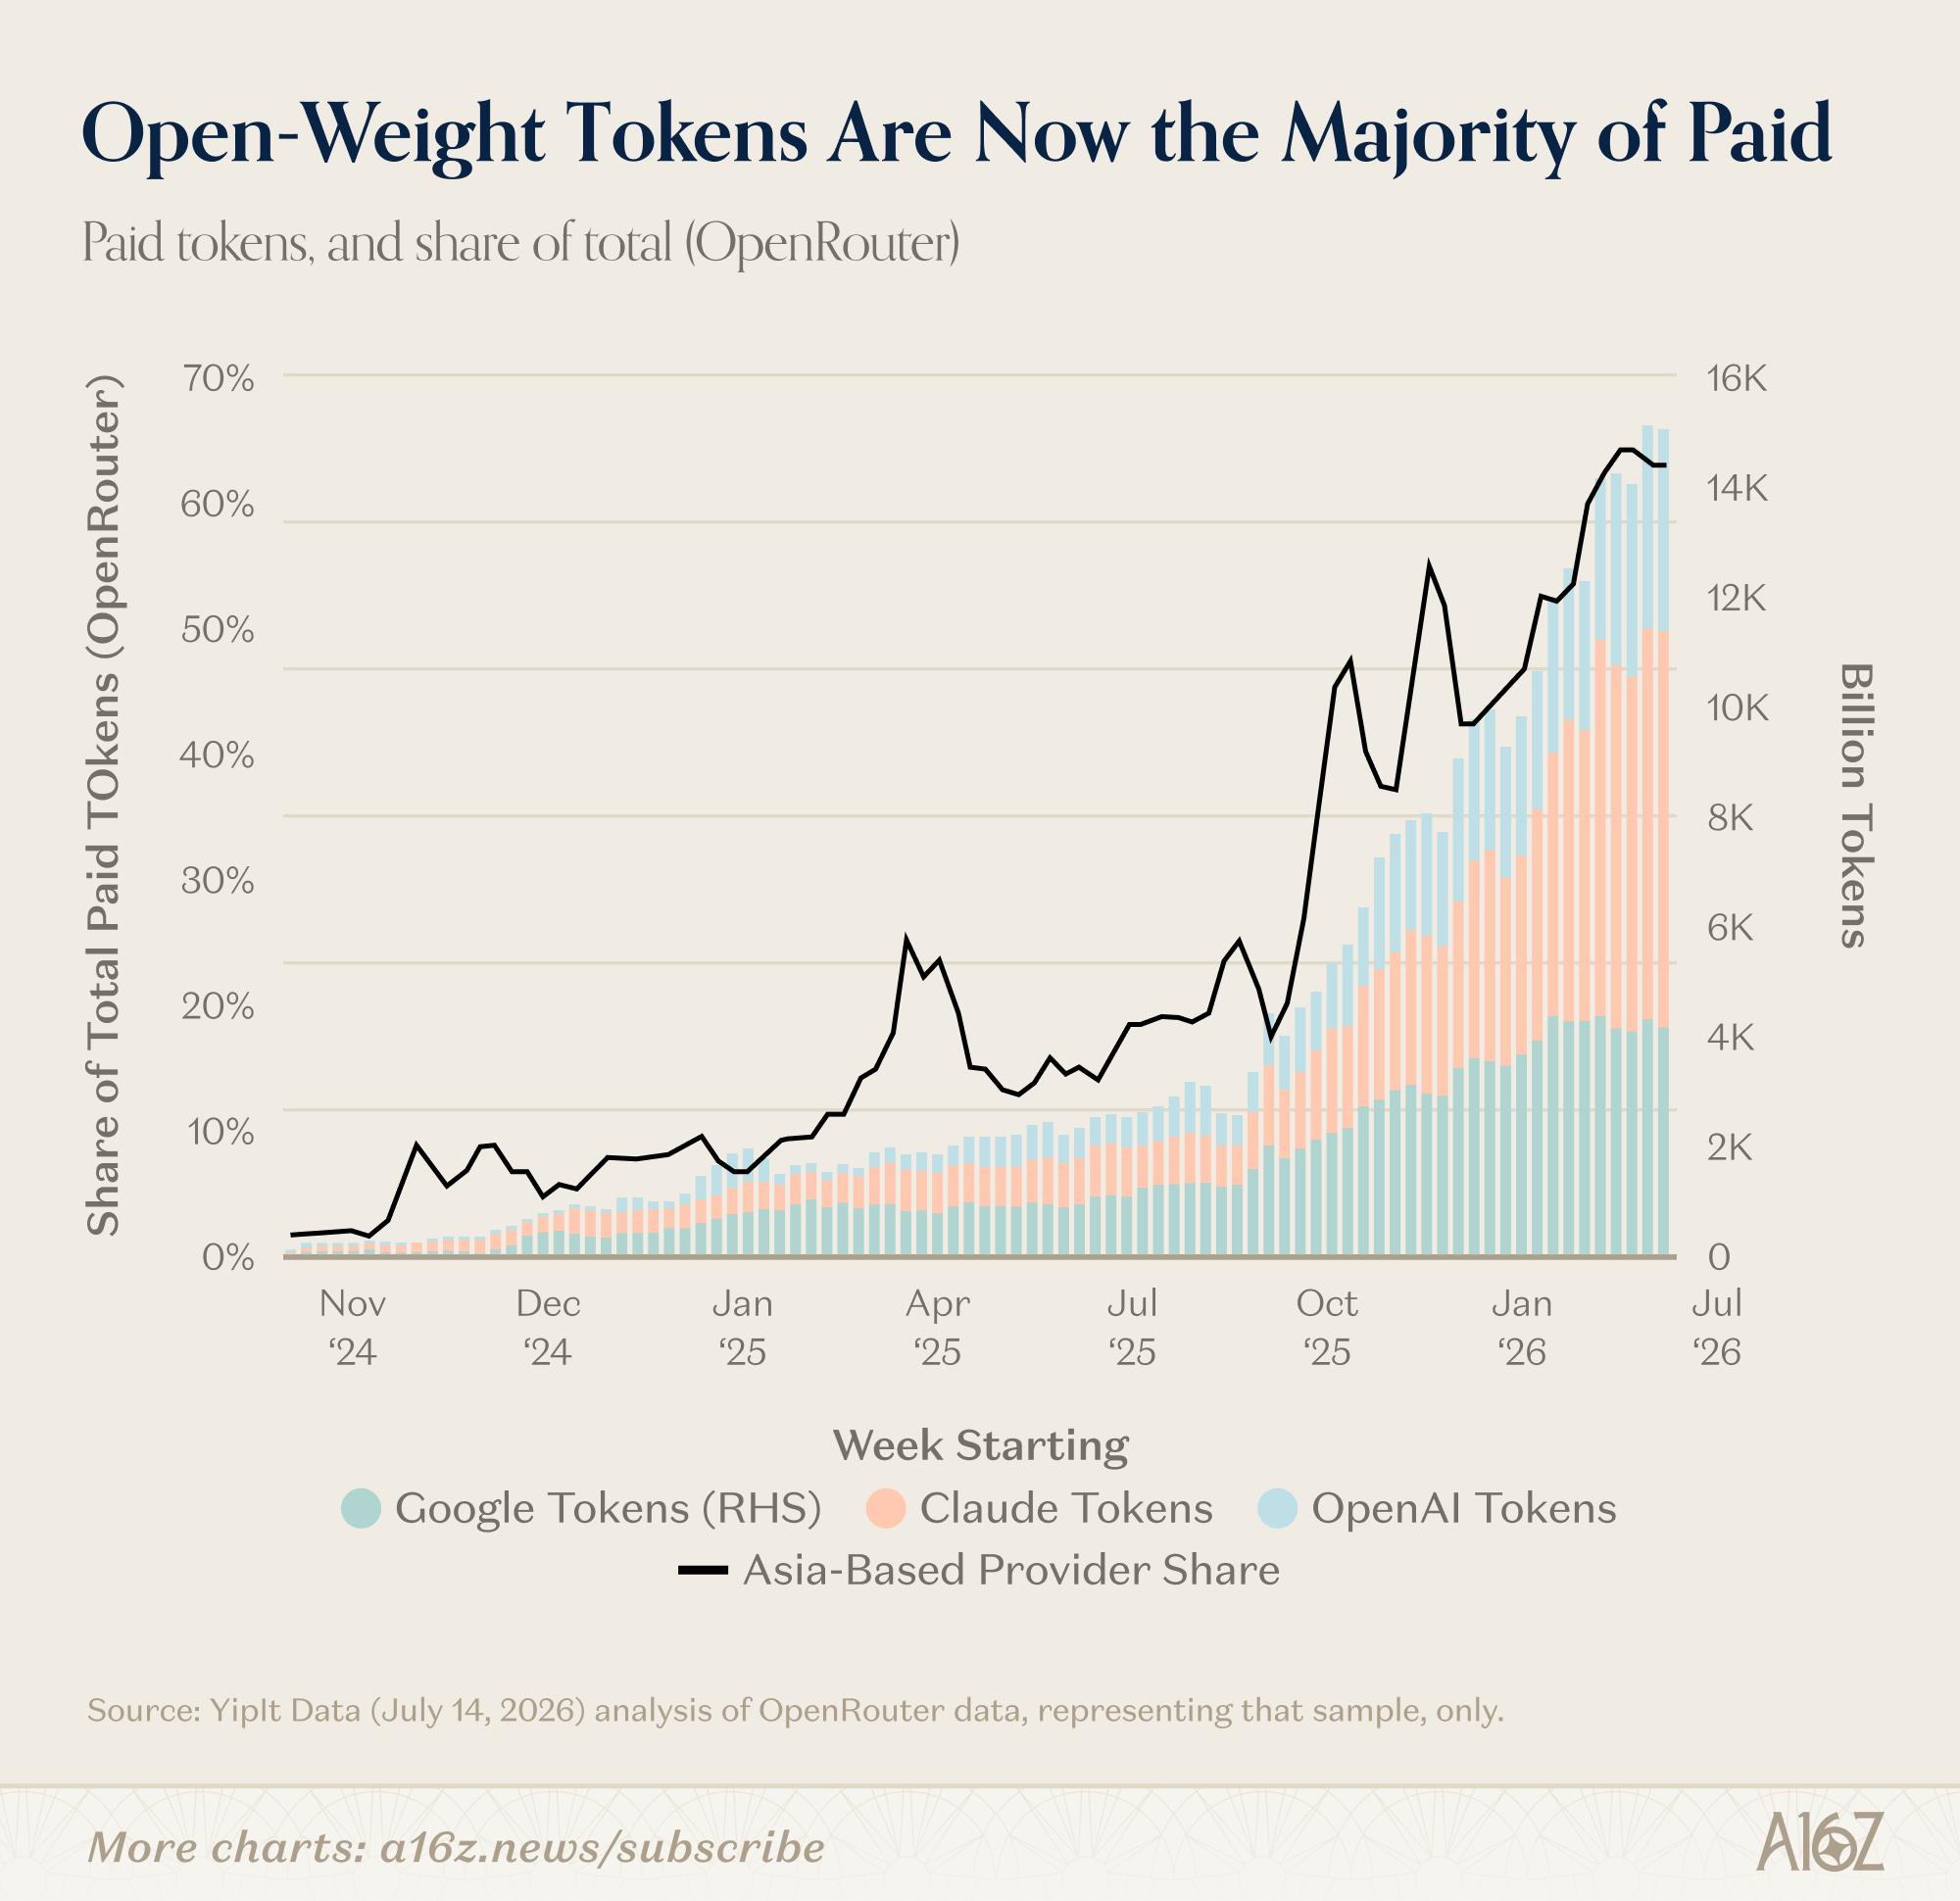
The “Asia-based provider” share of total tokens, which is a proxy for open-weight alternatives, has grown to ~60%, a three-fold increase from the beginning of the year. OpenRouter’s sample is probably at least somewhat biased towards open-weight users, but that’s certainly consistent with the price-differentiation story, and a Jevons-ish one, as well.
Similarly, according to OpenRouter, while both tokens-per-user and spend-per-user are growing quickly, the former is growing much more quickly than the latter, since the beginning of the year:
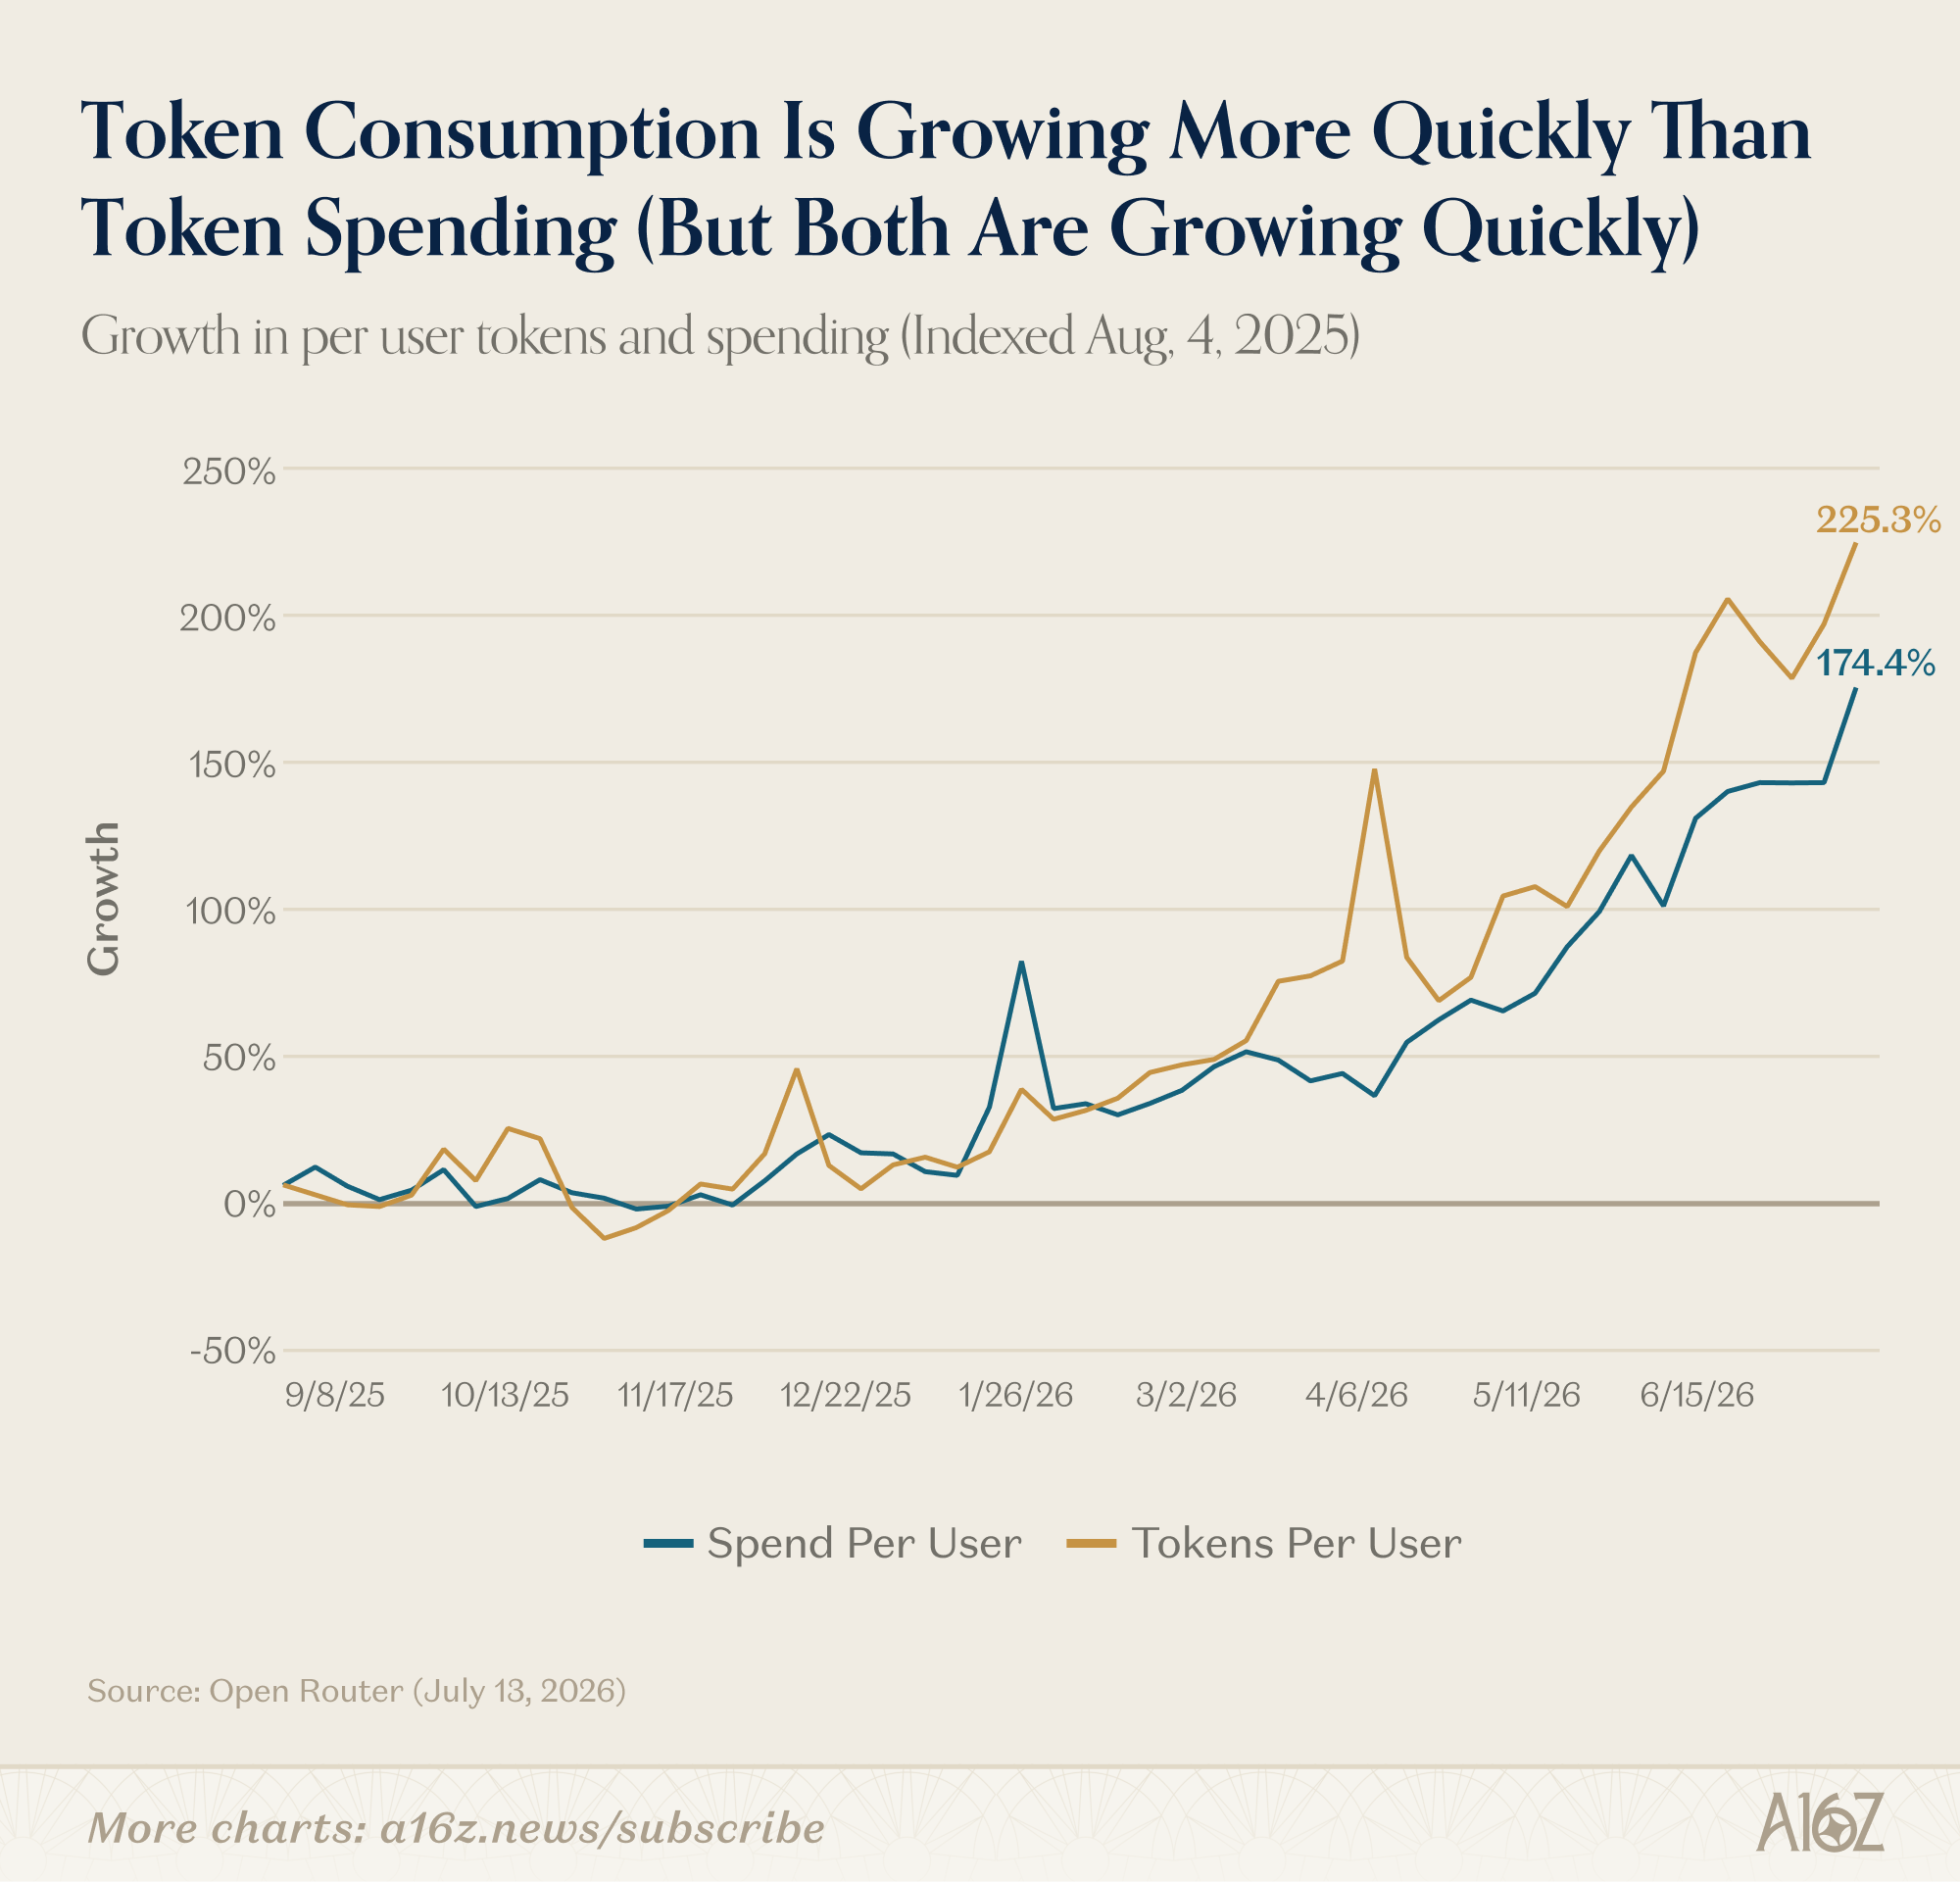
Again, with the caveat that OpenRouter only sees what it can see, this pattern is pretty consistent with a Jevons setup (where demand grows concurrently with the rapid cost-efficiency gains of AI).
For now, at least, it seems pretty clear that as intelligence gets cheaper, it pushes the demand curve even further up-and-to-the-right. Cheaper tokens from sub-frontier models have certainly gained share, but the net-effect has been to drive overall spending exponentially upwards. That’s hardly a doomer story.
Doomers might still claim that open-weight models are cannibalizing the frontier, but the alternative scenario where efficiency gains had no apparent effect on demand and/or were driving aggregate spending down, would actually be much closer to a doomsday scenario. Jevons, by contrast, is exactly what the bulls are hoping for.
Entry-level Tailwinds
On the subject of AI demand, while AI is supposedly not useful enough to generate meaningful ROI, but also so useful as to eliminate all the jobs, we’re pleased to report that there continues to be little to no evidence that AI is, in fact, having much if any job-killing effect.
Indeed, even the one soft-spot in the labor market (i.e. entry-level hiring) has some recent wind in its sails, and if anything, AI appears to be helping, far more than hurting.
First, as per Revelio’s data, summer internships for 2026 are tracking much higher than years prior:
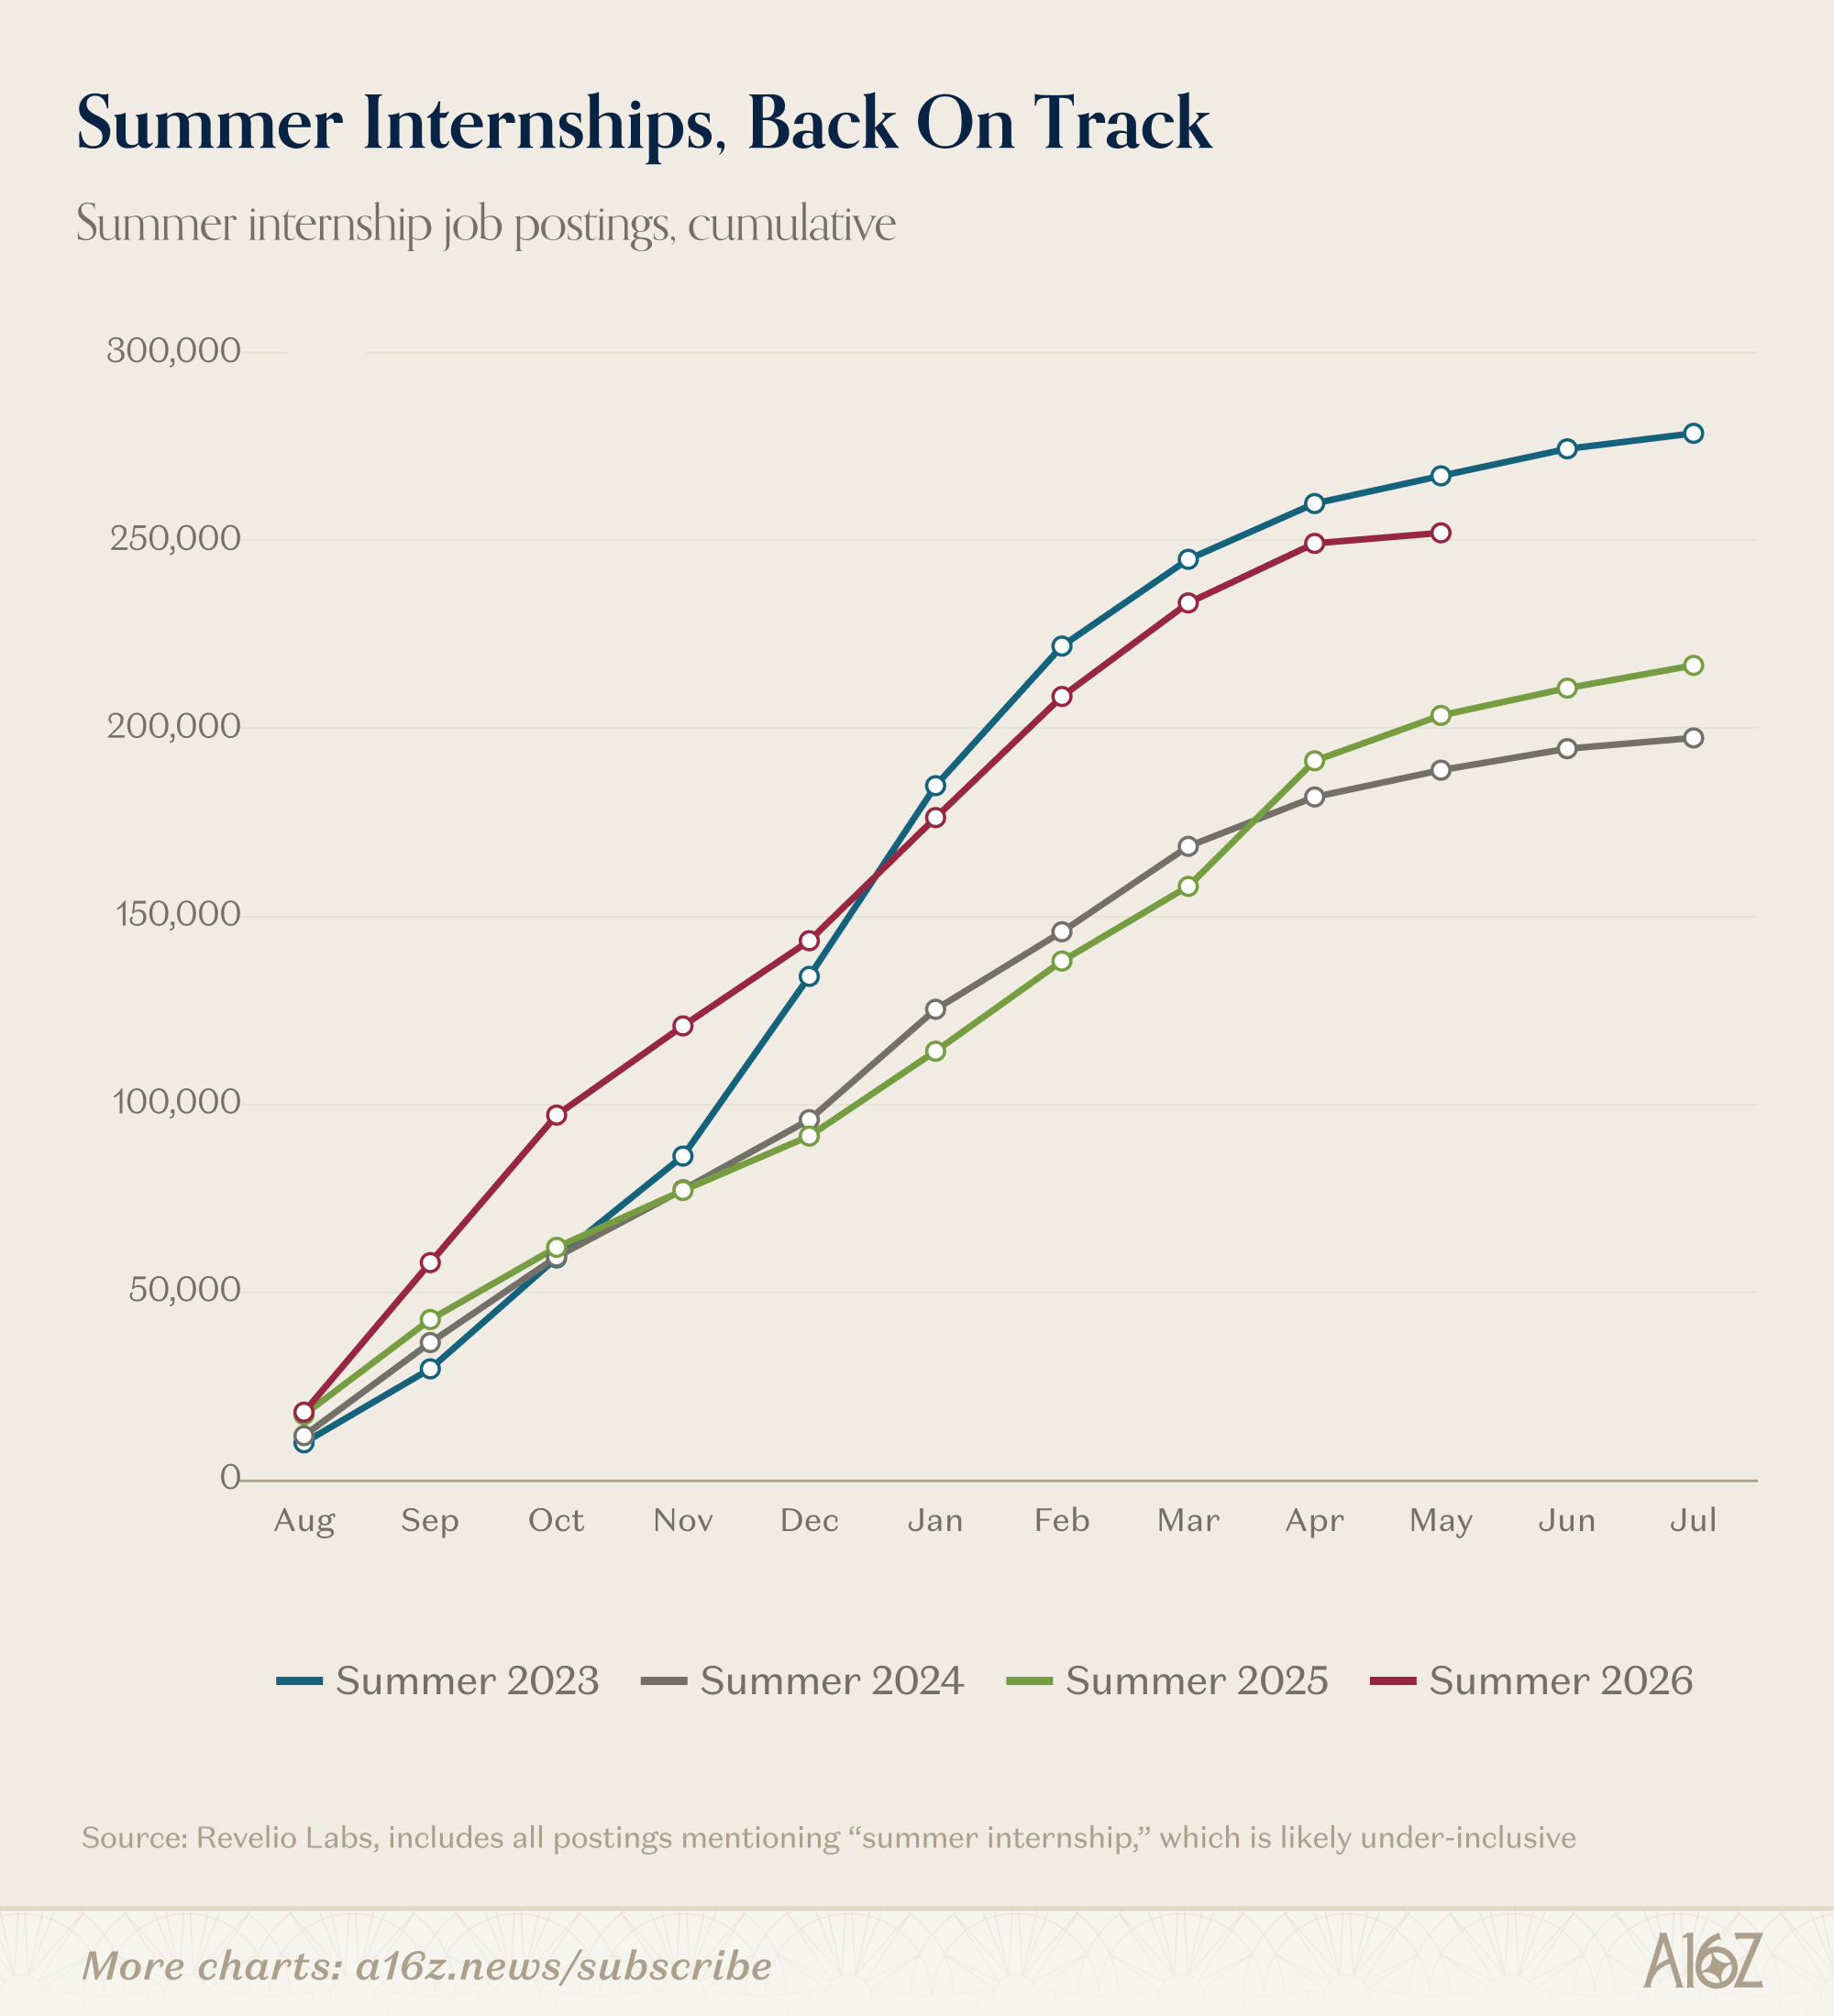
Internships aren’t the same thing as jobs, but they’re at least some semblance of a demand signal for the young and restless, and 2026 cycle is way ahead of ‘25 and ‘24 (if not quite at ‘23).
Even better than that, pay growth for teens and young adults also appears to be on the rise:
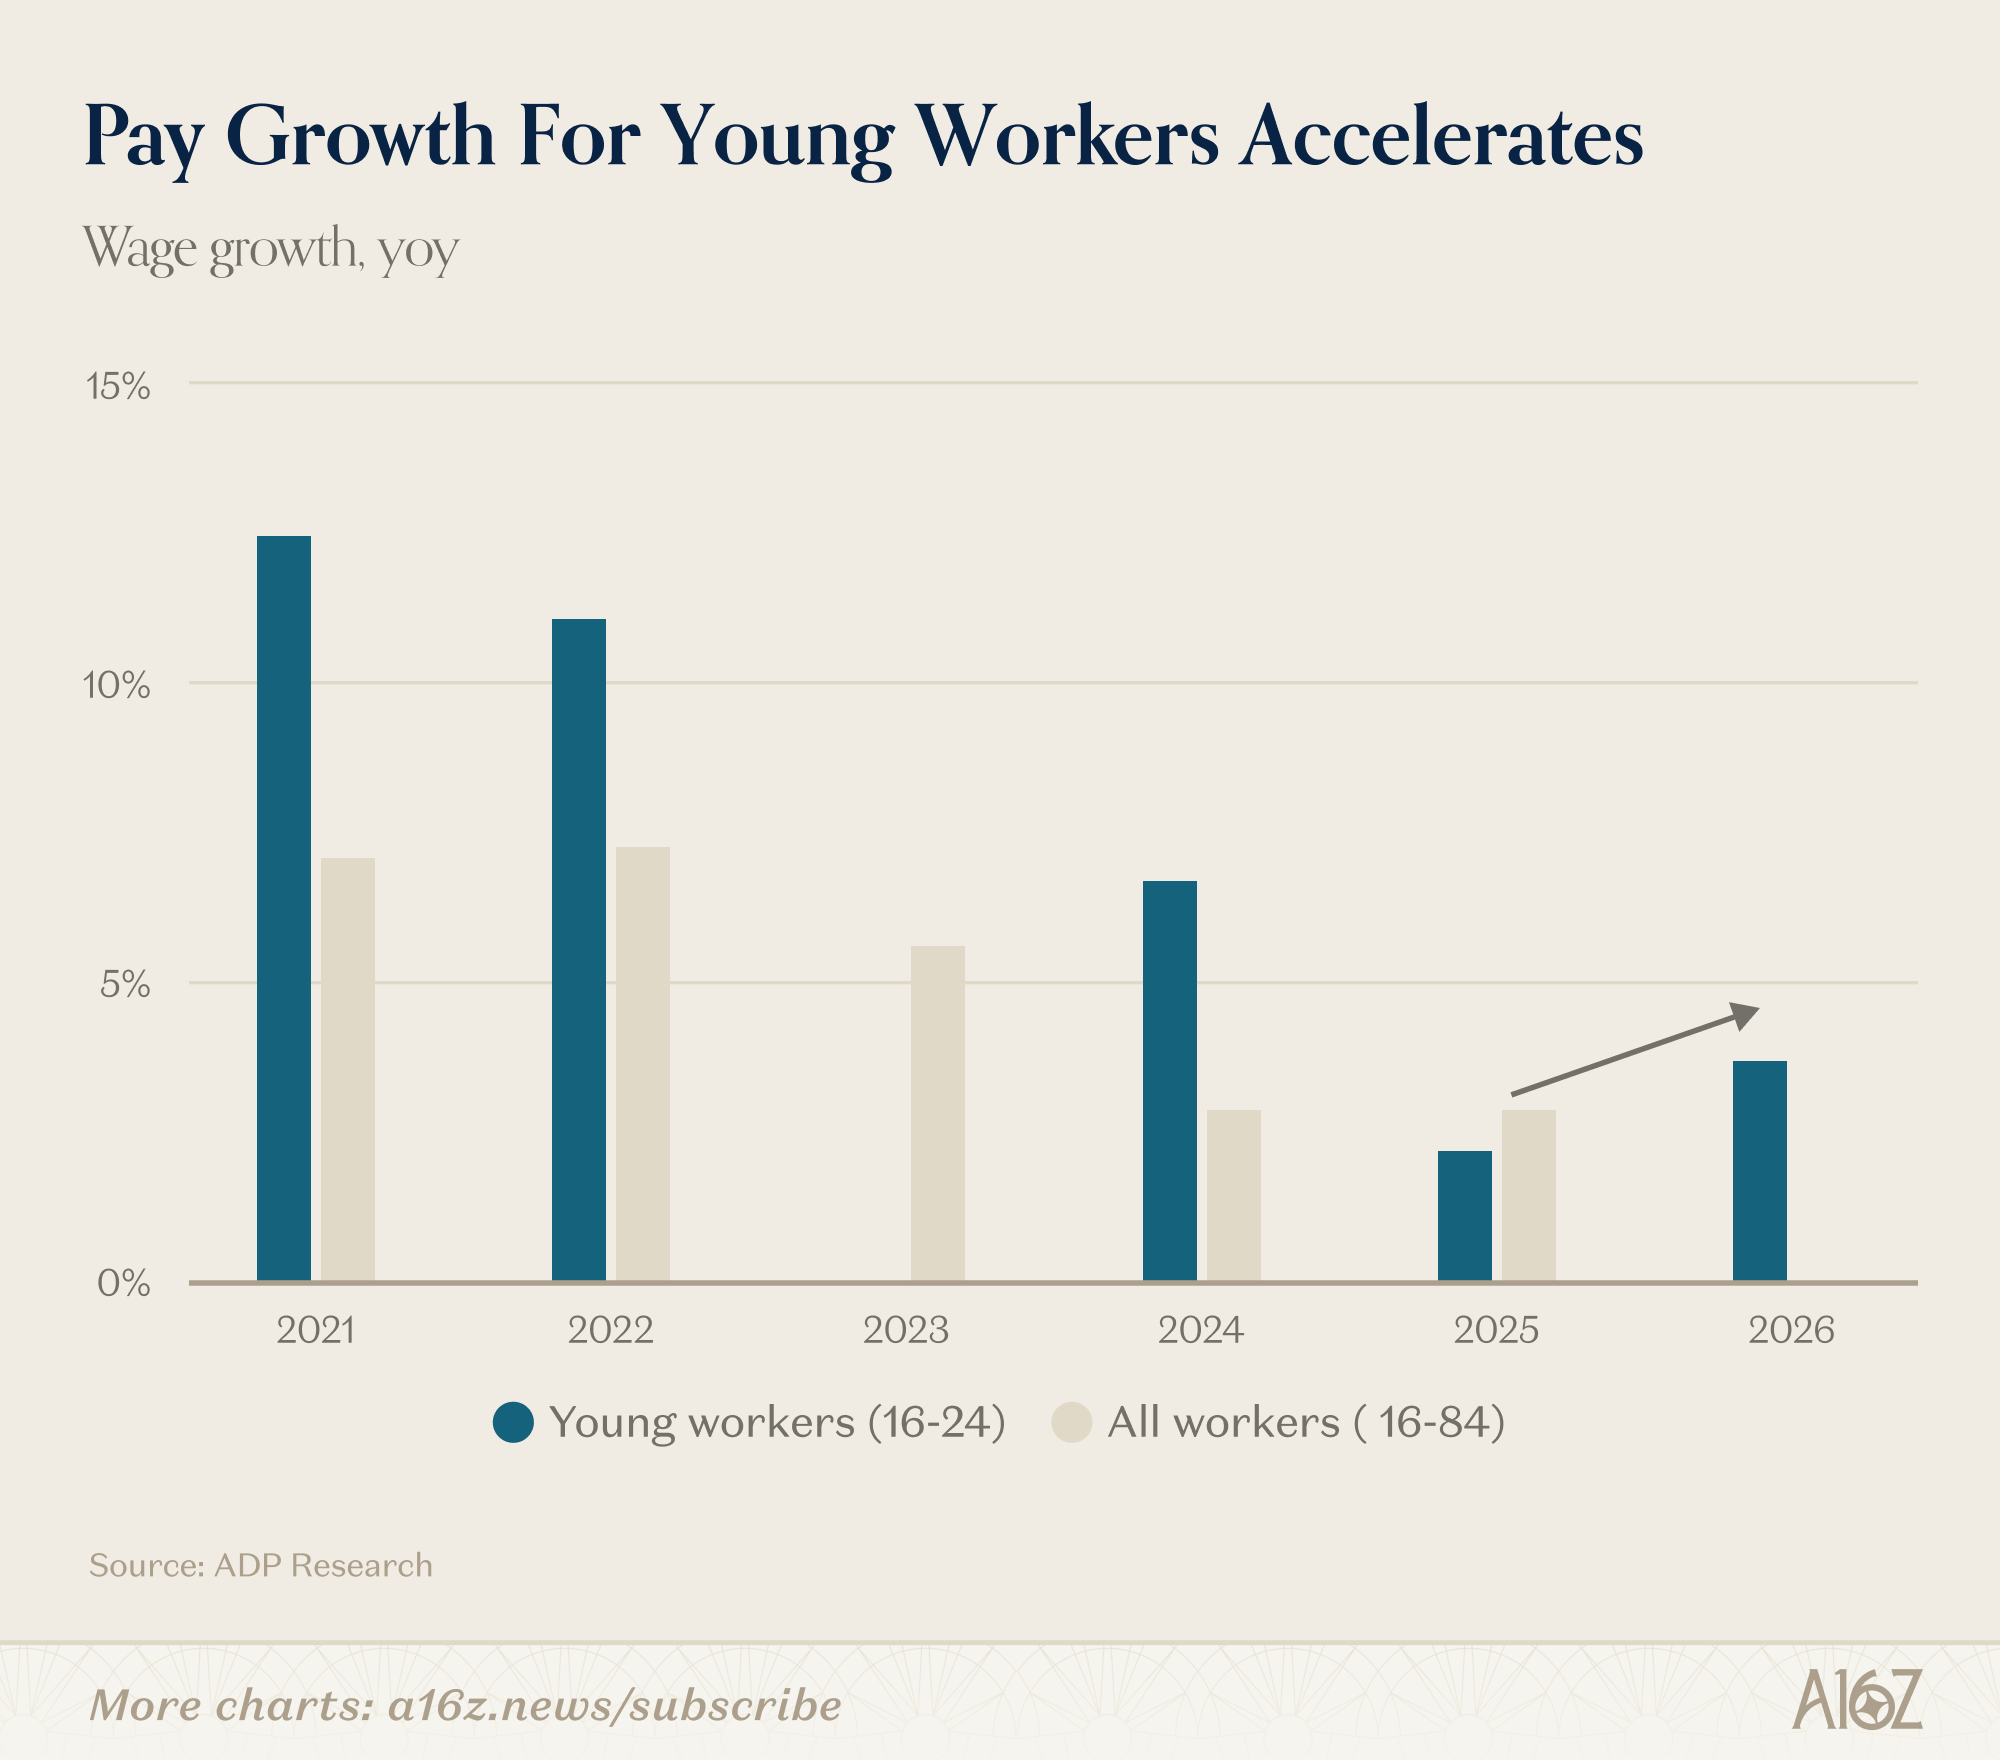
According to ADP’s data, wage gains for young workers (16-24) have rebounded off their 2025 floor. Wage gains are almost certainly a demand signal, and if wages are going up, one can reasonably surmise that entry-level employment prospects are going up, as well.
With respect to AI’s impact (if any), there the story is even better. If anything, AI appears to be accelerating entry-level hiring in a big way:
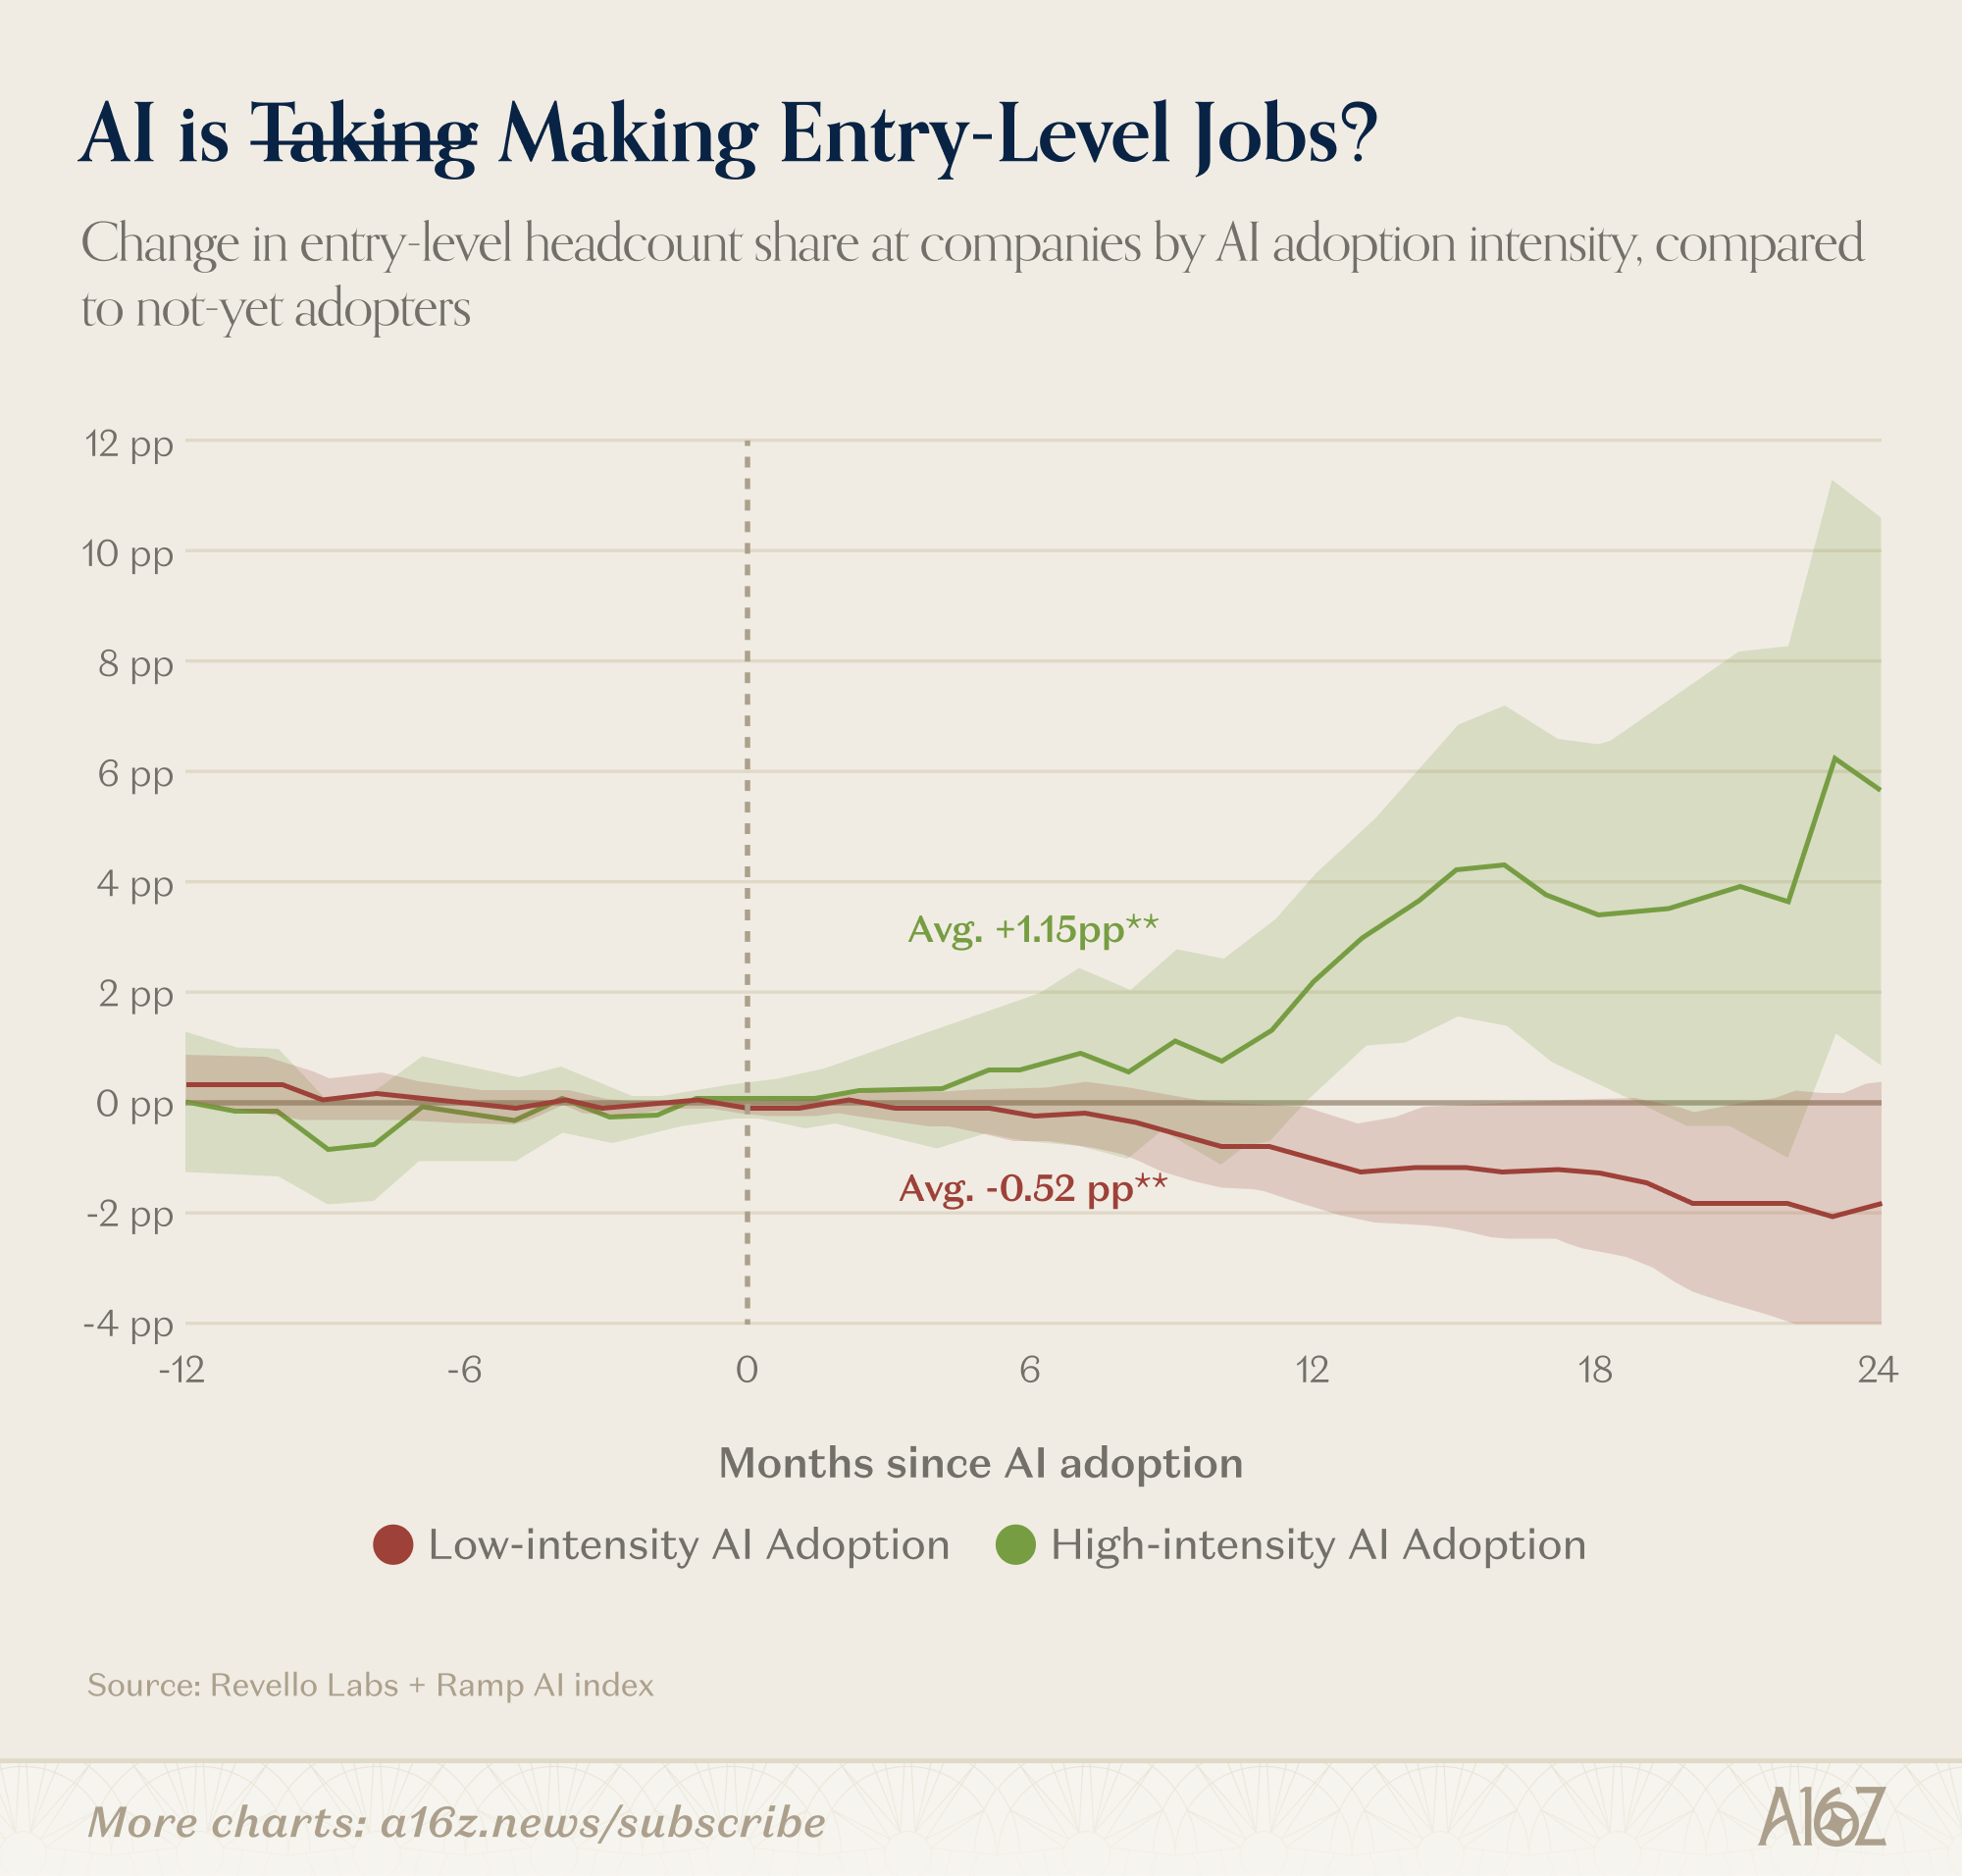
Per an analysis of Revelio’s job data and Ramp’s spending data, “High-Intensity AI Adoption” corresponds to a ~6pp increase in entry-level headcount, two years after adoption. “Low-Intensity” AI-Adoption, by contrast, corresponds to a ~.50 pp decline.
Now, there are few ways to interpret this, from “AI is creating entry-level hiring,” to “AI adopters are the growth companies and therefore of course they’re the ones doing the hiring,” to “Ramp’s data may not be a representative sample of the economy writ-large, and therefore it’s hard to conclude anything at all.” That’s all well and good, but one interpretation that almost certainly does not follow is that “AI is killing entry-level jobs.”
Perhaps one day (although, again, there is every reason to think otherwise), but not today.
In general, while much was made of post-ZIRP decline of “AI exposed” jobs, there has been comparatively little discussion of the fact that “AI exposed” jobs have recently been leading the comeback charge:
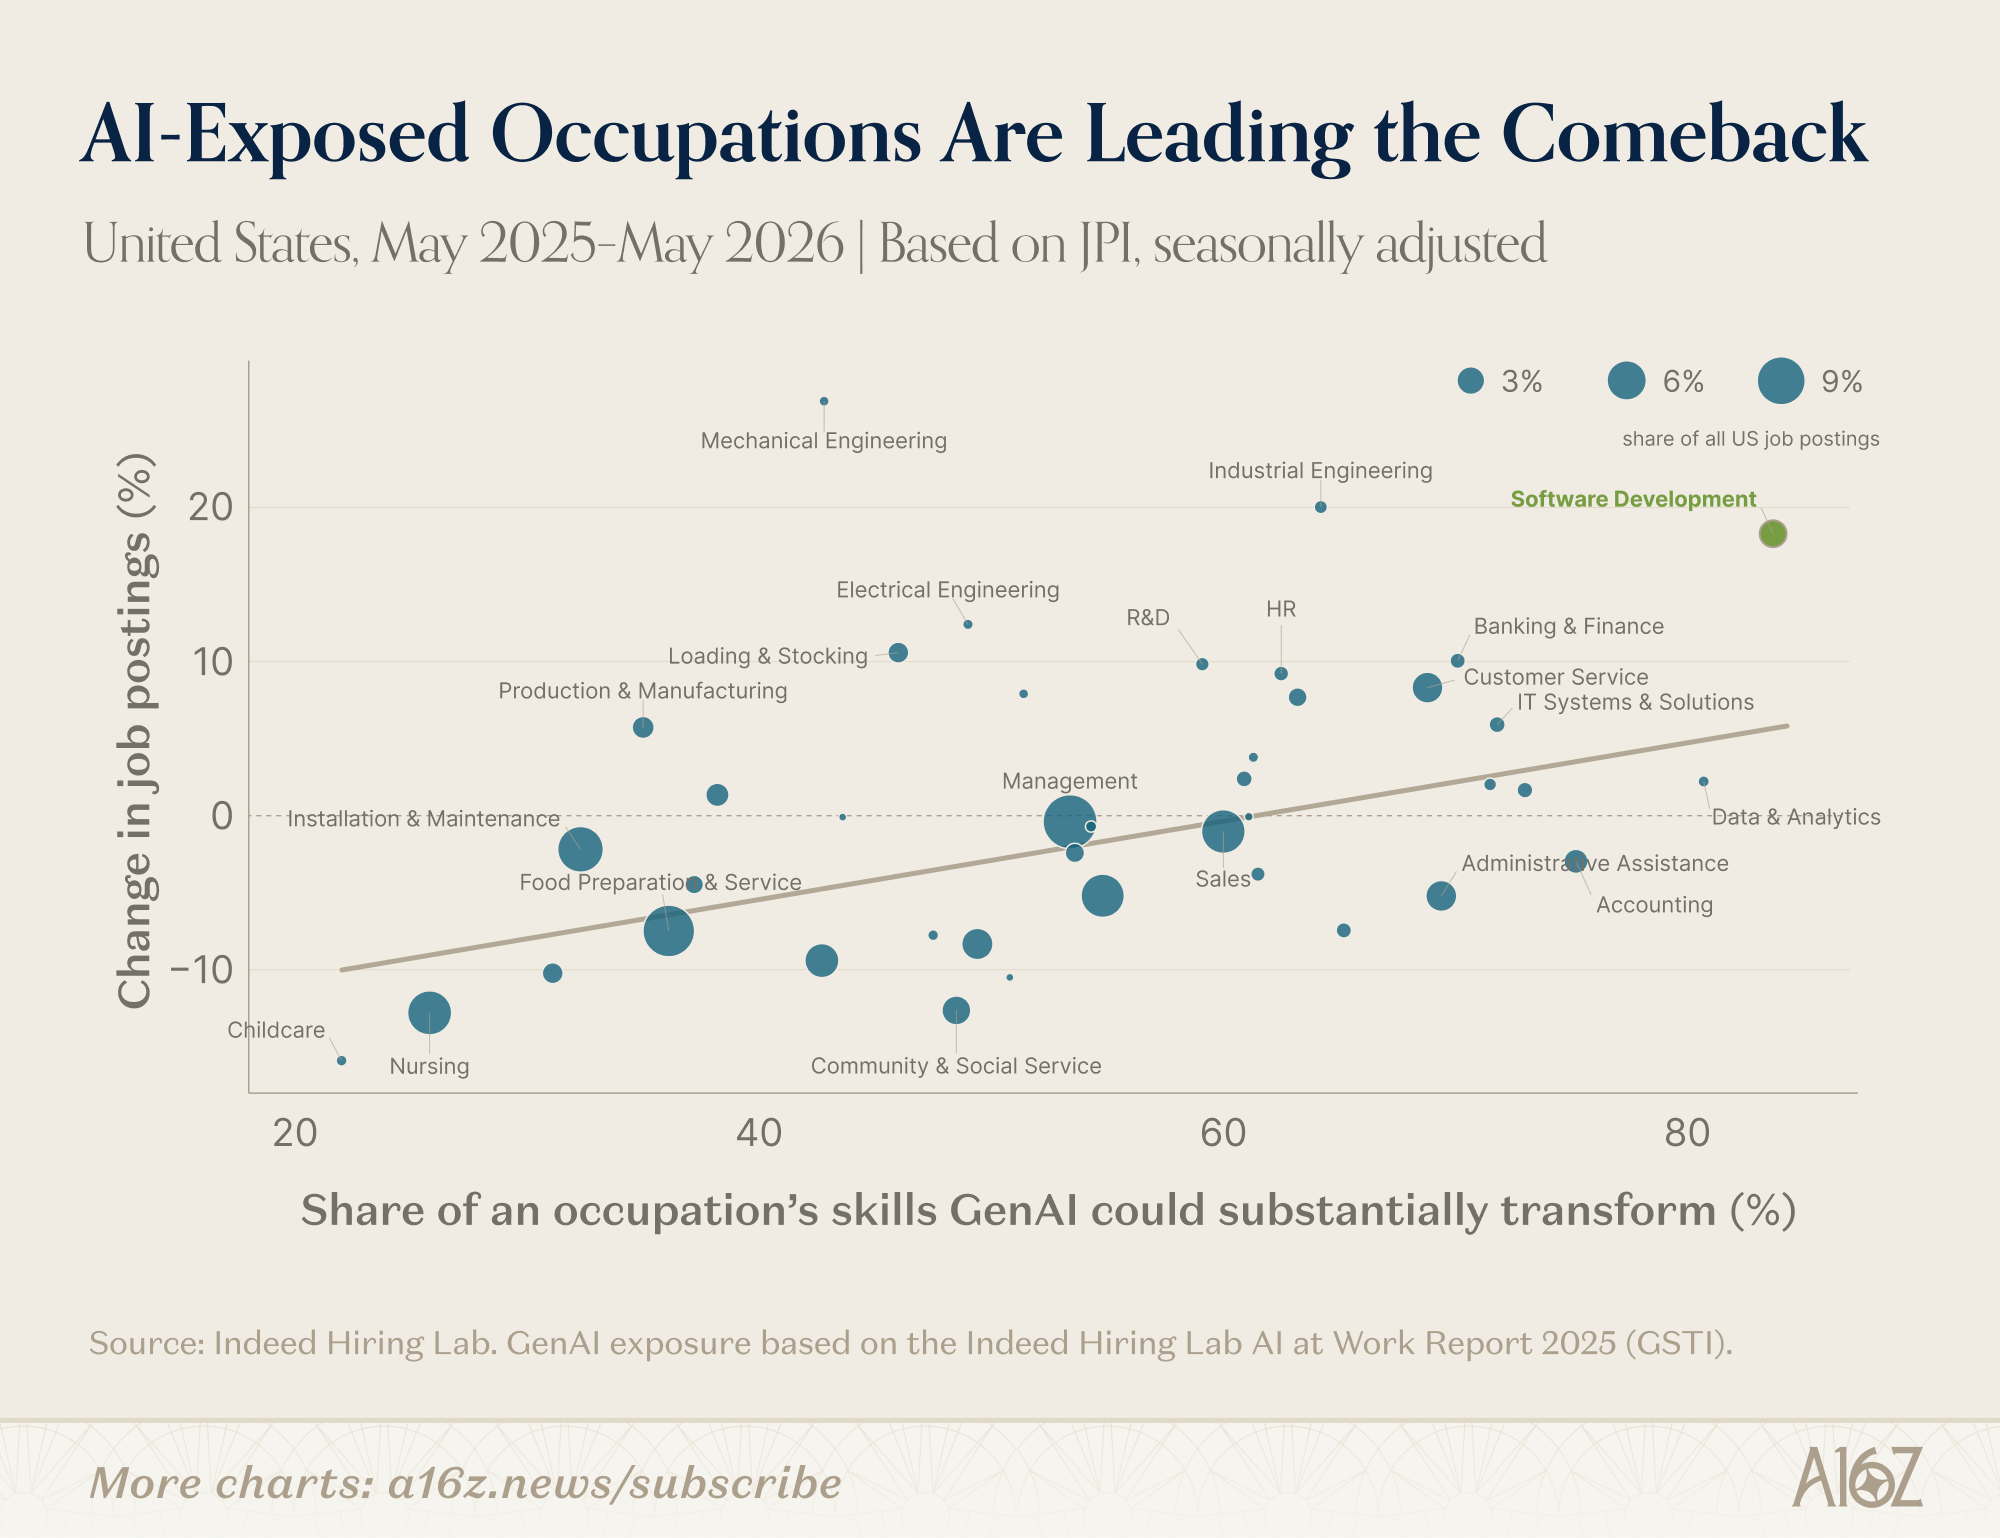
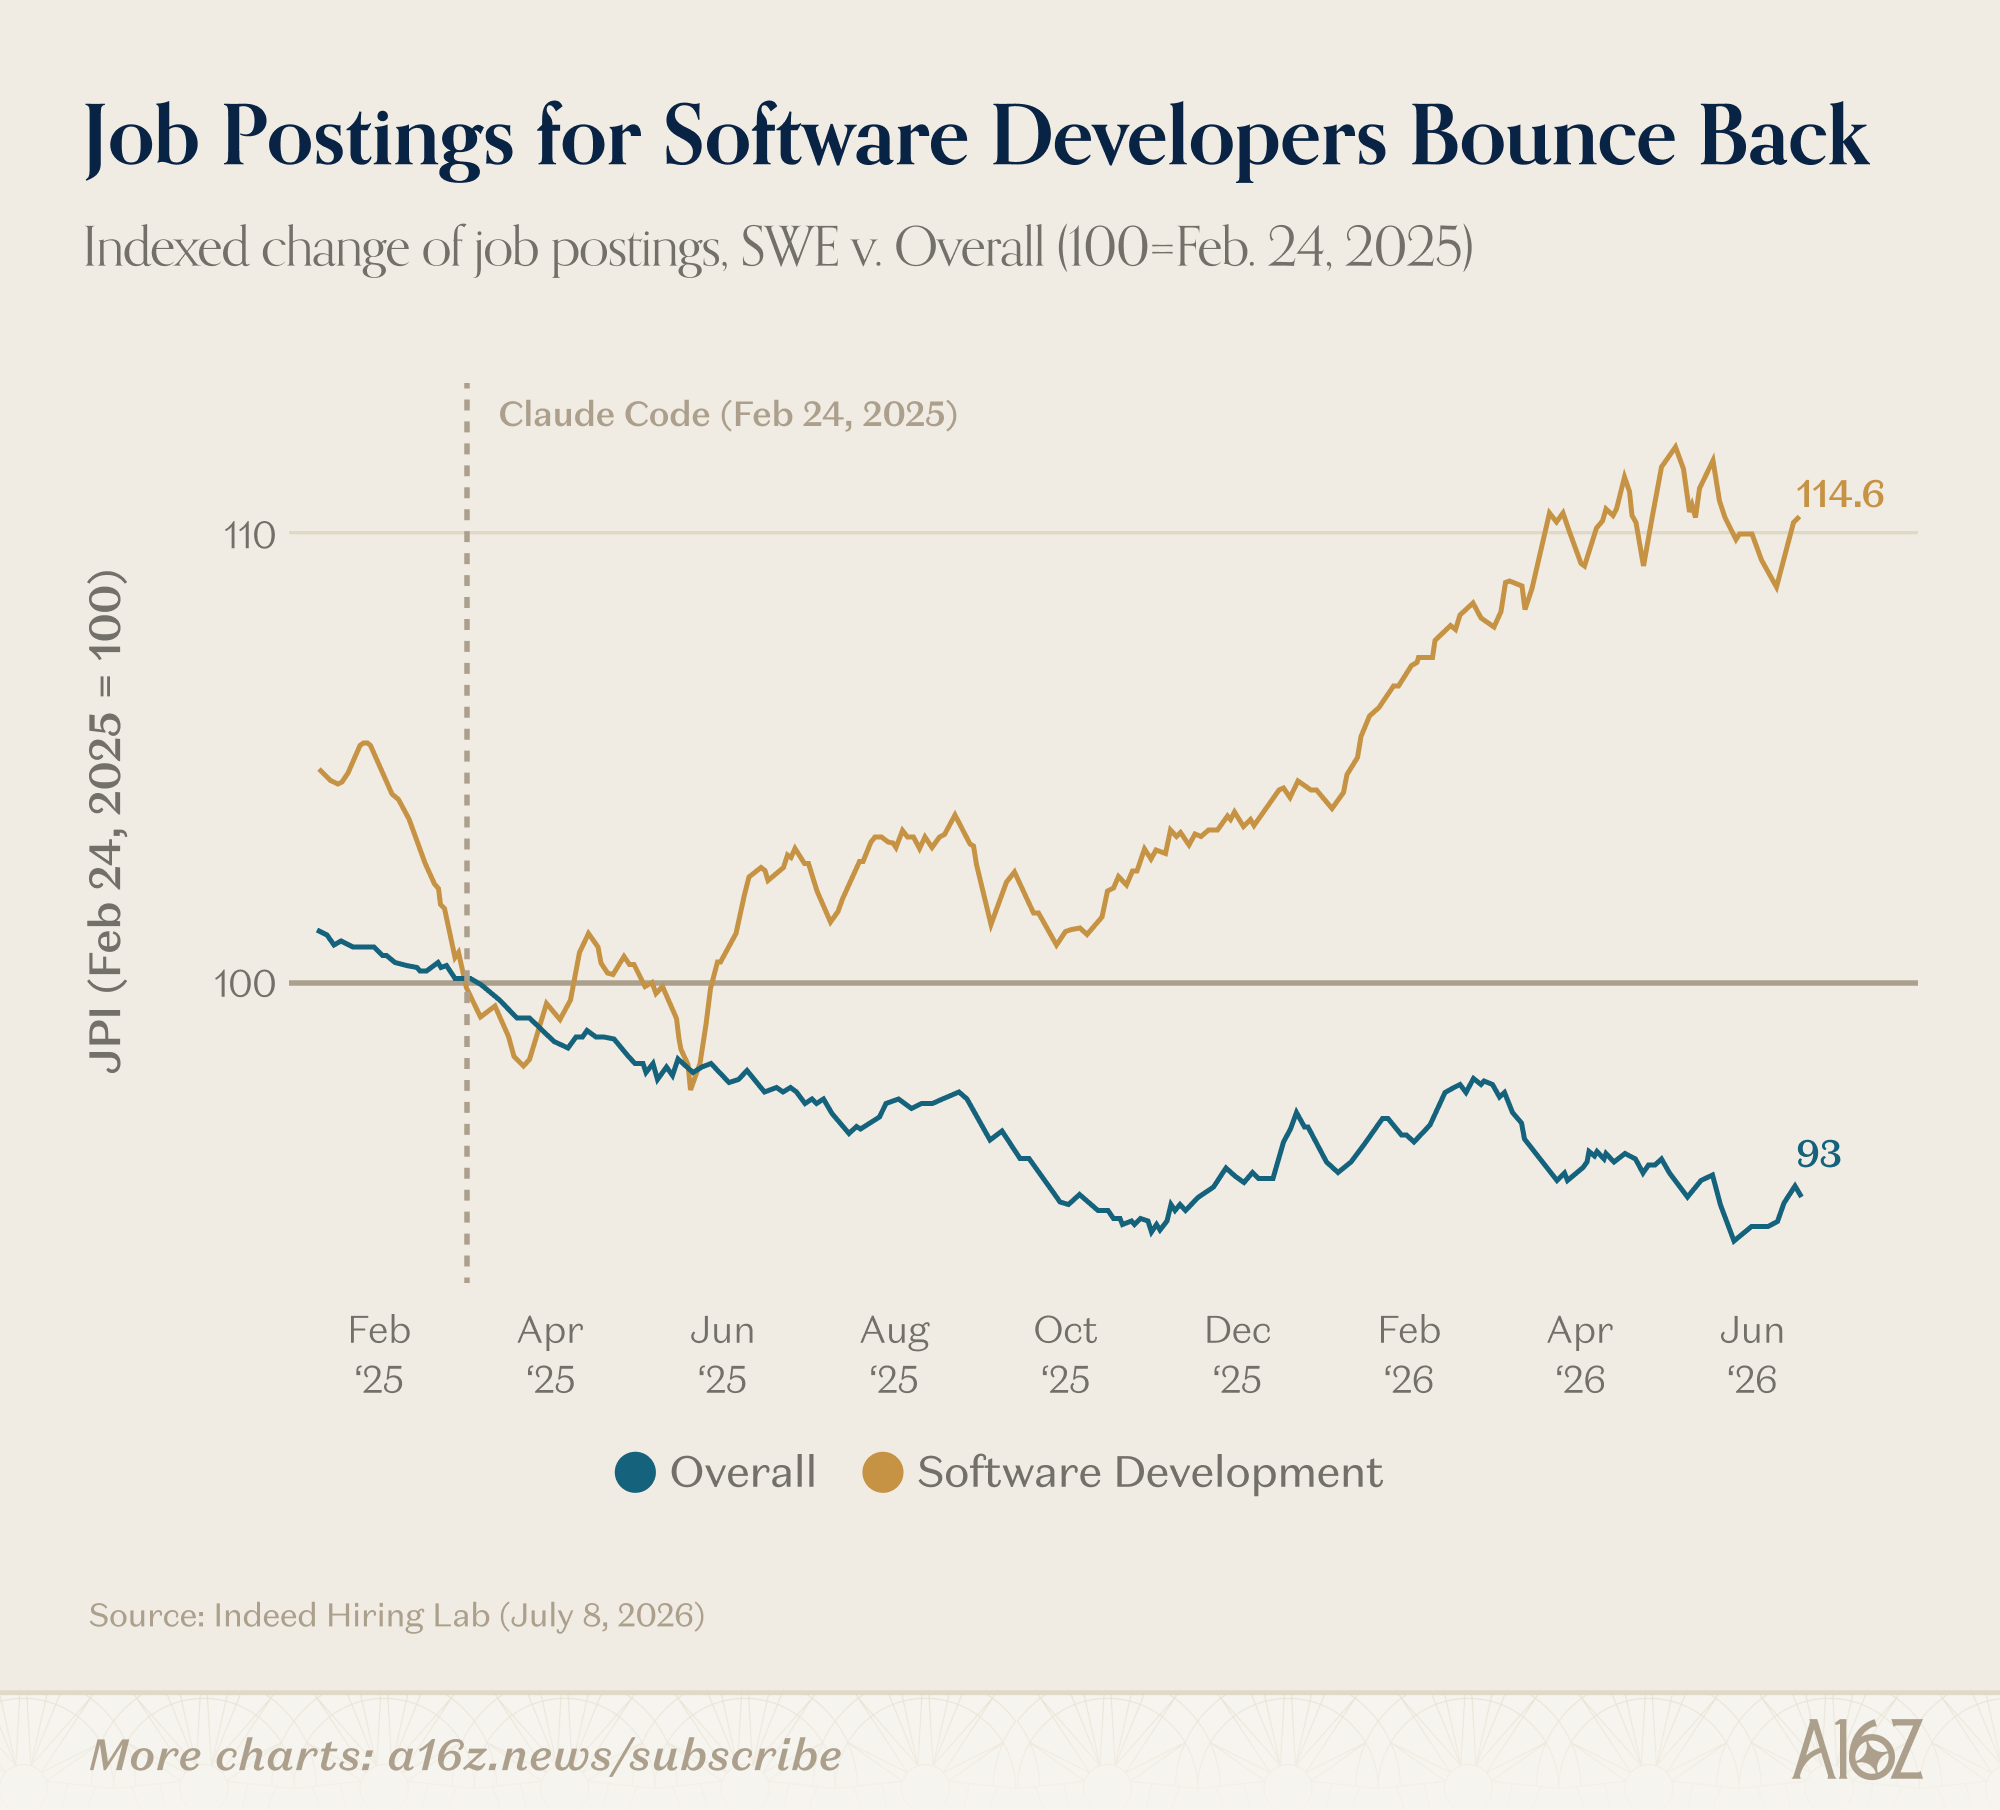
As per the Indeed Hiring Lab, since May 2025, when it comes to job openings, the greater the AI exposure, the greater the recovery. That’s especially true for software engineers, where job postings have increased by ~15%, in comparison to an overall ~7% decline (measured from the release of Claude Code).
In the bigger scheme of things, the reality is that it’s too soon to tell, but to the extent that anyone is inclined to declare that ‘AI is causing human obsolescence,’ the data simply is not on their side. If anything, it’s quite the opposite—AI-exposure seems to positively correlate with job-growth.
Now, to be fair, it’s unclear how meaningful the “AI exposure” category actually is because there’s very little agreement on what or who is exposed (and by how much):
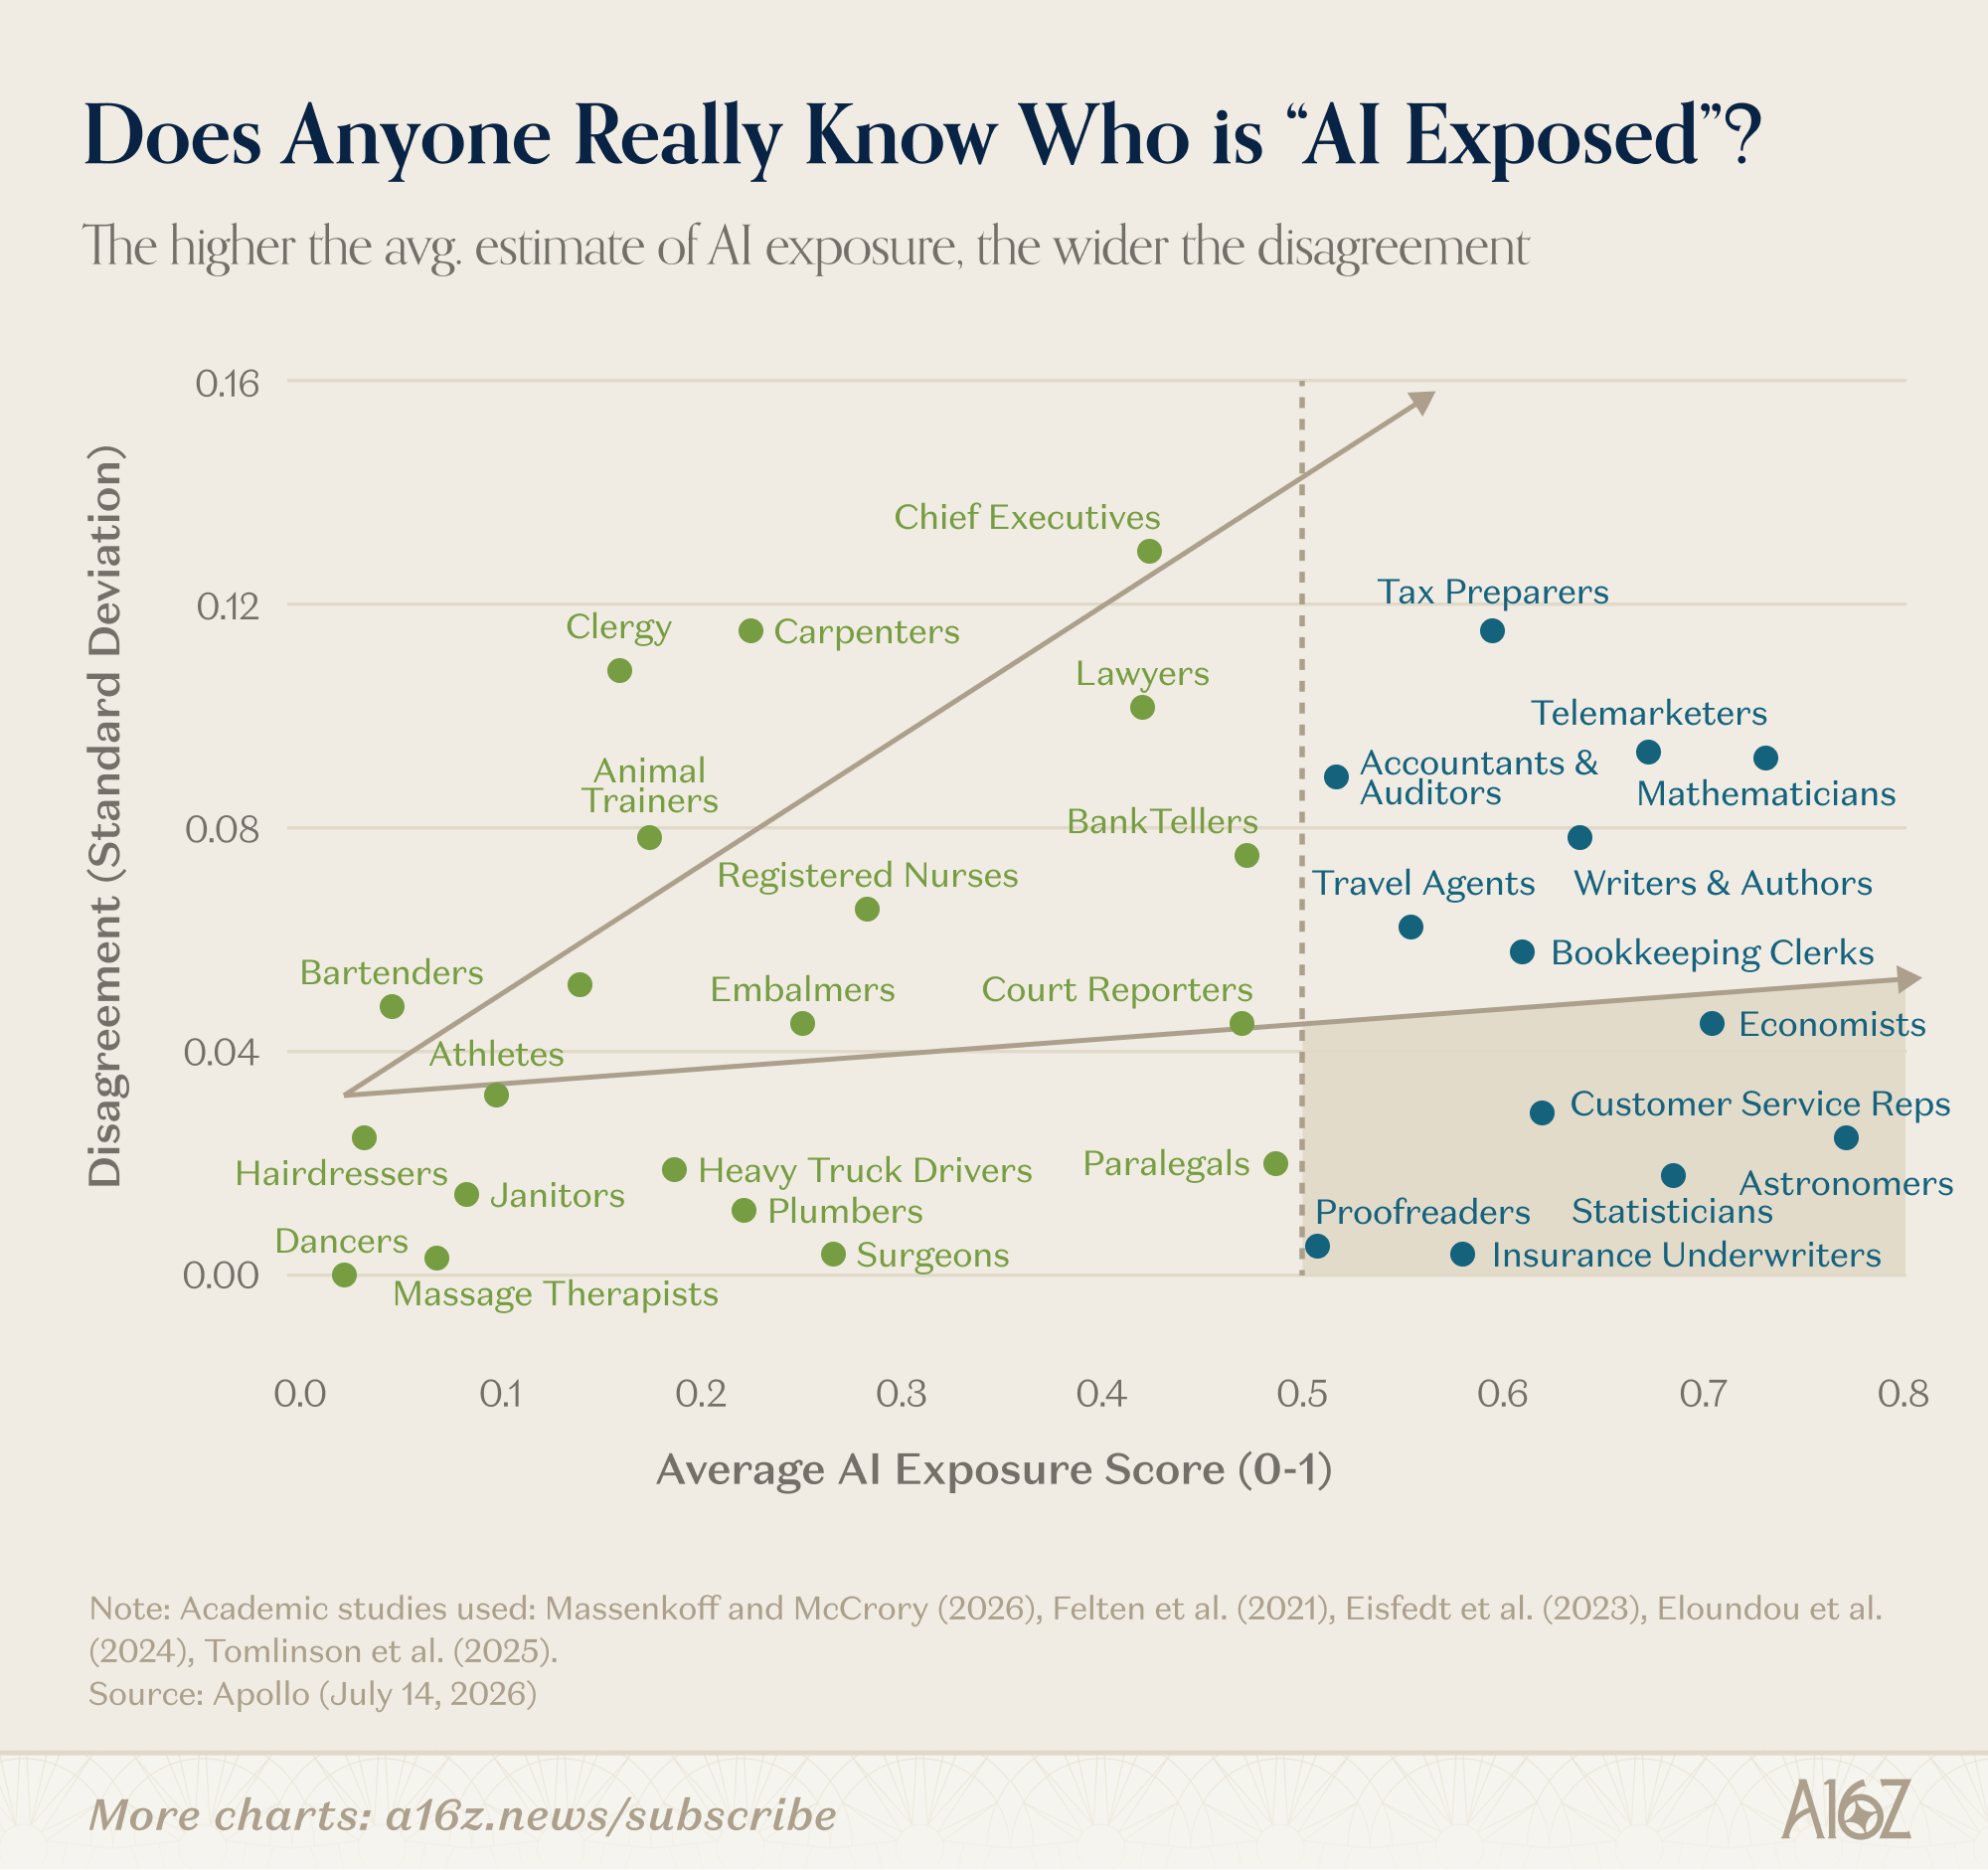
It turns out that the higher the average “AI Exposure” for any given occupation, the more disagreement there is with respect to the degree of exposure.
Unsurprisingly, when it comes to predicting the future impact of a novel technology, reasonable minds can disagree.
There are some exceptions, of course. Everyone seems to agree that proofreaders, insurance underwriters, statisticians and, funnily enough, economists, are all very AI-exposed. If AI does eventually disintermediate human economists, will it cop to the crime or will there be no economists left to tell the tale?
Data Centers Make Energy Cheaper
Earlier this week, New York State’s Governor Hochul announced that she was imposing a 1 year moratorium on data center development. Among other things, the stated goal of the moratorium is to “protect [electricity] ratepayers . . . as data center development threatens to hike up utility bills.” Without intending to sell her short, the Governor offered a bit more color about her reasoning on the Odd Lots podcast, so check it out.
That said, it’s still a curious pronouncement.
While it’s certainly true that data centers are increasing demand for electricity, the evidence suggests that, if anything, data centers are actually helping reduce the cost to ratepayers:
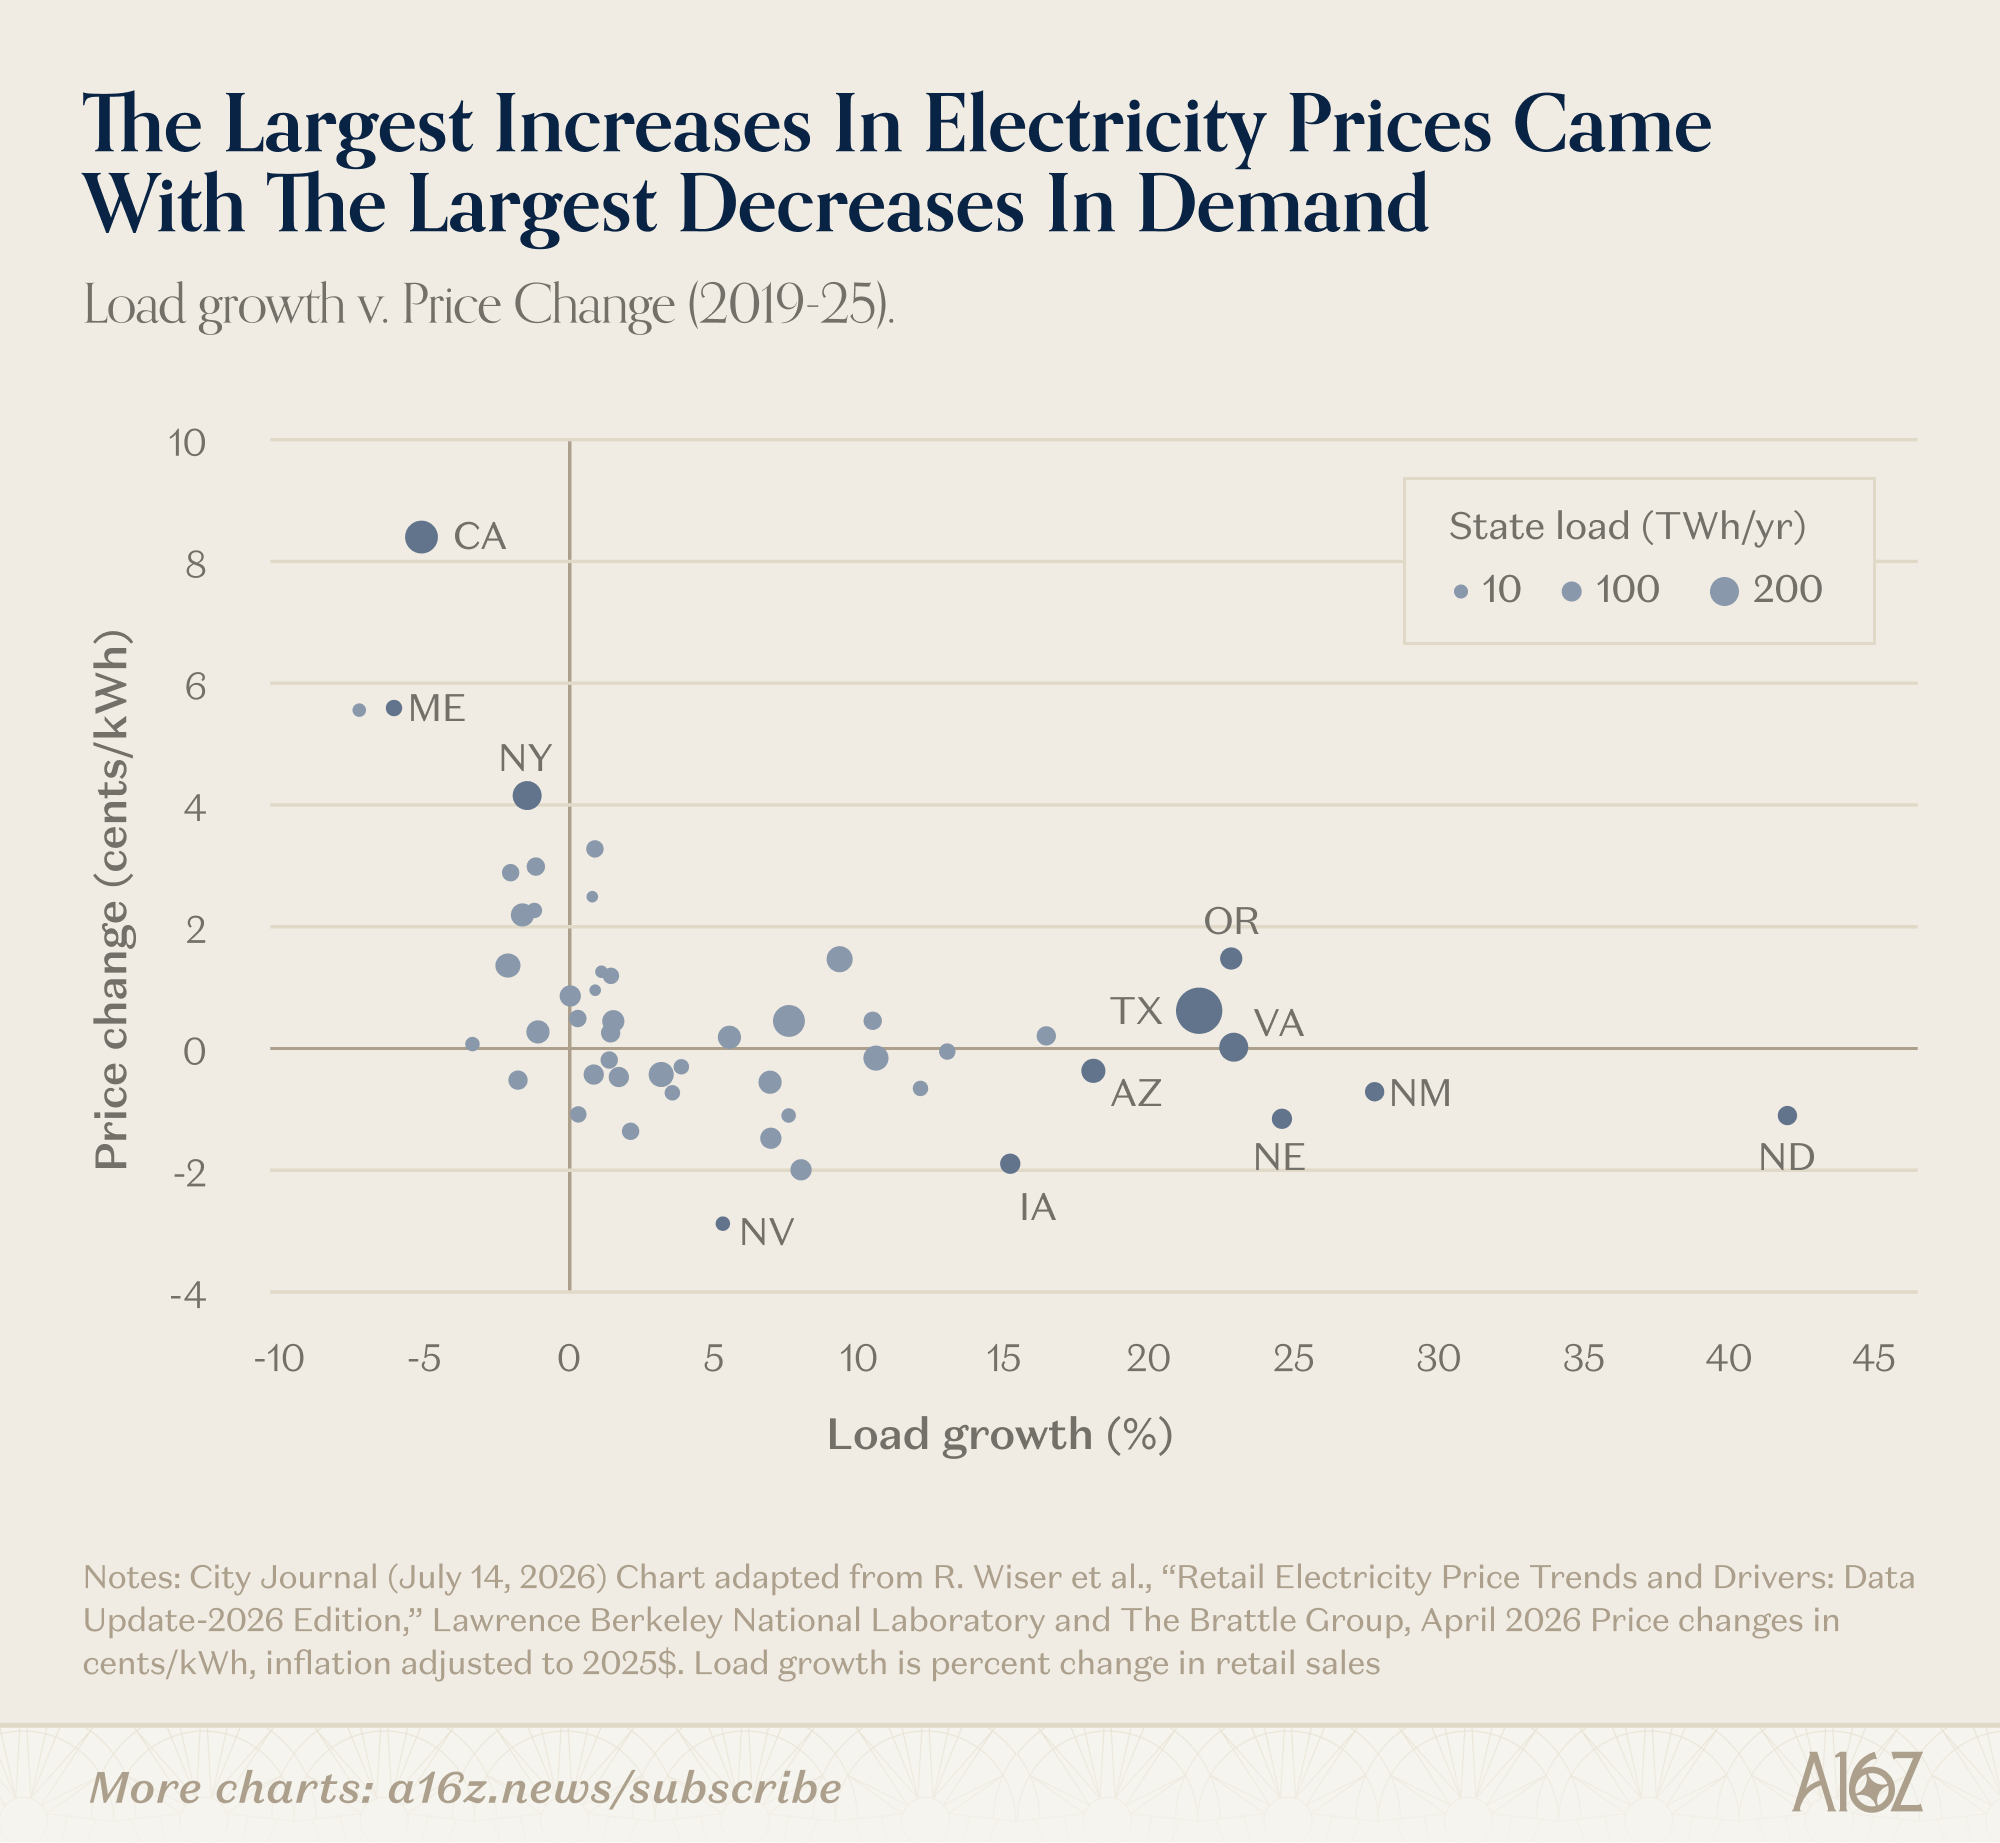
Based on research from the Berkeley National Laboratory and The Brattle Group, at the state level, price-increases for electricity are negatively correlated with increased demand. Consume more, pay less—strange but true.
Indeed, over the past 6 years, the states with some of the steepest load growth (and the most data center development), like Texas and Virginia, have seen little-to-no price increases, at all. On the other hand, states with the steepest price increases (and very few new data centers), like CA and NY, have experienced a decrease in load-growth—California has reduced electricity demand by ~5% while increasing prices by more than anywhere in the country, and ~33% more than the next closest offender.
Not only that, but the inverse relationship between energy demand and energy prices appears to hold in Europe, as well:
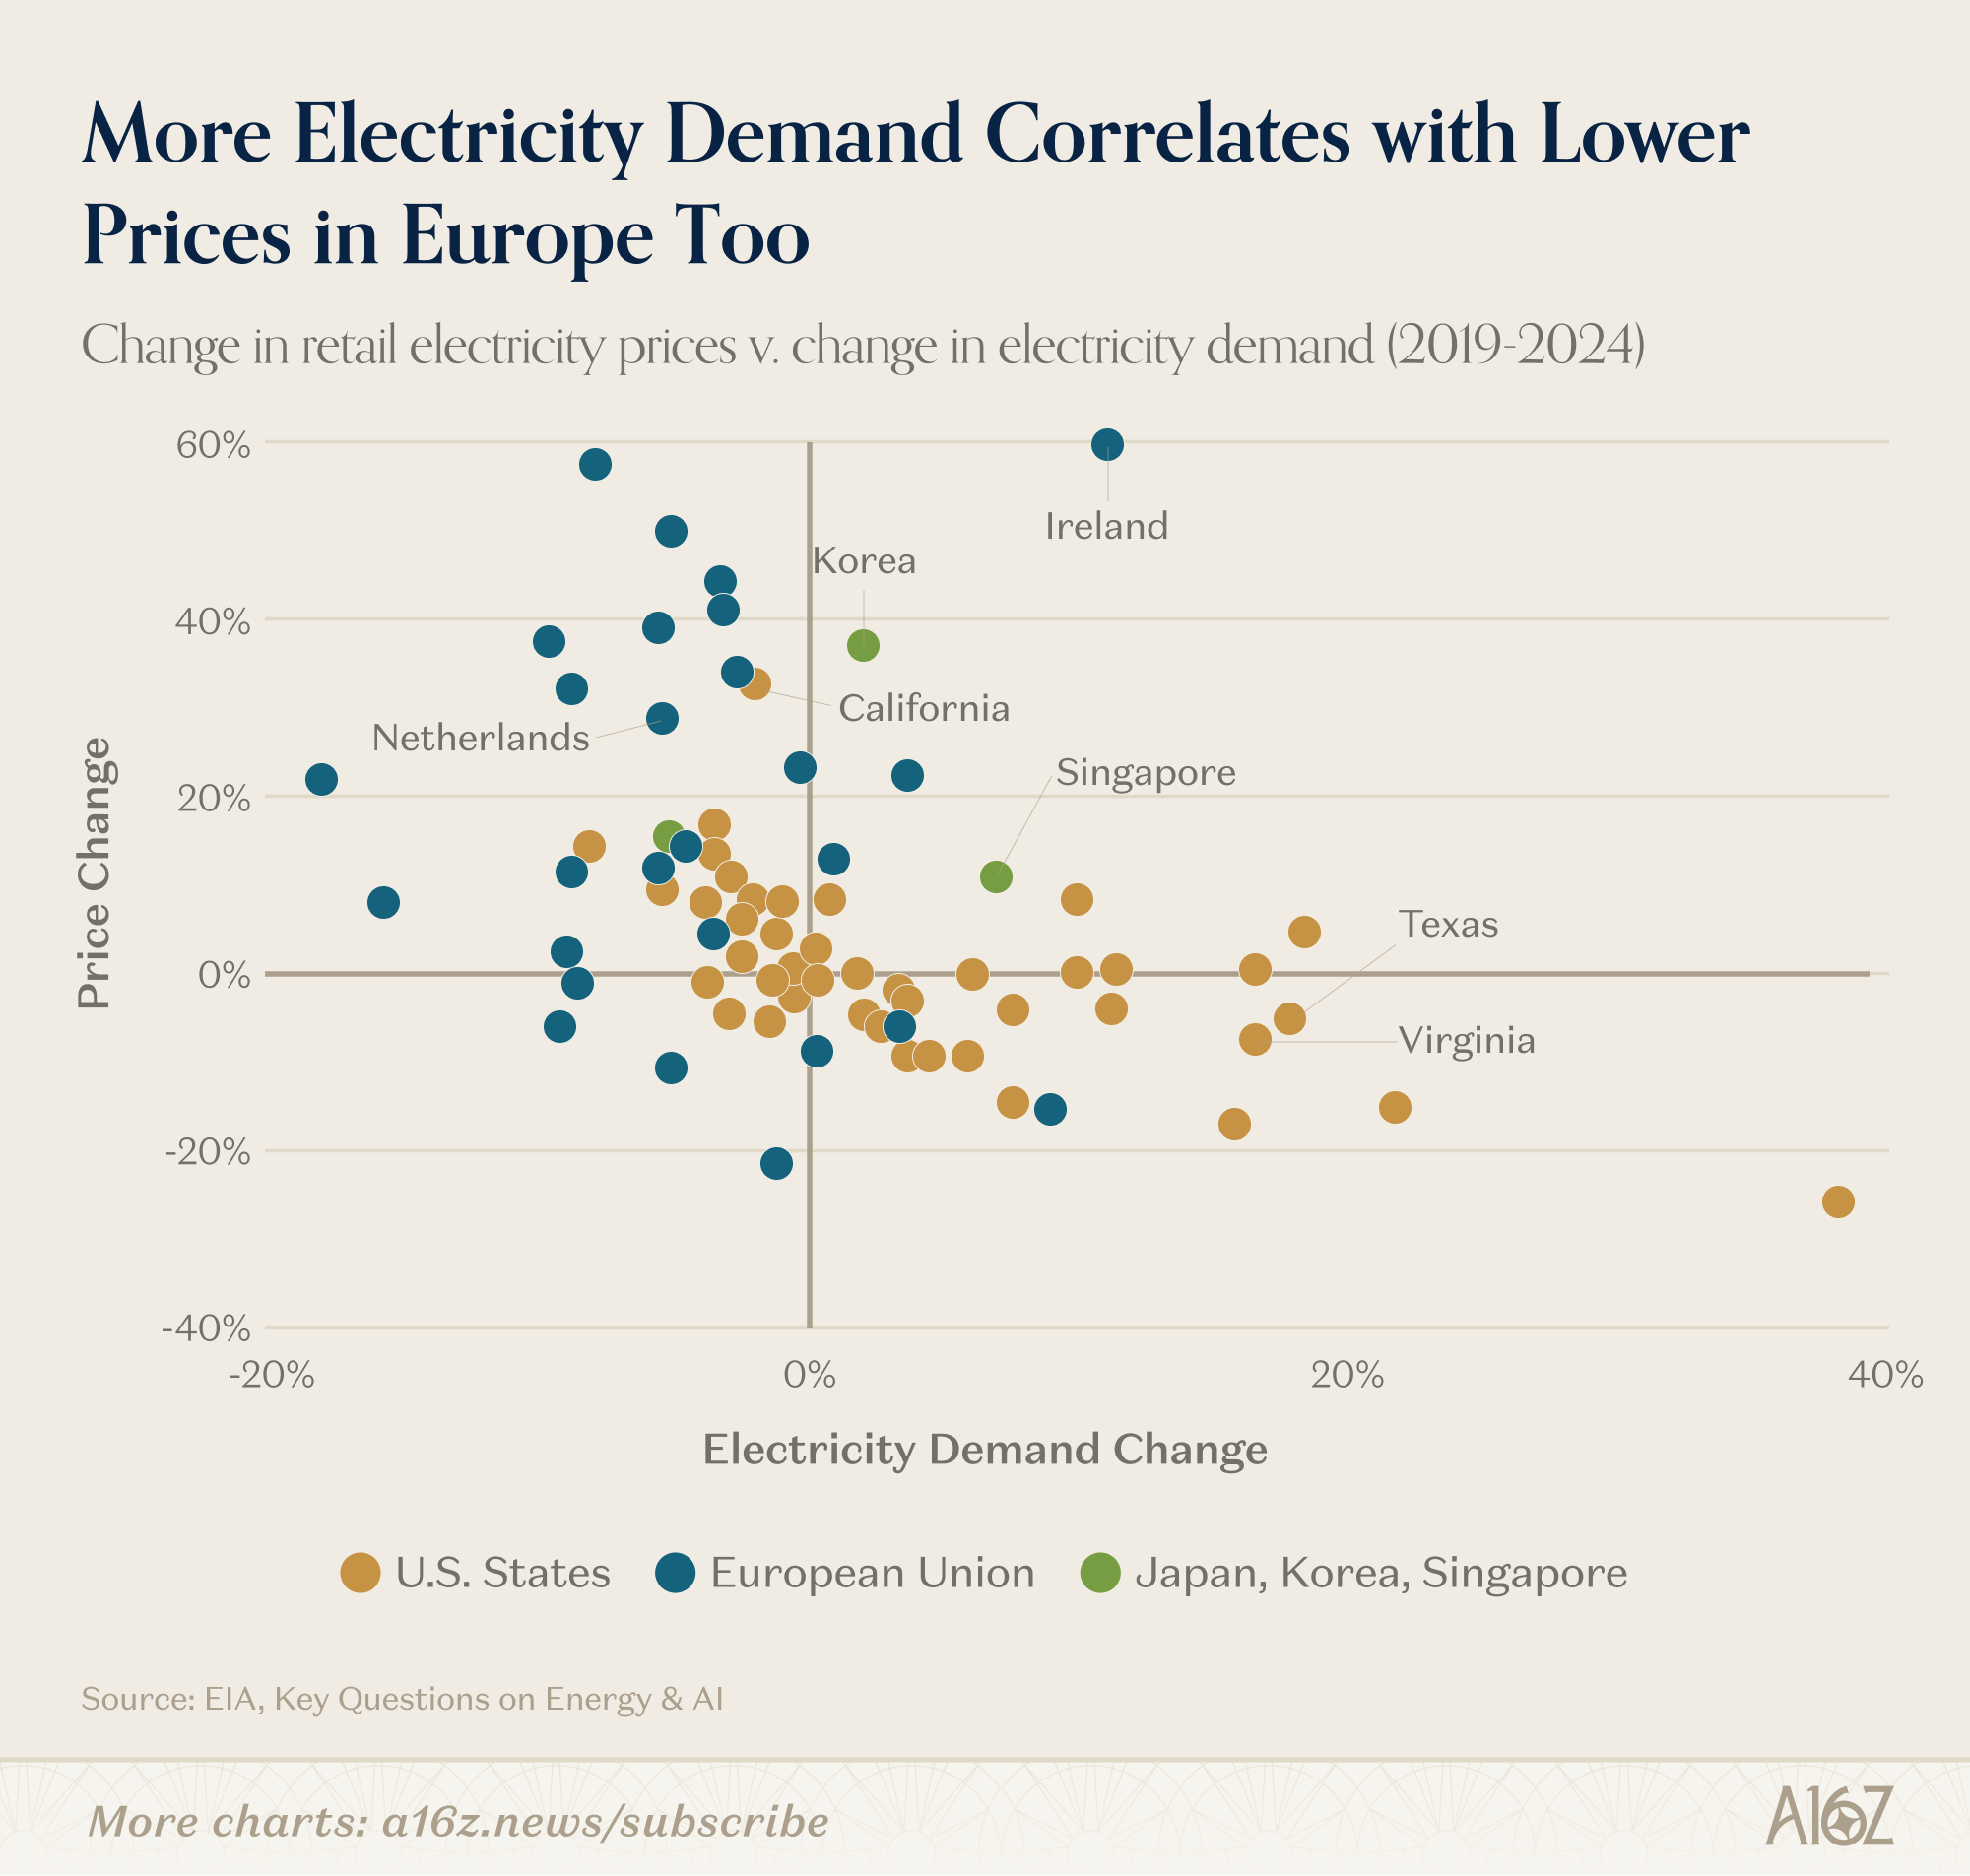
As per the EIA, with the exception of Ireland, the EU countries with the largest increases in prices, also had the largest decreases in demand for electricity.
Again, consume more, pay less. It’s counter-intuitive, right?
We all know that all things being equal, more demand should increase prices, not the other way around (as per Gov. Hochul’s declaration). But when it comes to the grid, the story flips. The reason that demand is inversely related to cost is that the grid tends to benefit from economies of scale: the more electricity demand there is, the more distributed fixed infrastructure costs become, leading to an overall drop in prices for ratepayers.
In other words, rather than “protect rate payers,” Hochul’s Data Center moratorium may well have the opposite effect: electricity prices could rise much more so than if data centers were there to help carry the fixed costs of the grid. Perhaps that relationship will not continue to hold, but that’s been the story to date.
Energy costs notwithstanding, there is also the broader economic impact to consider. The reality is that without AI-related infrastructure investment, there is very little investment growth, at all:
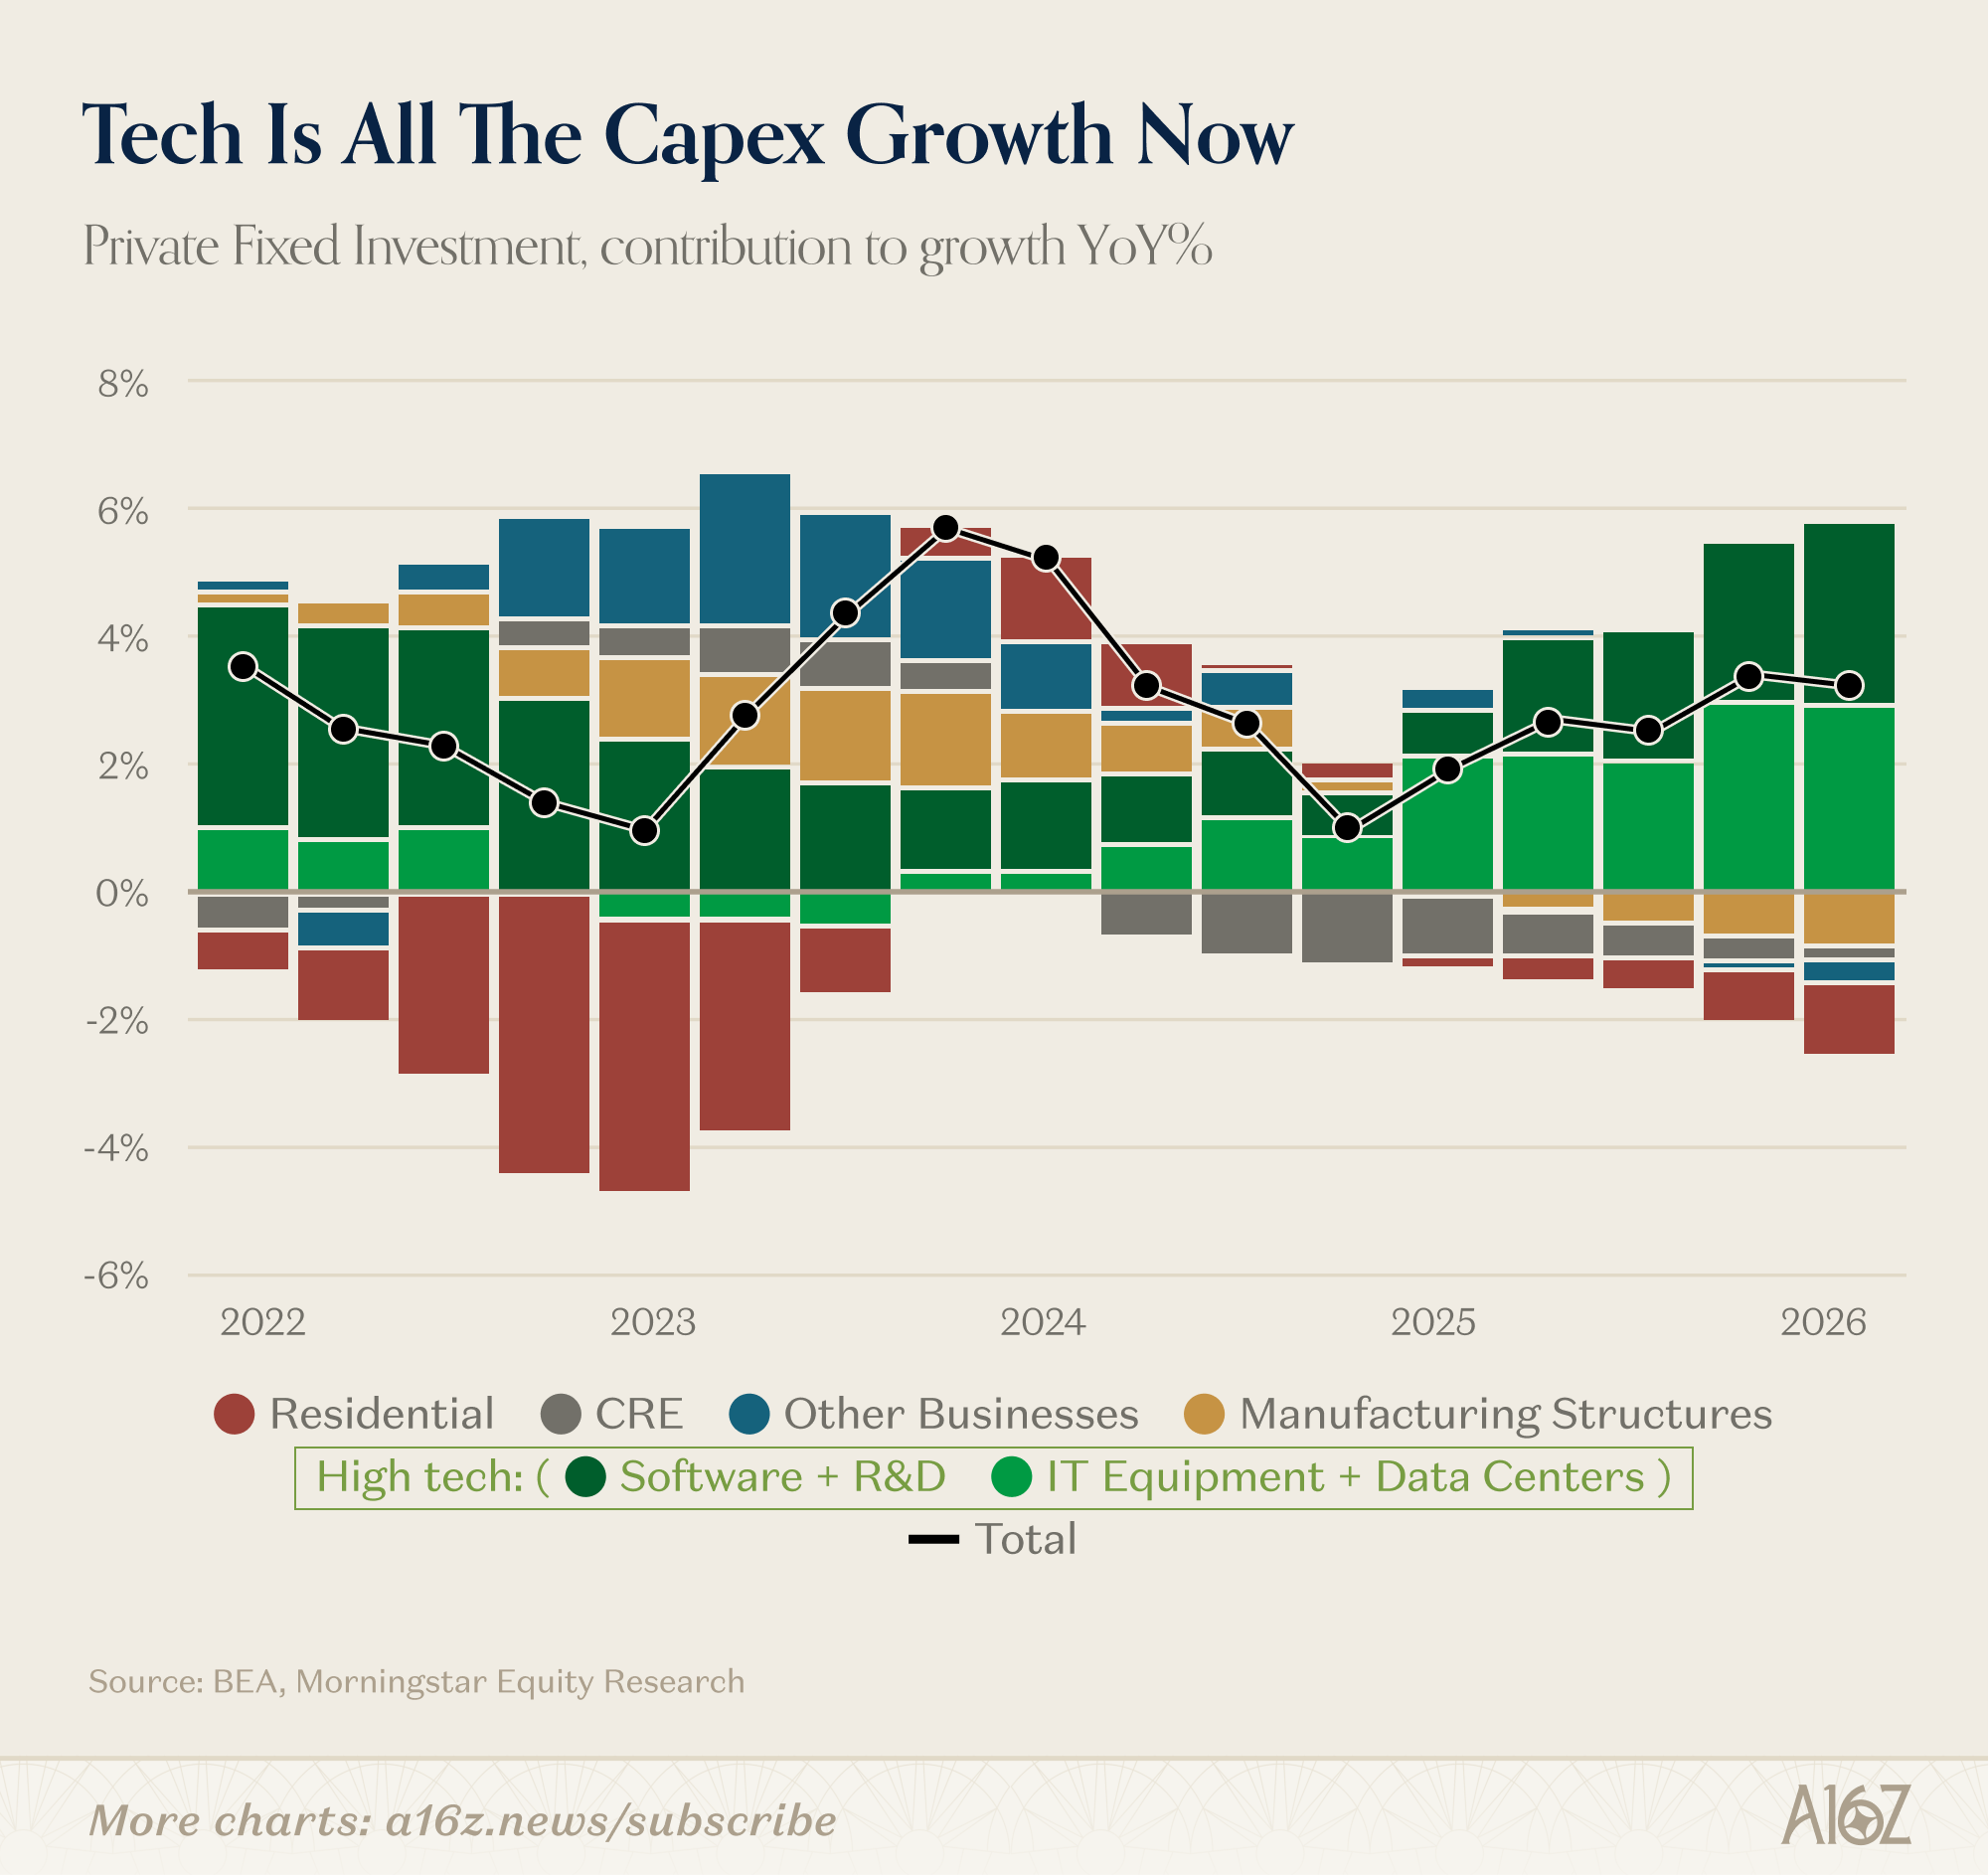
Tech-related investments are the only growing categories of investments, so a moratorium hits right where it counts the most.
Surely the Governor has her reasons, but a policy that may both (a) increase electricity prices (as part of an effort to “protect ratepayers”); and (b) deprive NY State of the most important investment tailwind in the game, is certainly hard to figure.


This newsletter is provided for informational purposes only, and should not be relied upon as legal, business, investment, or tax advice. Furthermore, this content is not investment advice, nor is it intended for use by any investors or prospective investors in any a16z funds. This newsletter may link to other websites or contain other information obtained from third-party sources - a16z has not independently verified nor makes any representations about the current or enduring accuracy of such information. If this content includes third-party advertisements, a16z has not reviewed such advertisements and does not endorse any advertising content or related companies contained therein. Any investments or portfolio companies mentioned, referred to, or described are not representative of all investments in vehicles managed by a16z; visit https://a16z.com/investment-list/ for a full list of investments. Other important information can be found at a16z.com/disclosures. You’re receiving this newsletter since you opted in earlier; if you would like to opt out of future newsletters you may unsubscribe immediately.
Another possibility is the prevalence of the momentum factor, i.e. whatever one thinks of the fundamentals, if there’s no heat, there’s no performance, but we’ll leave that aside for now.
Yes - bandwidth cheap energy please. We did this a generation ago with telecom and the price drop was past enormous to exponentially less, allowing the very internet we are communicating on.
Unless you think $12 in 1965 dollars ($124 now) for a 3 minute transatlantic voice call is reasonable. Never mind data unless you were an institution- government, university or a very large corporation.
There are no villains in my story here, just outdated legacies.
Is there an interactive chart available for "The Largest Increases in Electricity Prices Came with Largest Decrease in Demand"?