

Charts of the Week: Monitoring the Situation in Hormuz
It’s an atom’s world, and bits are just livin’ in it; Ridesharing isn’t necessarily caring


America | Tech | Opinion | Culture | Charts

1. Monitoring the Situation in Hormuz
In case you haven’t heard, there’s a kerfuffle in Iran, and it’s causing some disruption to the global supply chain of oil (among other things).
Specifically, ship-traffic through the Strait of Hormuz ground to a halt, beginning last week:
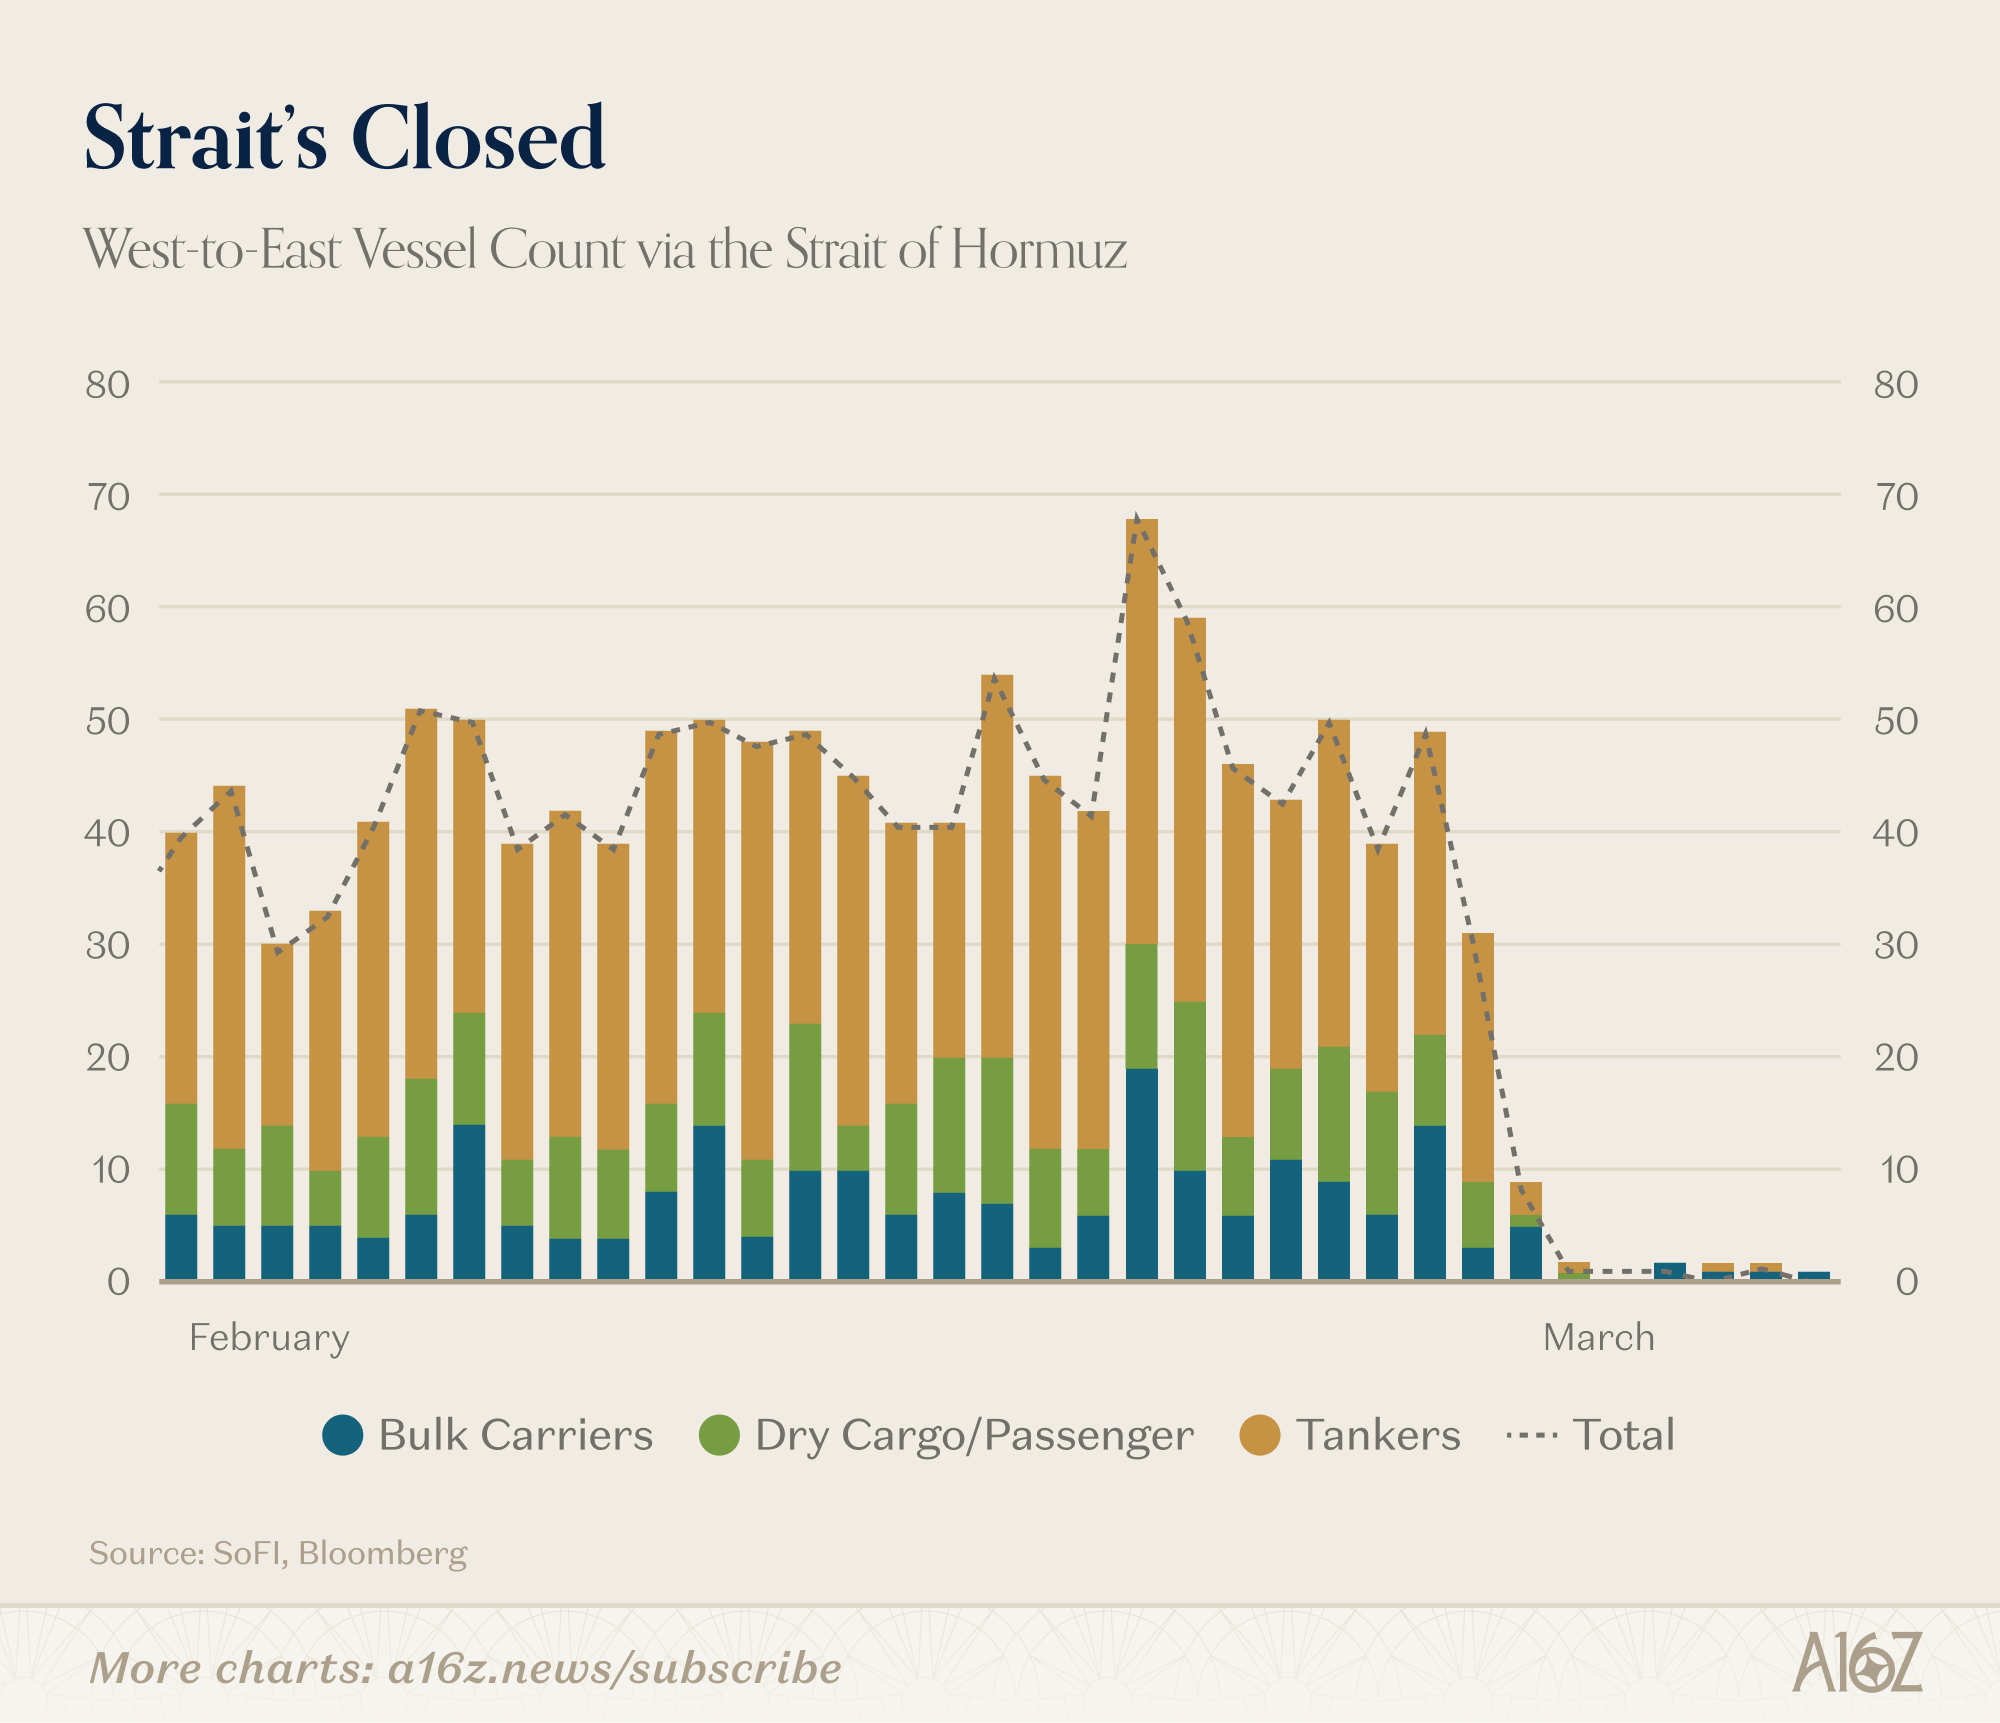
Other than some plucky “bulk carriers,” as of March 1, the vast majority of vessels–most importantly, oil tankers and dry cargo–decided to wait n’ see for a few days.
When ships stop passing through the Strait of Hormuz, it’s a pretty big deal, because it’s one of the more important “choke points” for global trade.
Vast quantities of commodities disembark from the Persian Gulf via the Strait and make their way primarily to Asian markets, with ~80%+ of the cargo traveling to China, India, Japan and South Korea:
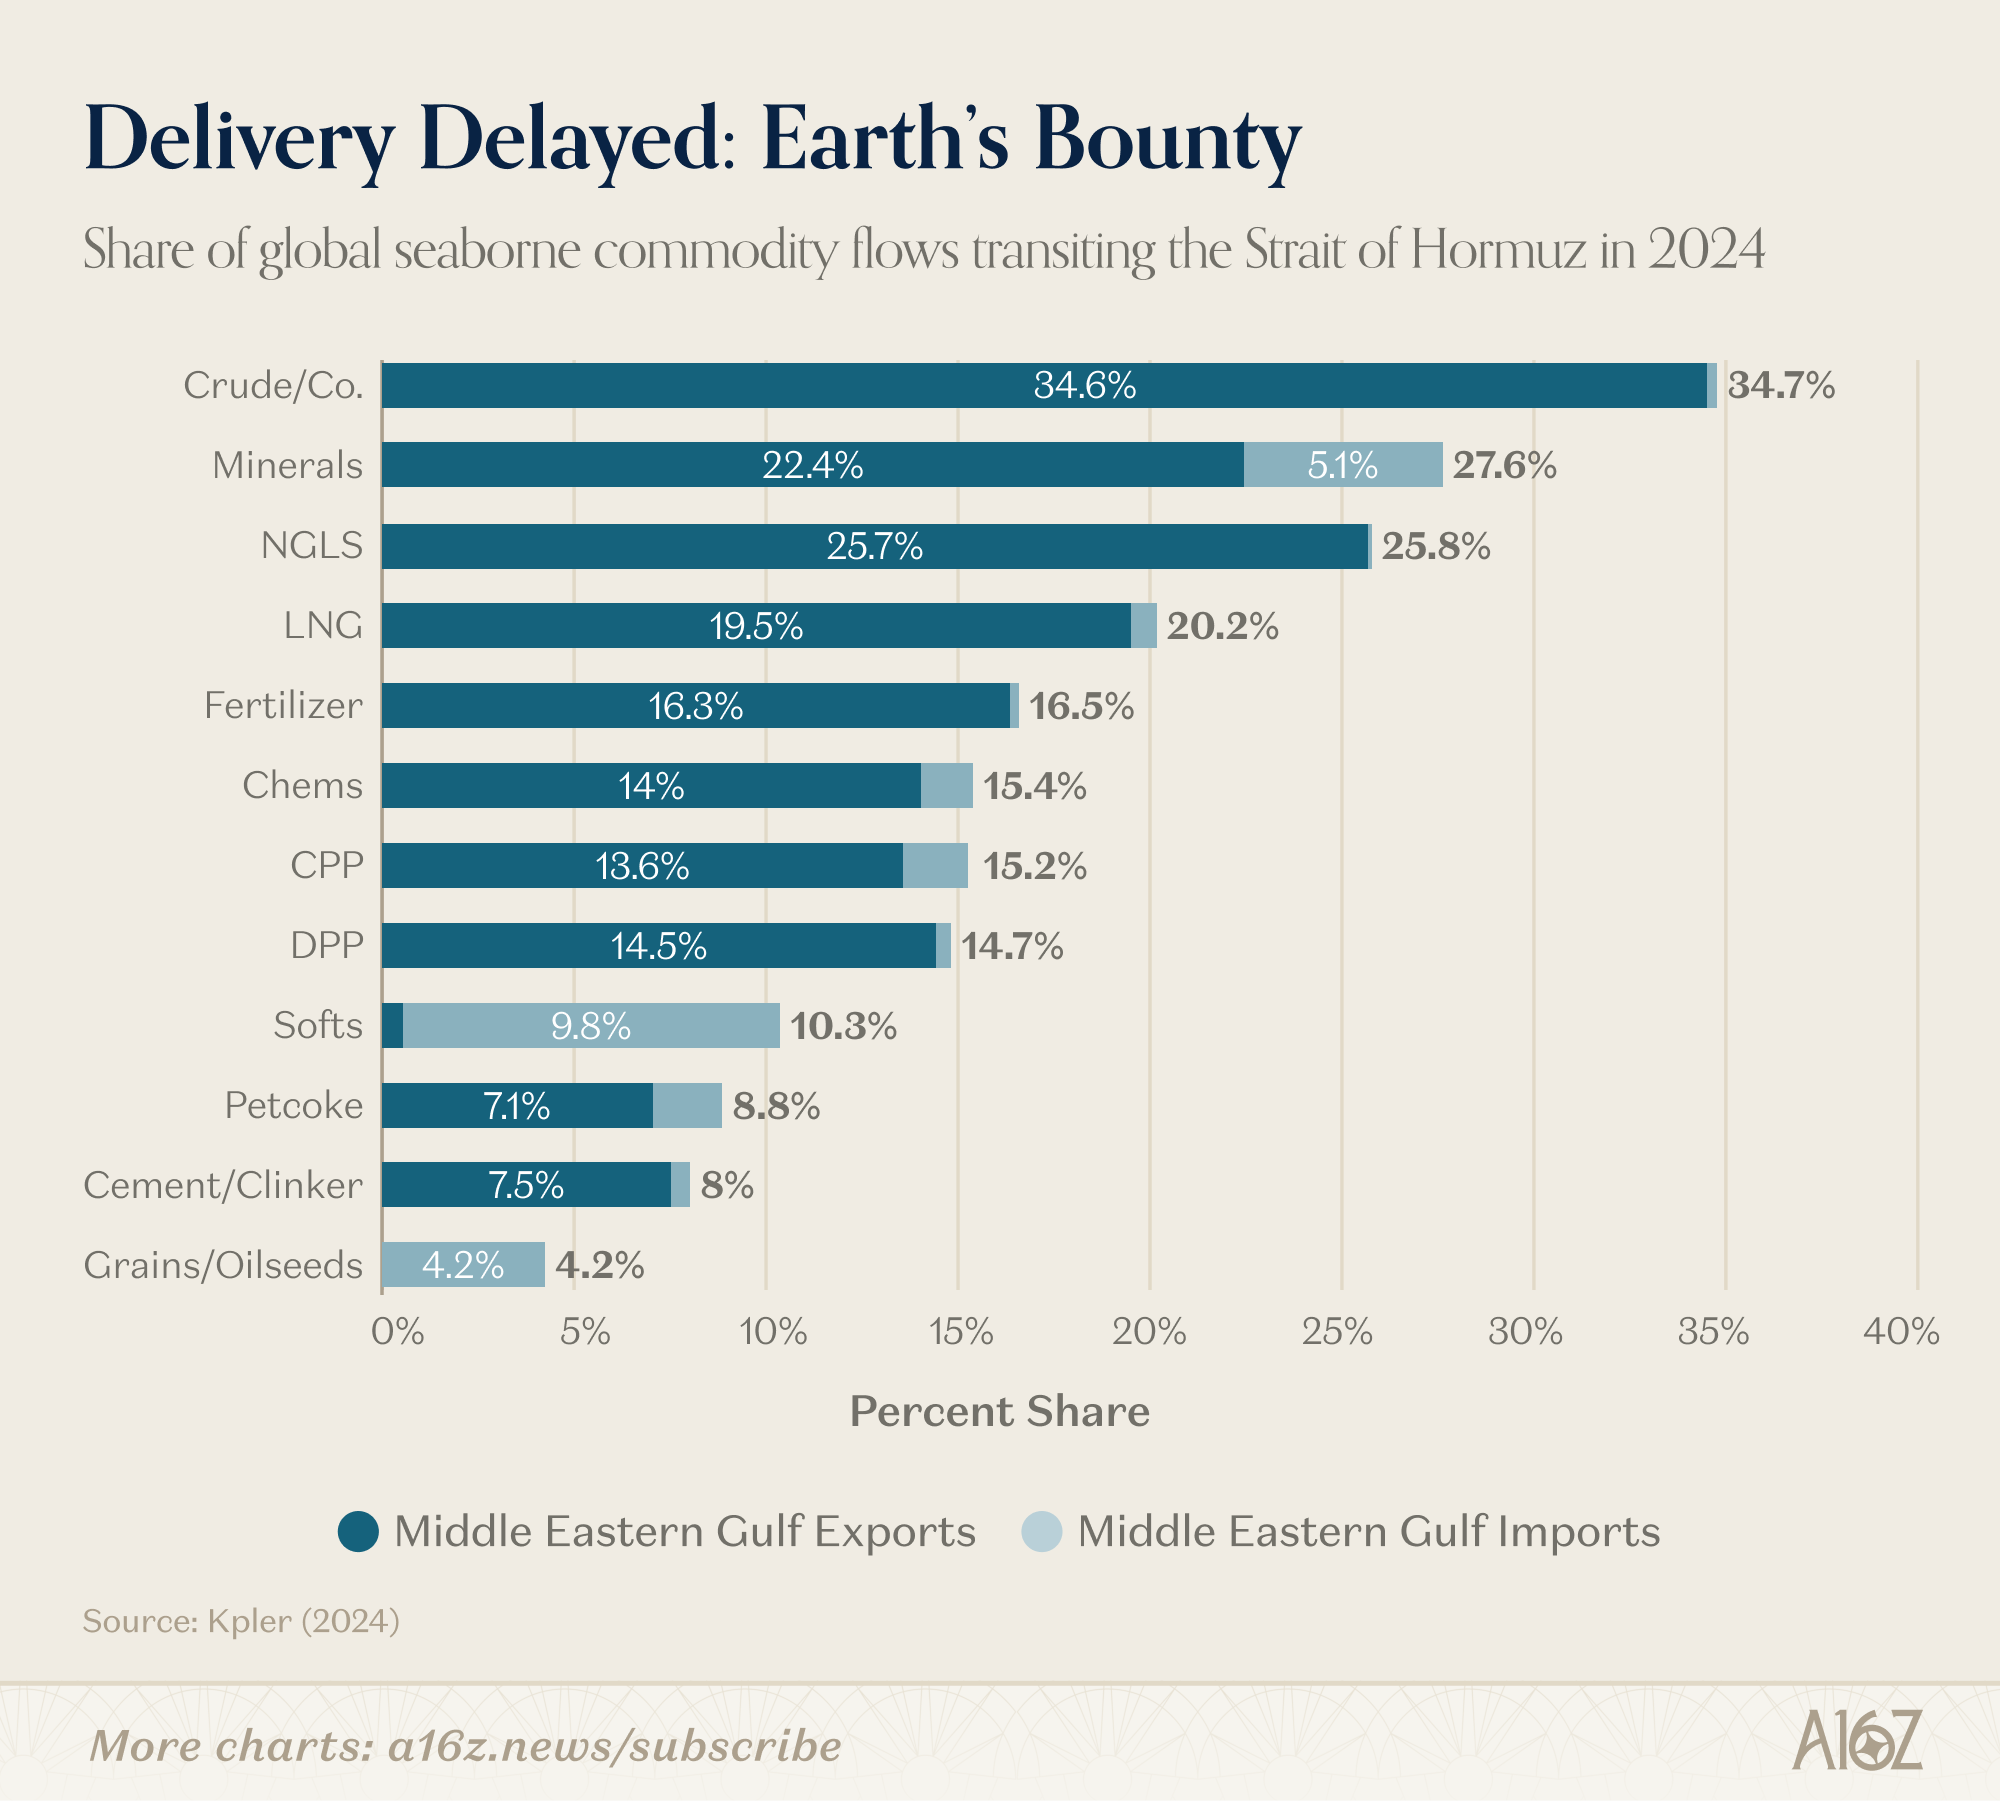
As a share of seaborne commodities that pass through the Strait, we’re talking:
~34% of the world’s oil,
~22% of the world’s minerals, and
~16% of world’s fertilizer
. . . plus a whole bunch of other important things, like jet fuel, aluminum, and a slew of chemicals.
Now, the possibility that the traffic through the Strait would be disrupted by a war with Iran was neither a surprise nor a secret. Commodity prices had already begun their ascent towards the end of February, and rose even more quickly when the conflict kicked-off in earnest:
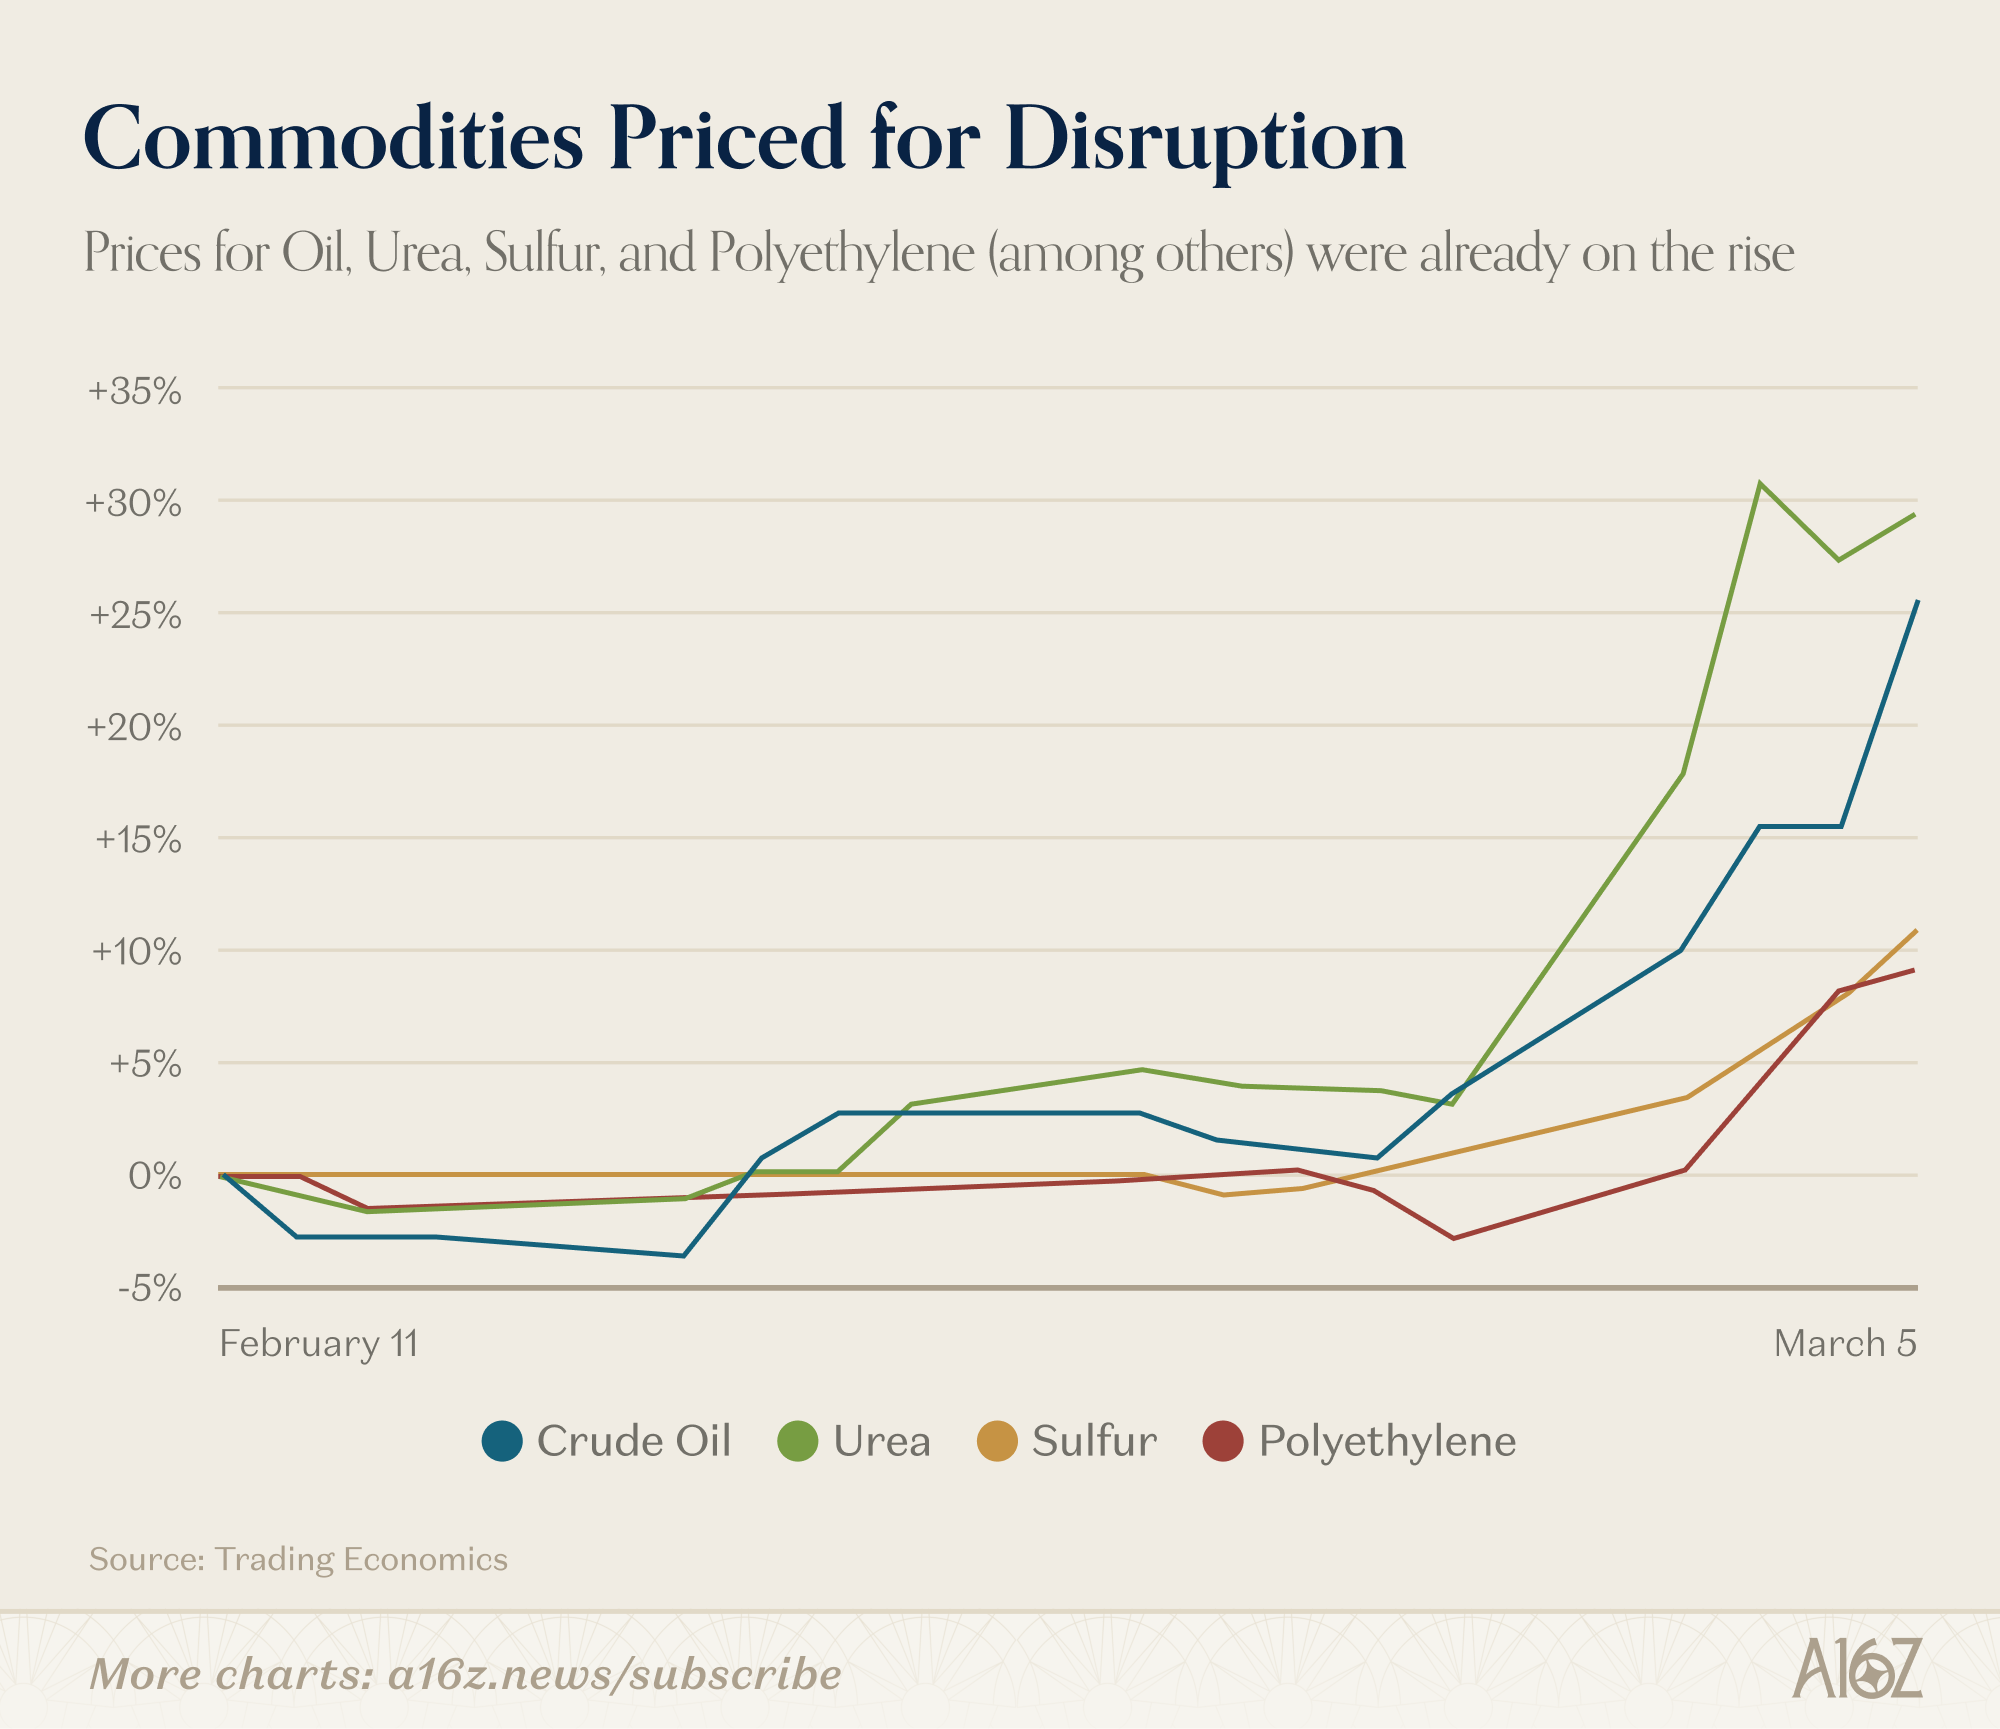
Oil, Urea, Polyethylene, and Sulphur (just to name a few) all inflected upwards to varying degrees, on Feb. 28th, as markets priced-in (at least partly) potential disruption to the Strait. The price increases became steeper by March 2, when it was clear that ships were not passing the Strait.


Professional investors are pretty smart sometimes. They know what moves their markets, and when a war breaks out, the relevant commodity markets tend to react pretty quickly.
That’s interesting so far as it goes, but what happened next is really striking.
Over the weekend, the Strait of Hormuz escaped professional commodity trader containment, and took over the timeline. The Situation Monitors reported for duty, and got up to speed quickly:
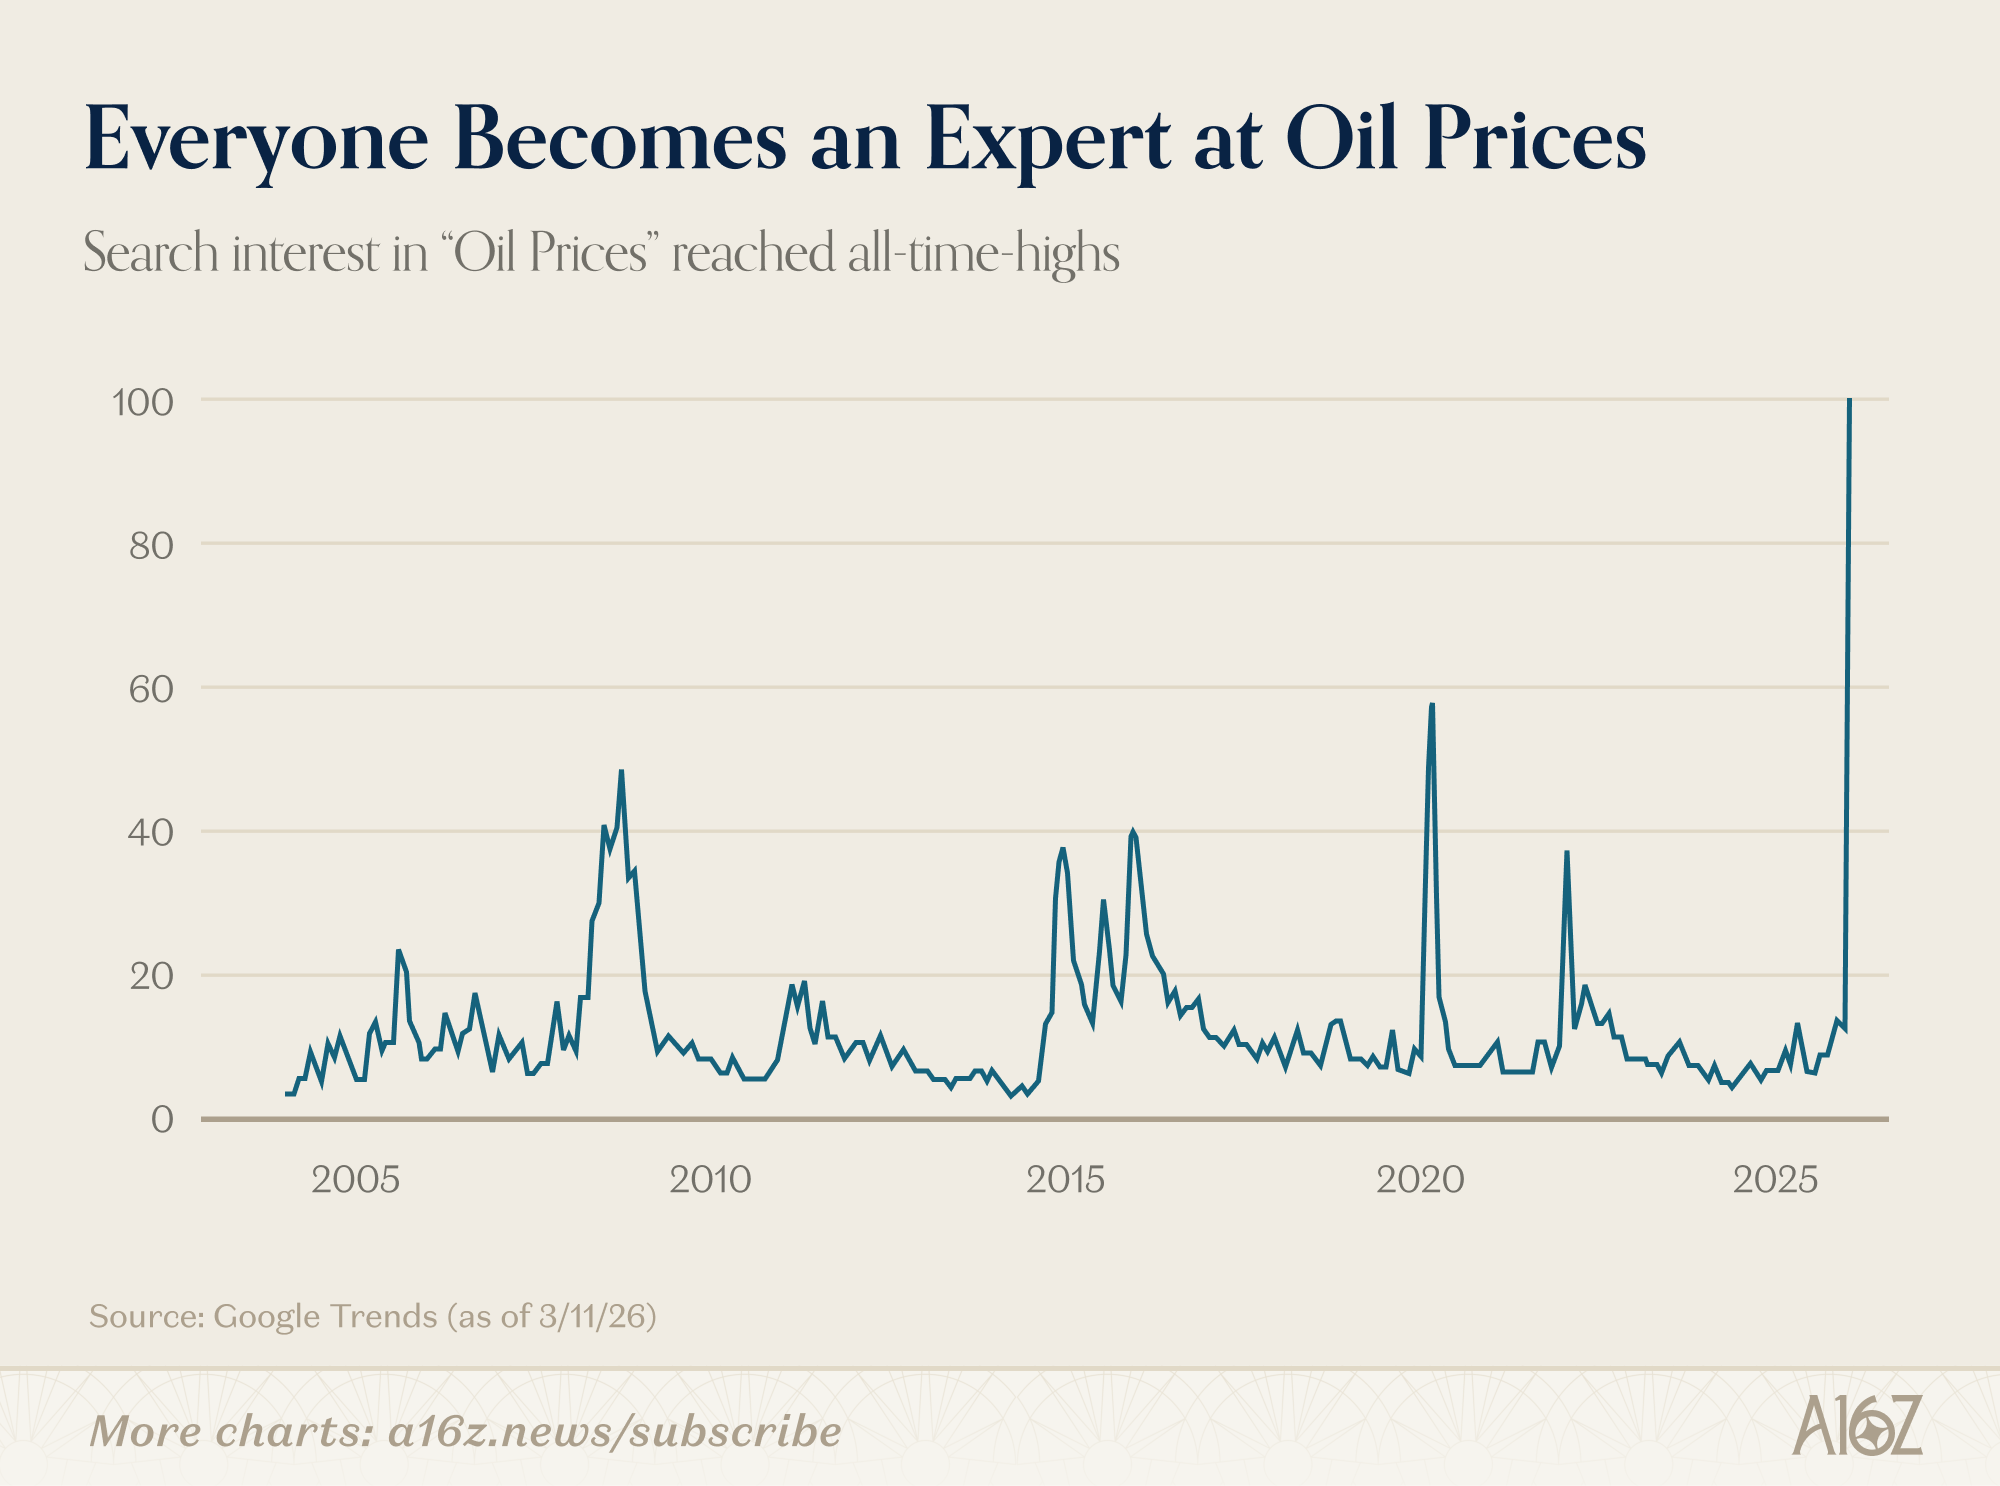
Google trends is a noisy dataset, but the spike in search interest for “oil prices” is still a thing to behold.
With everyone suddenly graduating to boss-tier oil trader, oil prices set their own atmospheric pace (if only for a moment):
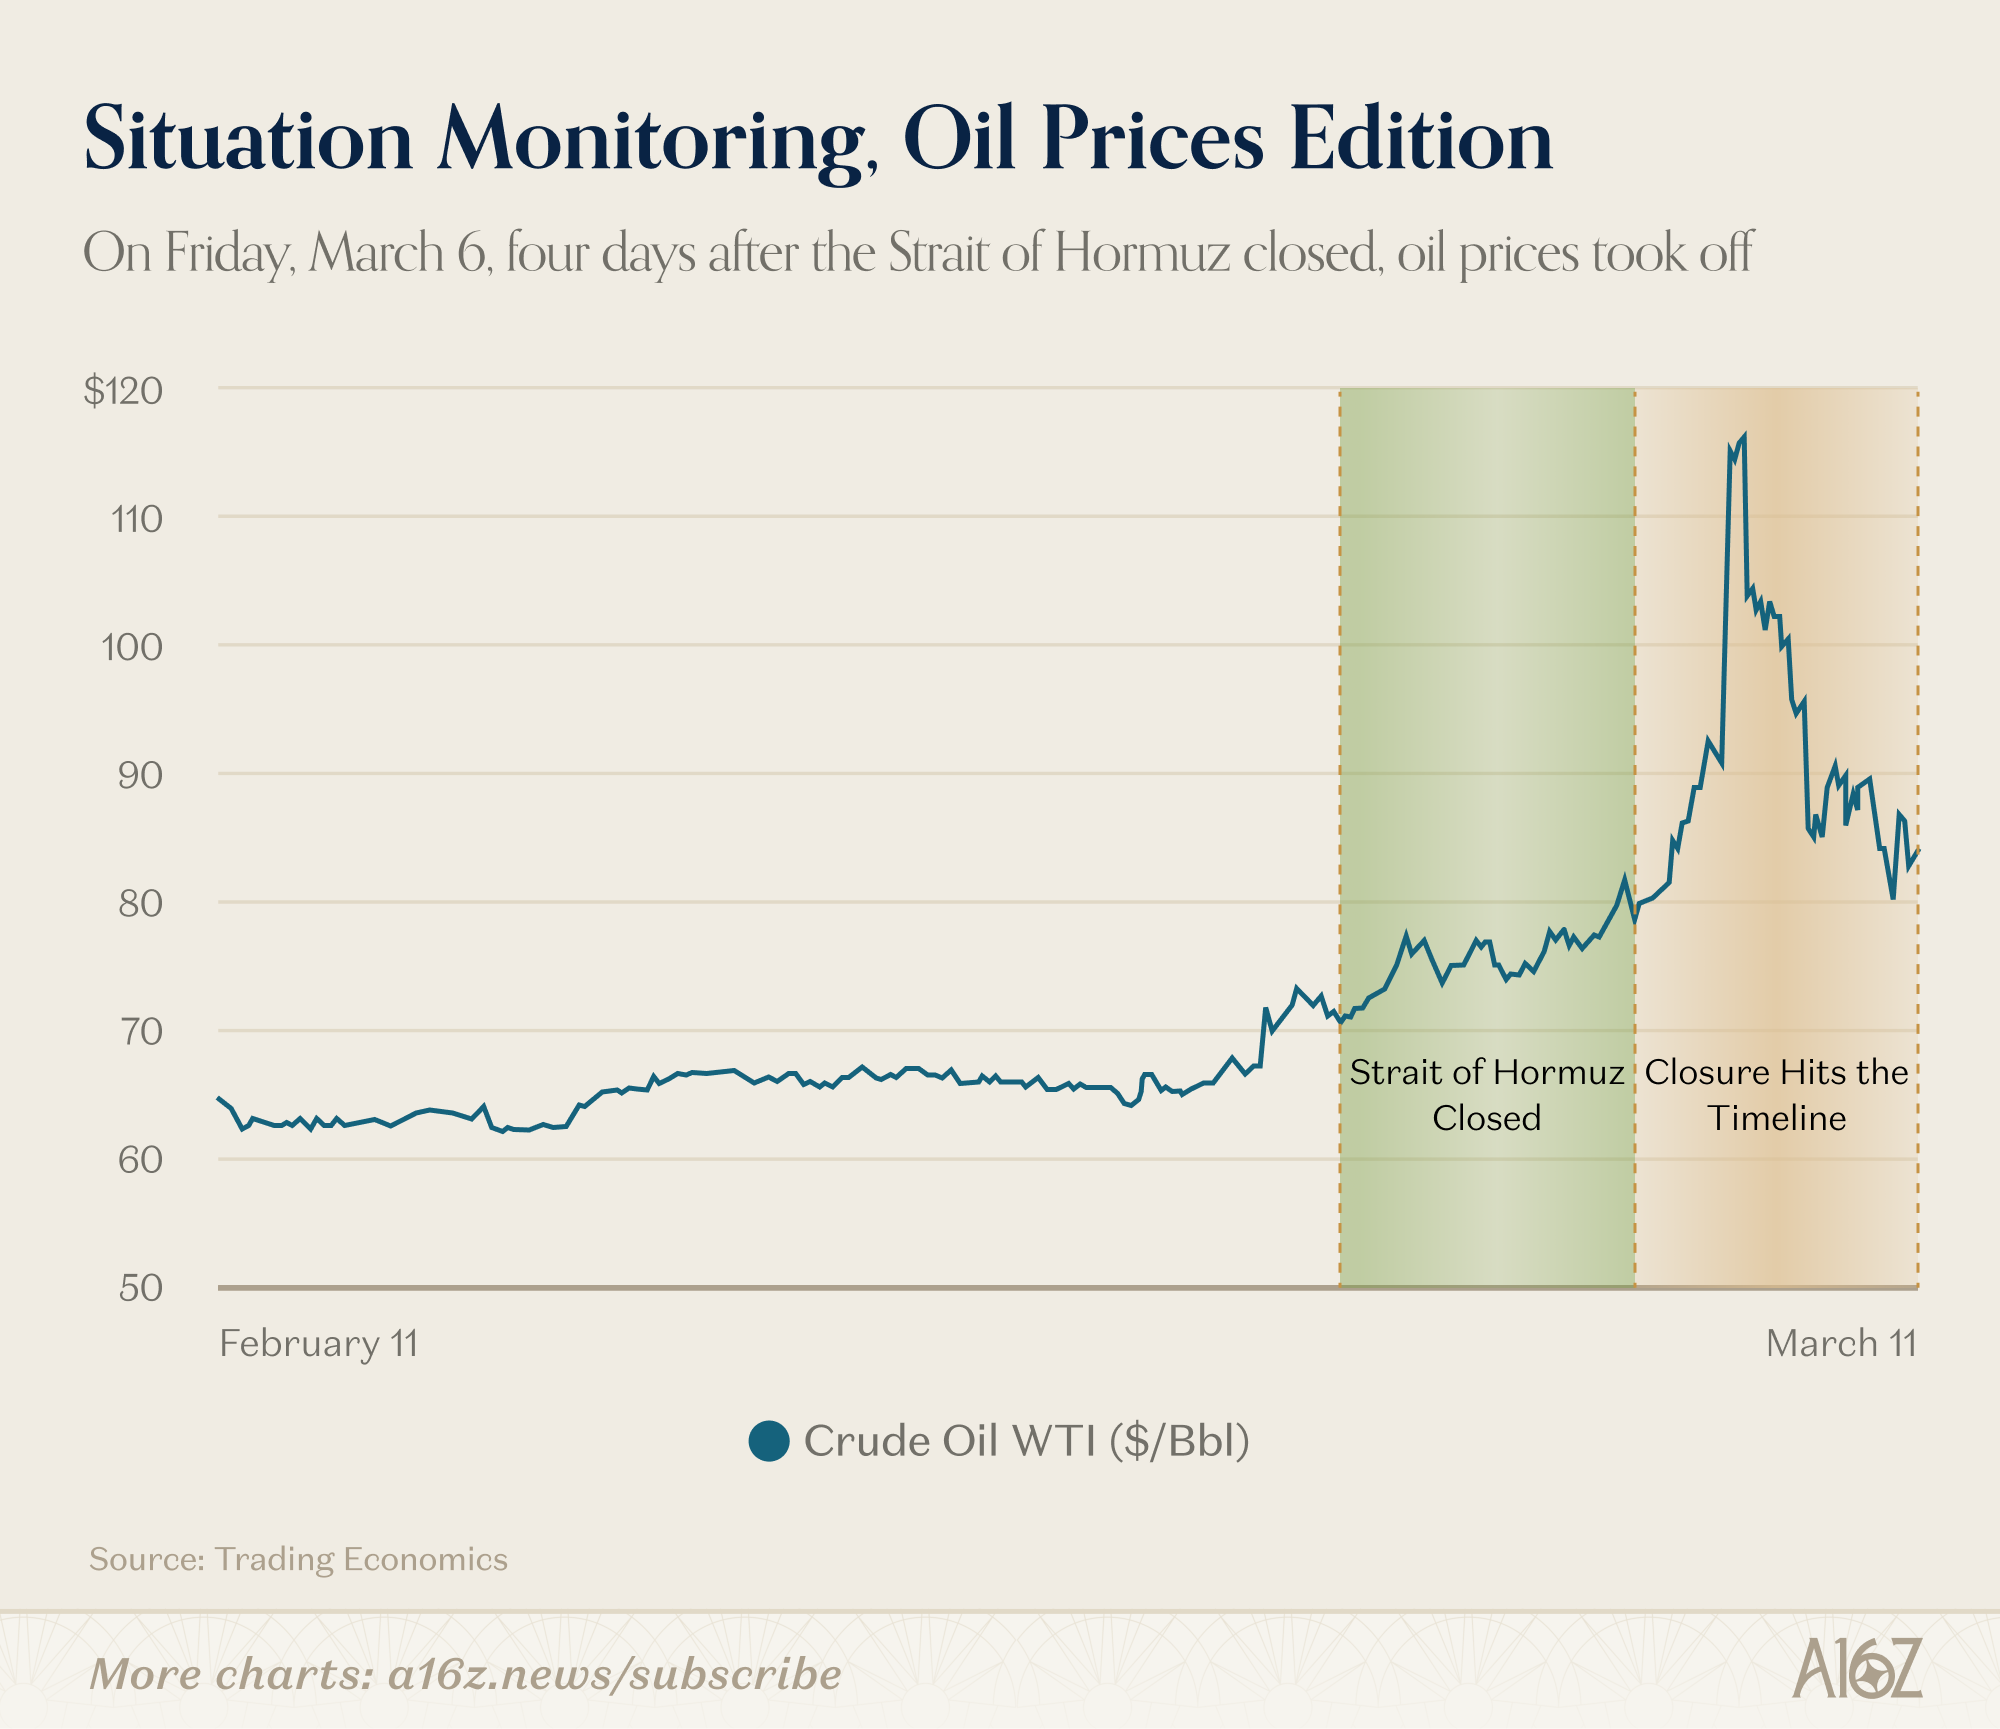
Beginning March 6—four days after the Strait of Hormuz was closed—the price of oil went parabolic, spiking nearly 45% over the weekend through its March 9th peak.
The US Oil Fund, which invests primarily in oil futures, experienced historic levels of volume on Monday March 9:
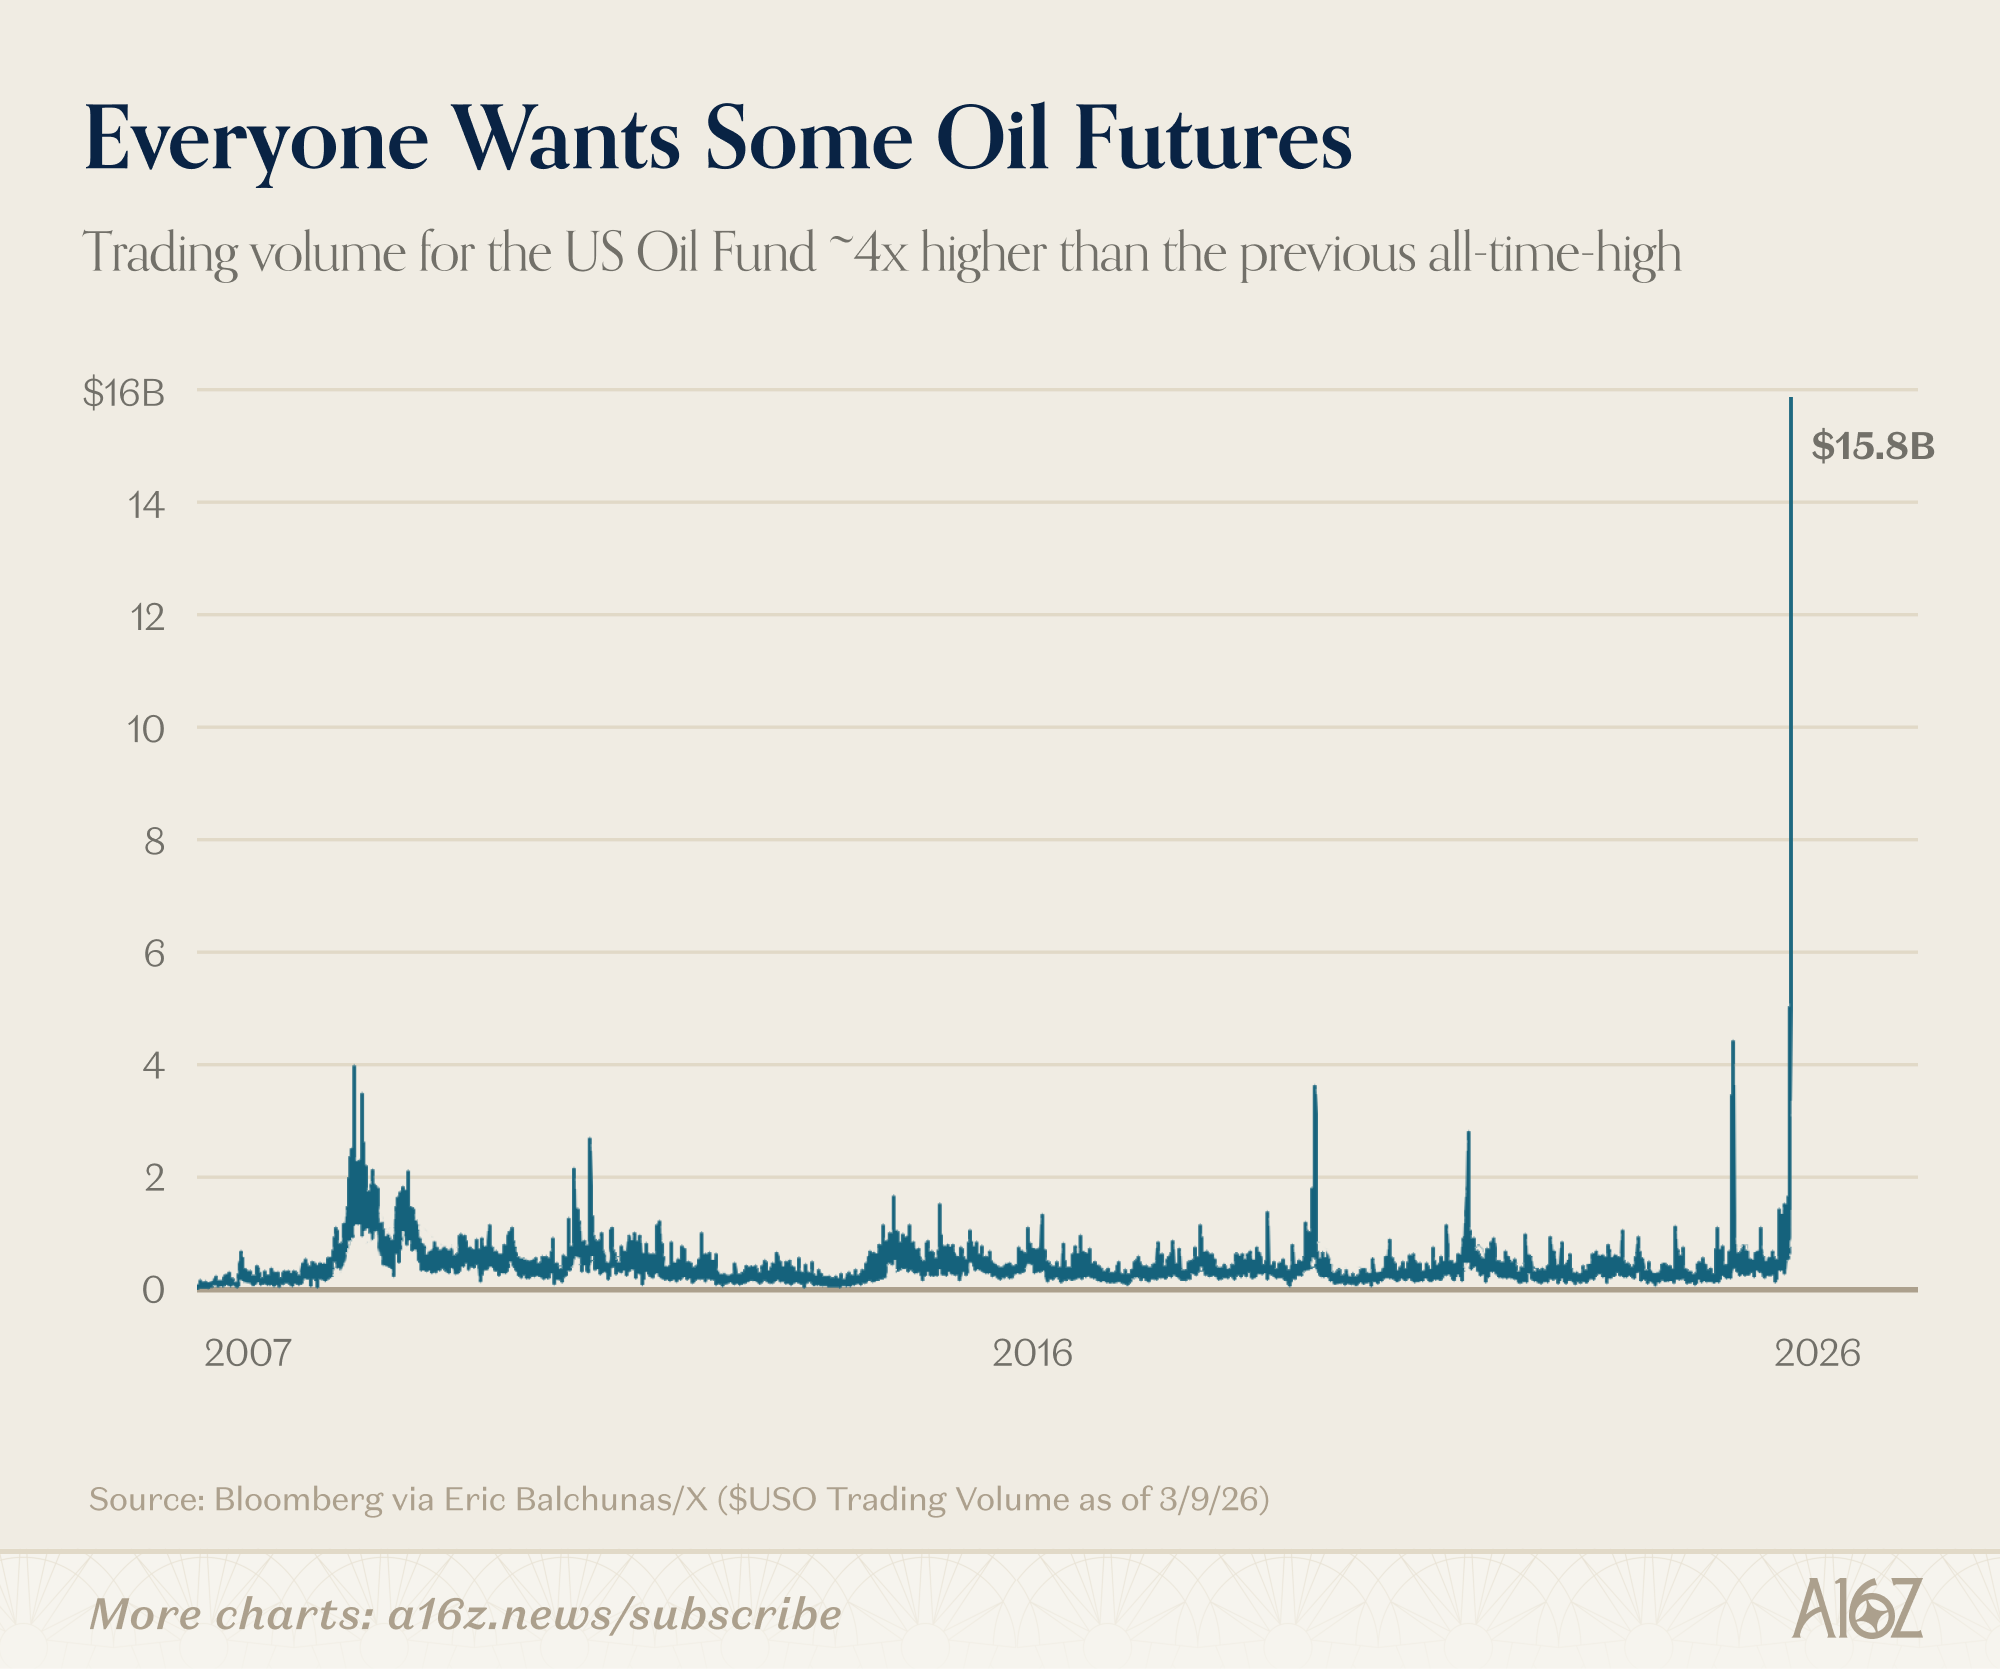
That’s nearly $16B in $USO traded in a single day:
nearly 4x the volume of last year’s Israel-Iran conflict, and
more than 4x the volume of the Pandemic outbreak, back in 2020.
That’s unprecedented action for a security that rarely (if ever) makes headlines. The net result of all that trading, however, is that oil ultimately landed right back where it started, slightly north of $80/barrel, with a ~$35 price swing, up and down, over a mere 48 hours.
So much trading, and so little to show for it.
Now, we don’t yet know for sure who precisely was doing all that trading, but it seems likely that retail was very much a part of the game. Not the whole game, of course, but retail has taken an increasingly outsized role in public markets, trading both equities and options like never before, and they’re doing it (in large part) from their phones . . . y’know, the same place where they do a lot of their situation monitoring.
Did retail meme-stonk oil all the way to $115, only to get rugged at the top by the pros? Again, we’ve got no idea. And, to be fair, oil prices have started to rise again, although at a much more orderly pace. Plus, the Pros make mistakes too.
But, in all events, it’s good to remember that sometimes “the timeline” isn’t the first to know. Professional commodity traders have forgotten more about the Strait of Hormuz than median-fintwit will ever know, so . . . we’re not saying ‘trust the experts,’ but just be careful out there.
2. It’s an atom’s world, and bits are just livin’ in it
Much ink has been spilled over the SaaSpocalypse, and we’re not going to rehash it all here.
You know the gist of it: SaaS is vulnerable because AI is going to eat its lunch. Boo SaaS the queen of garbage, with its SBC, and its seat-based pricing, and its point solutions. Software stocks are the pits!
But, again, the point here is not to re-litigate ‘SaaS: for or against.’ In fact, we’d like you to put aside the merits (or demerits) of the SaaS-bear to appreciate that a much bigger game is (also) afoot.
Behold, the great rotation from asset-heavy to asset-light:
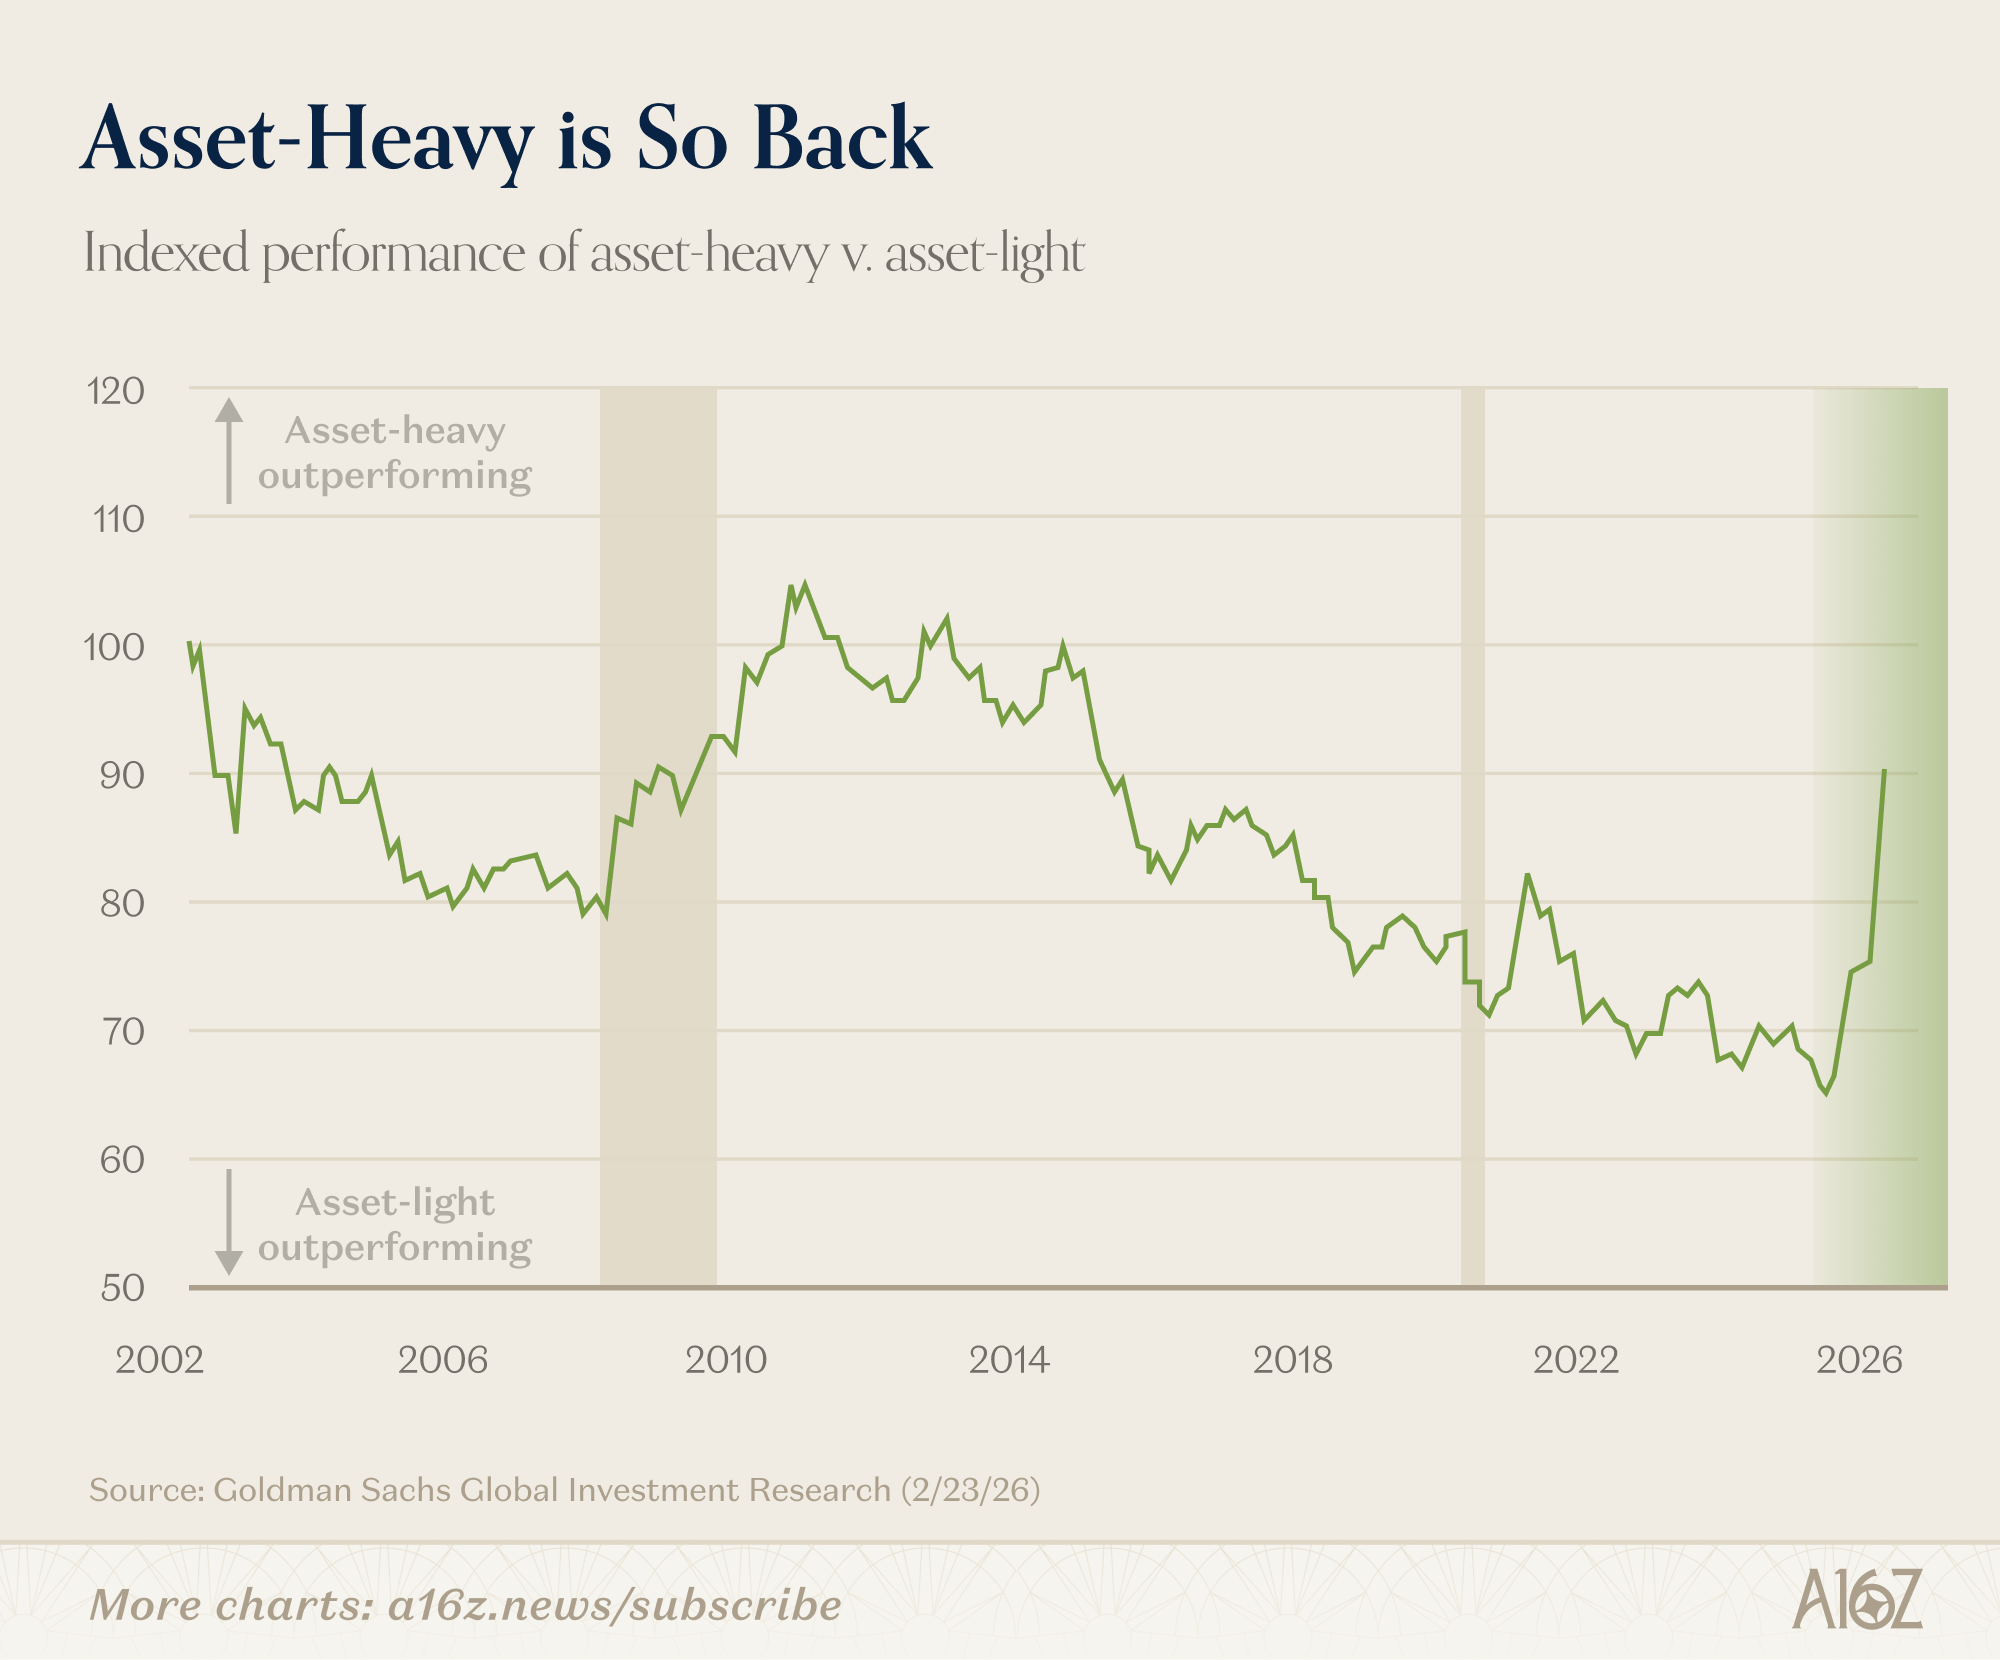
Asset-light stocks have been improving relative to their asset-heavy counterparts for the past ~15-years (and longer, if you exclude the GFC-dislocation), but in 2025, that run came to a dramatic end.
We all know the post-GFC story of tech, and it’s very much a SaaS-driven story. The beauty of software is its capital efficiency. Unlike the stuff-economy (e.g. houses, equipment, factories, machinery, and the like), software replicates at near-zero marginal cost. From an investment perspective, if you wanted to generate a lot of profit per input of capital, software was the best game in town (and asset-lite stocks performed accordingly).
AI, however, has changed the game. Or rather, AI Capex has changed the game.
Regardless of what one thinks of SaaSCos, the fact is that all those hundreds of billions (and soon to be trillions) of dollars flowing to AI infrastructure have turned capital-intensive businesses into profit-generating machines—profits that are, in large part, paid-for out of techco profits themselves.
Just on a current free cash flow basis, the difference between atoms and bits is striking (to put it mildly):
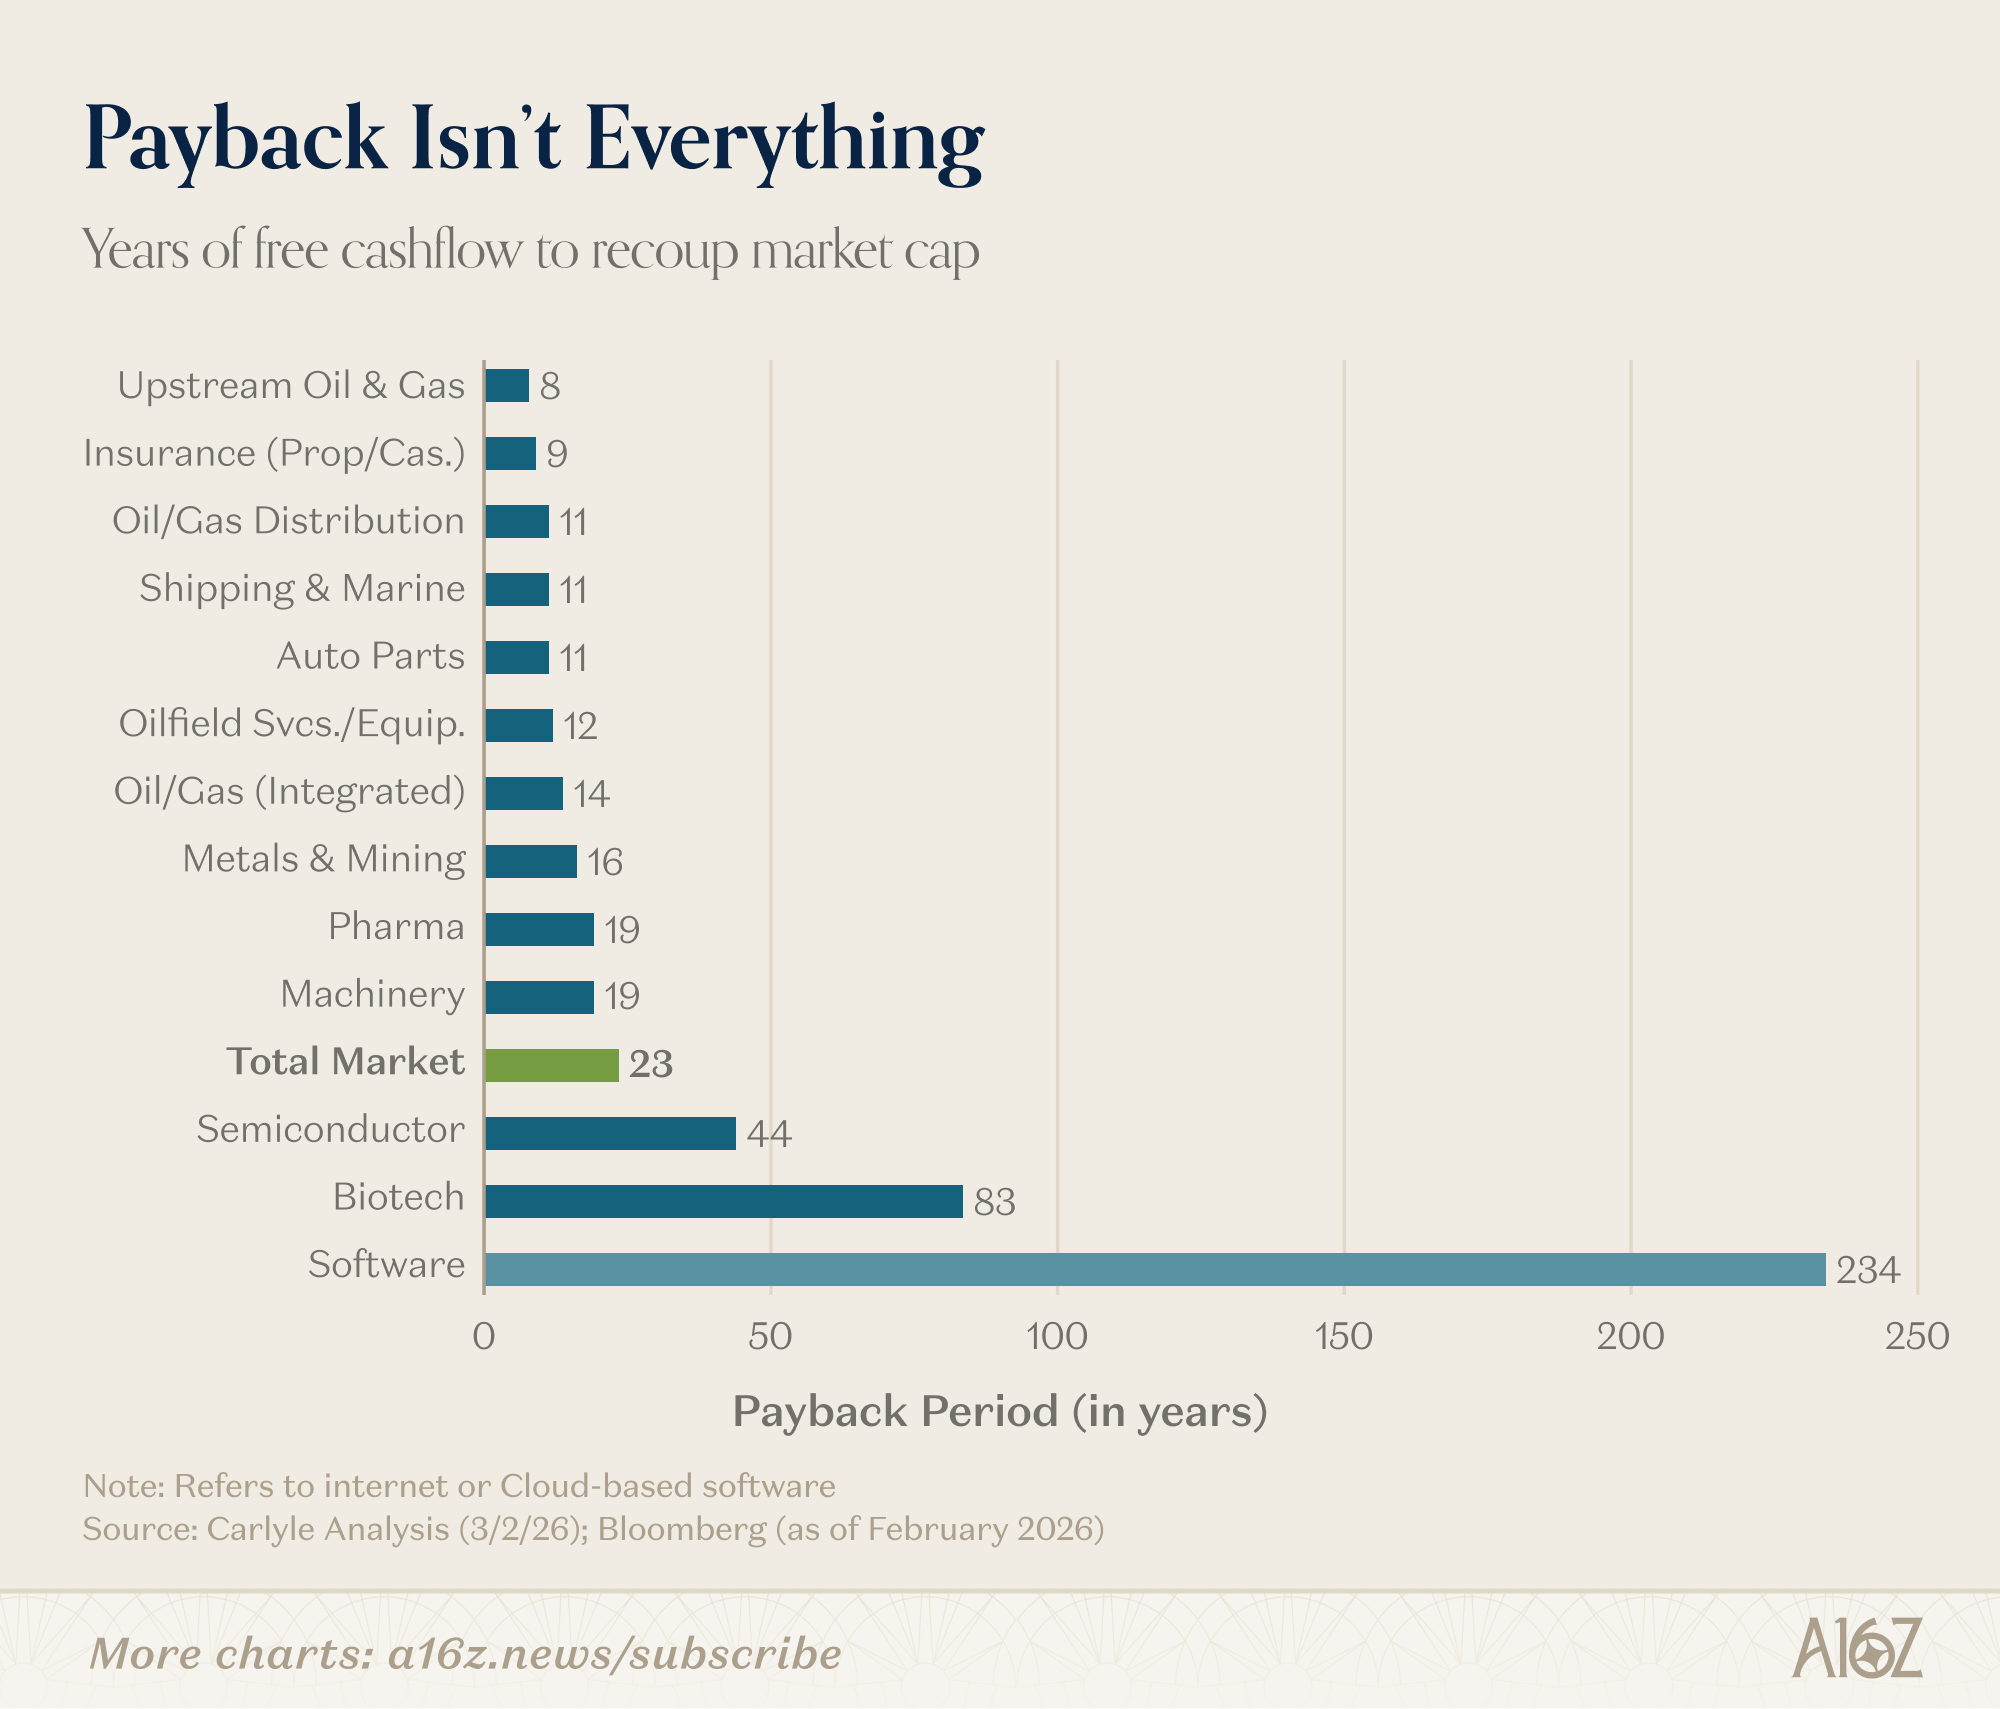
Taking this at face-value (and yes, there are reasons why this comparison isn’t fair), it would take more than 10x longer for software businesses to “payback” their current market caps with their current free cash flow, relative to the more industrial parts of the economy. That sort of thing will happen when a massive chunk of tech’s free cash flow gets plowed straight into the industrial parts of the economy.
From semis to turbines to liquid cooling, and all the way to the companies that provide uniforms for industrial workers, historic levels of dollars are pouring into the world of atoms. That’s a very big change and markets have noticed. Suddenly, all that capital-intensity doesn’t look quite as bad, given the amount of fresh demand for capital-intensive stuff.
Risk capital is rotating to where it can find the best yields, and $800B (or whatever) in Capex is going to generate some yields—for Nvidia we’ve seen, but also elsewhere:
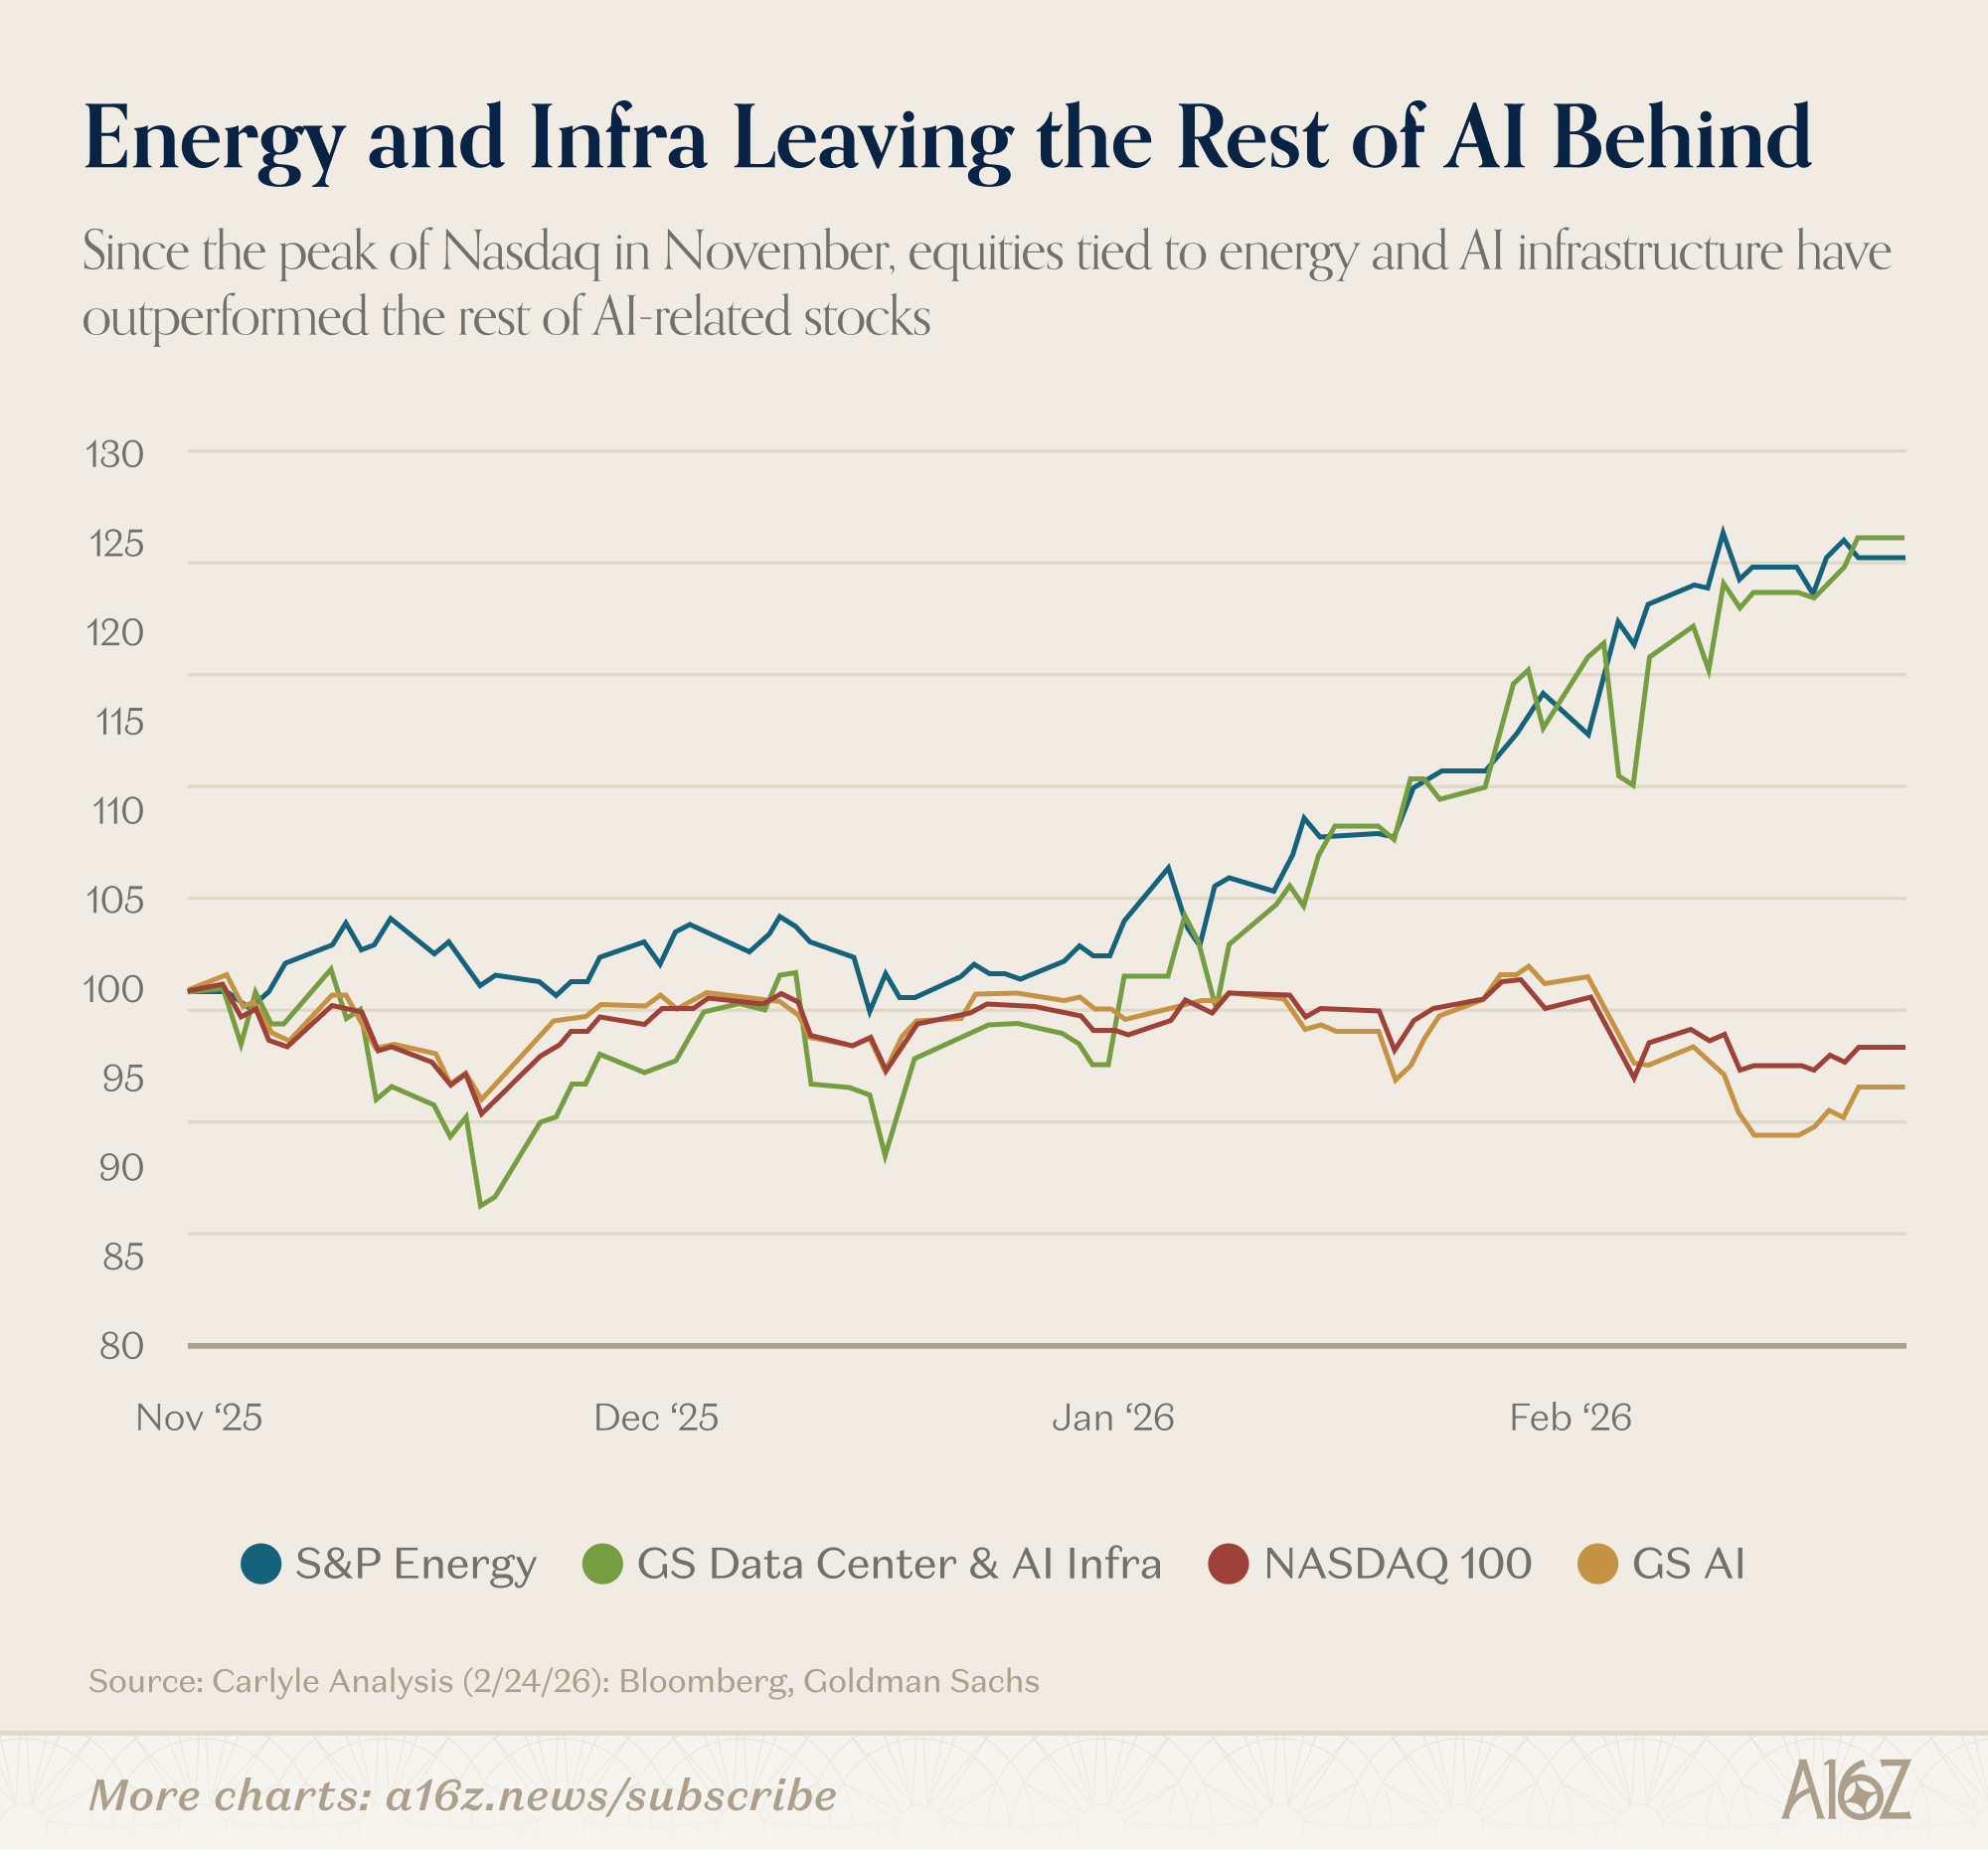
Since November, energy- and AI infrastructure-related stocks have increased substantially, while both the Nasdaq100 and the Goldman Sachs’ “AI beneficiaries” basket have been flat-to-down.
In other words, the field-flip in favor of capital-heavy isn’t just a function of the ‘saas-bear’ capital-light software selloff. It’s that capital-heavy businesses have become much more attractive in their own right. Instead of the “old” economy investing in tech, it’s now tech investing in the old economy.
You might even say that we’ve entered a new regime (for now, at least), and it’s a bit like the old regime. Capital-intensive stuff-makers are back in the driver’s seat, which is pretty remarkable, considering that that really hasn’t been true for pretty much the entirety of the 21st Century.
3. Ridesharing isn’t necessarily caring
By one estimate, average hourly pay for Uber/Lyft drivers is very close to an all-time-high:
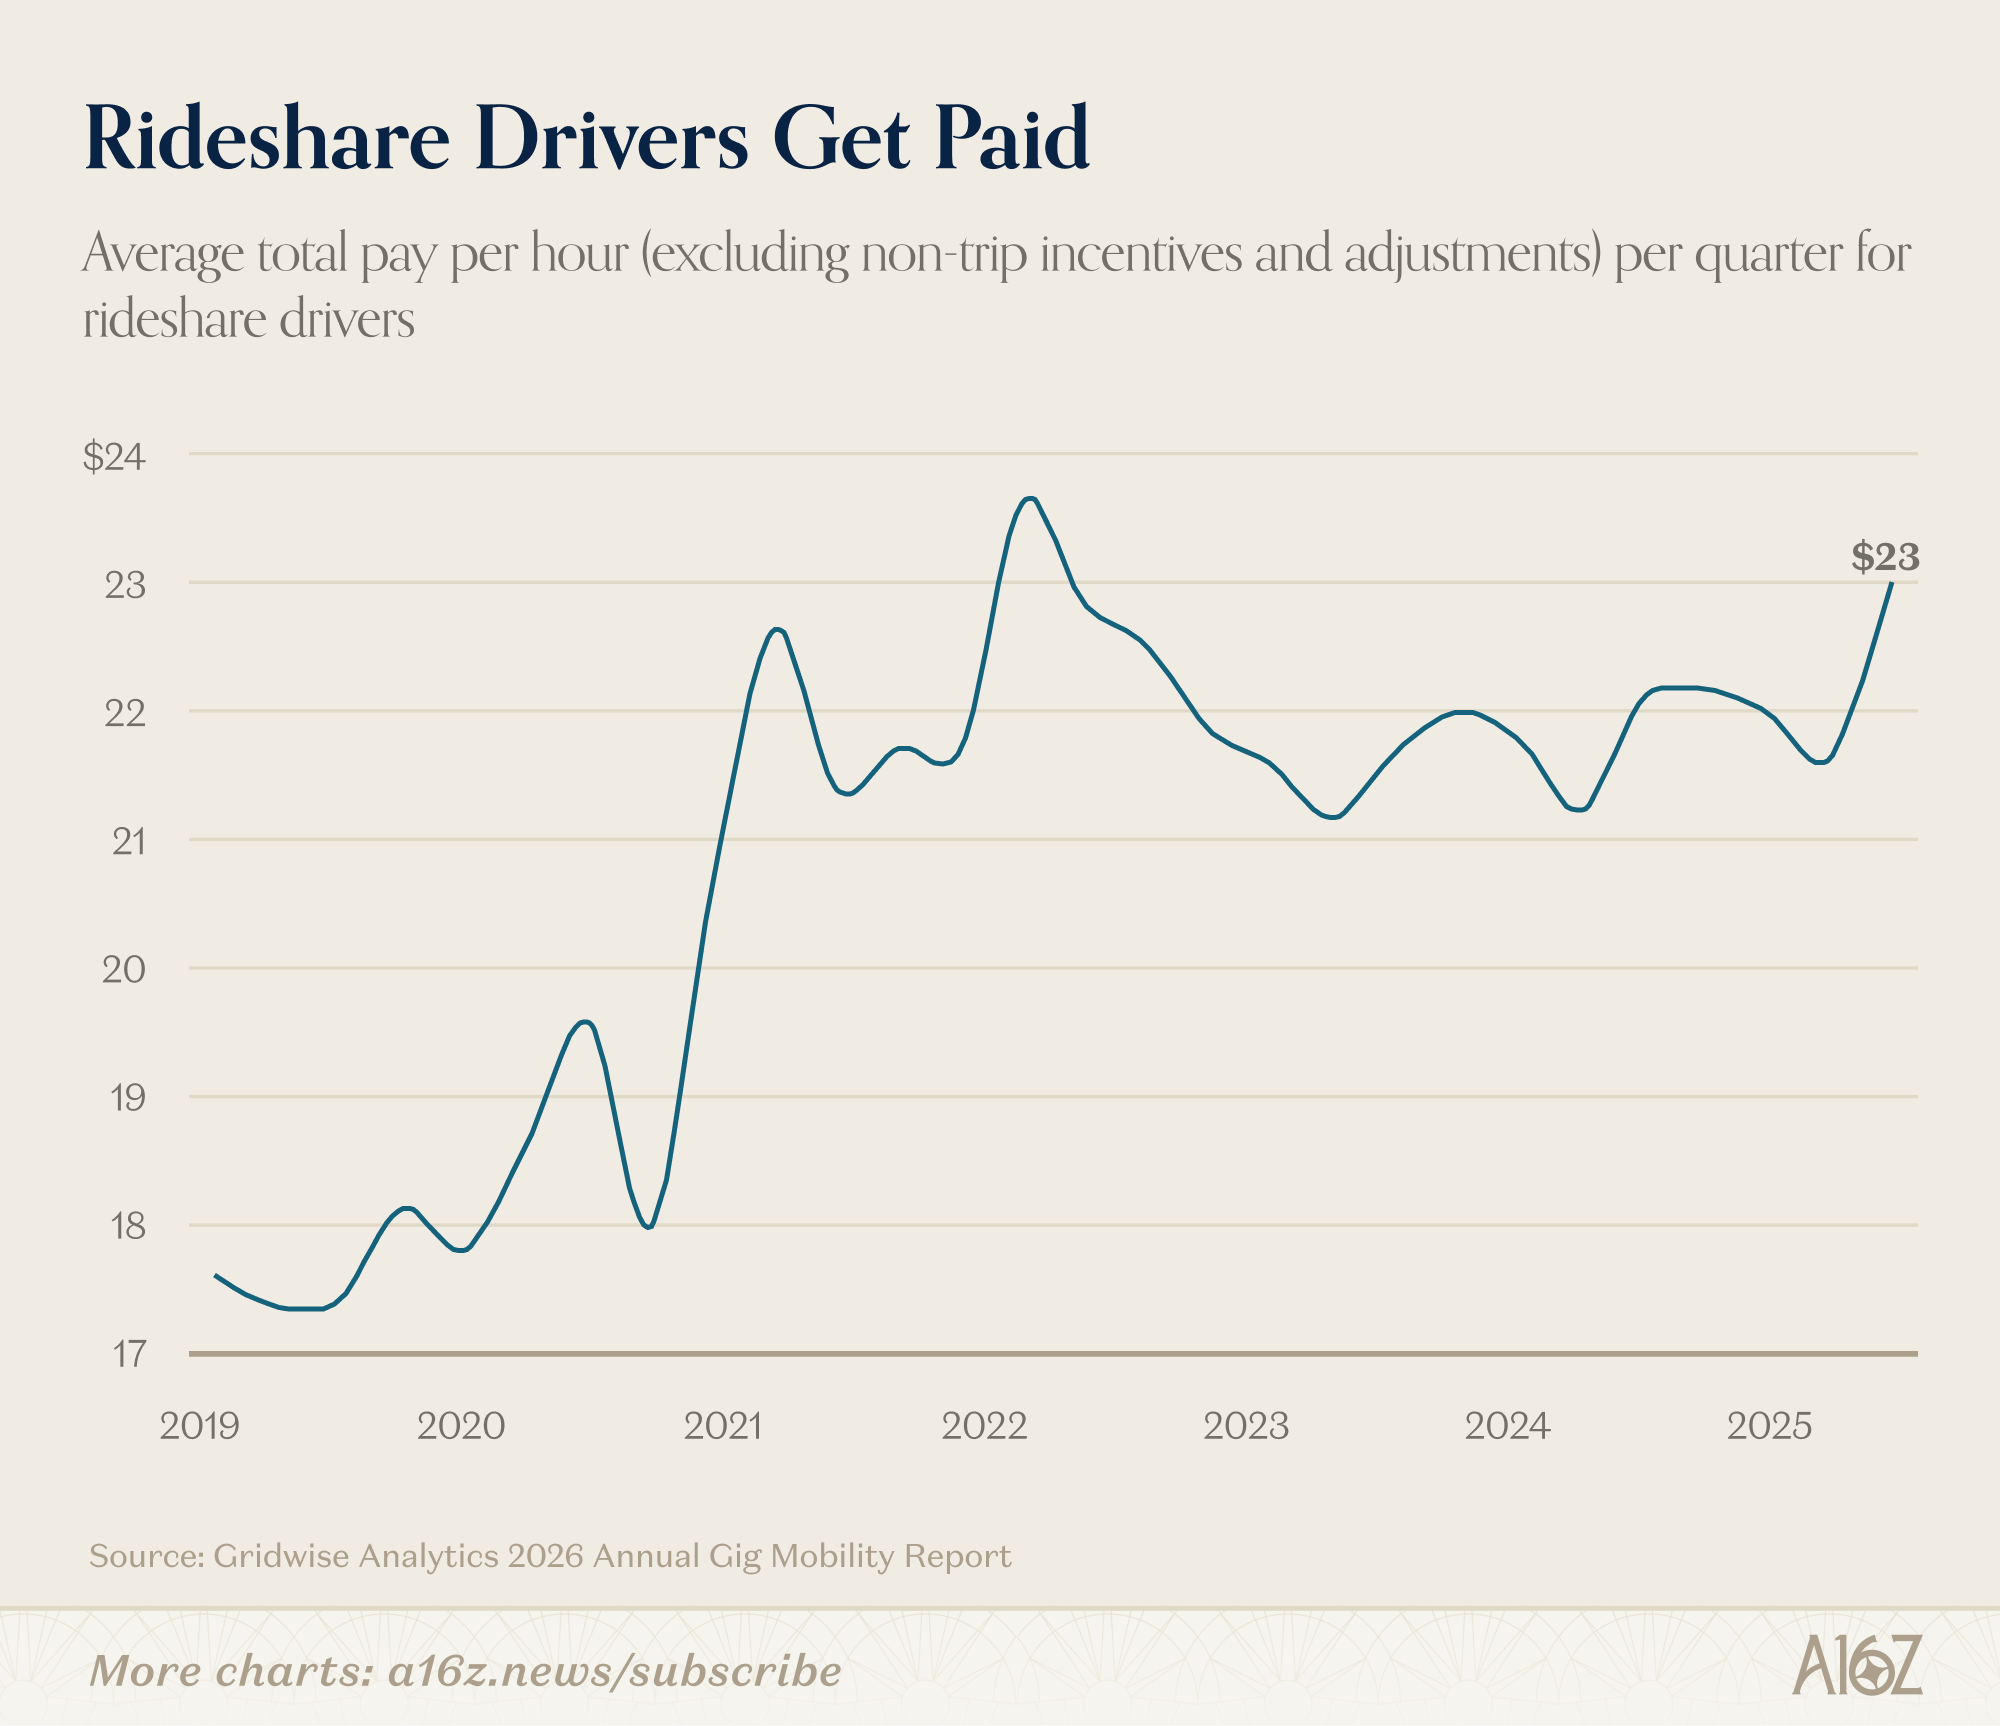
At $23/hr, rideshare drivers are making just under the ZIRP-era peak of 2022.
Presumably, the $23/hr is gross pay, so it doesn’t account for expenses, but at least on that one dimension, life is relatively better for Uber/Lyft drivers.
Interestingly, however, according to that same data and analysis, platform fees (and platform rates) have grown far more quickly than either driver-pay or the customer price-per-trip:
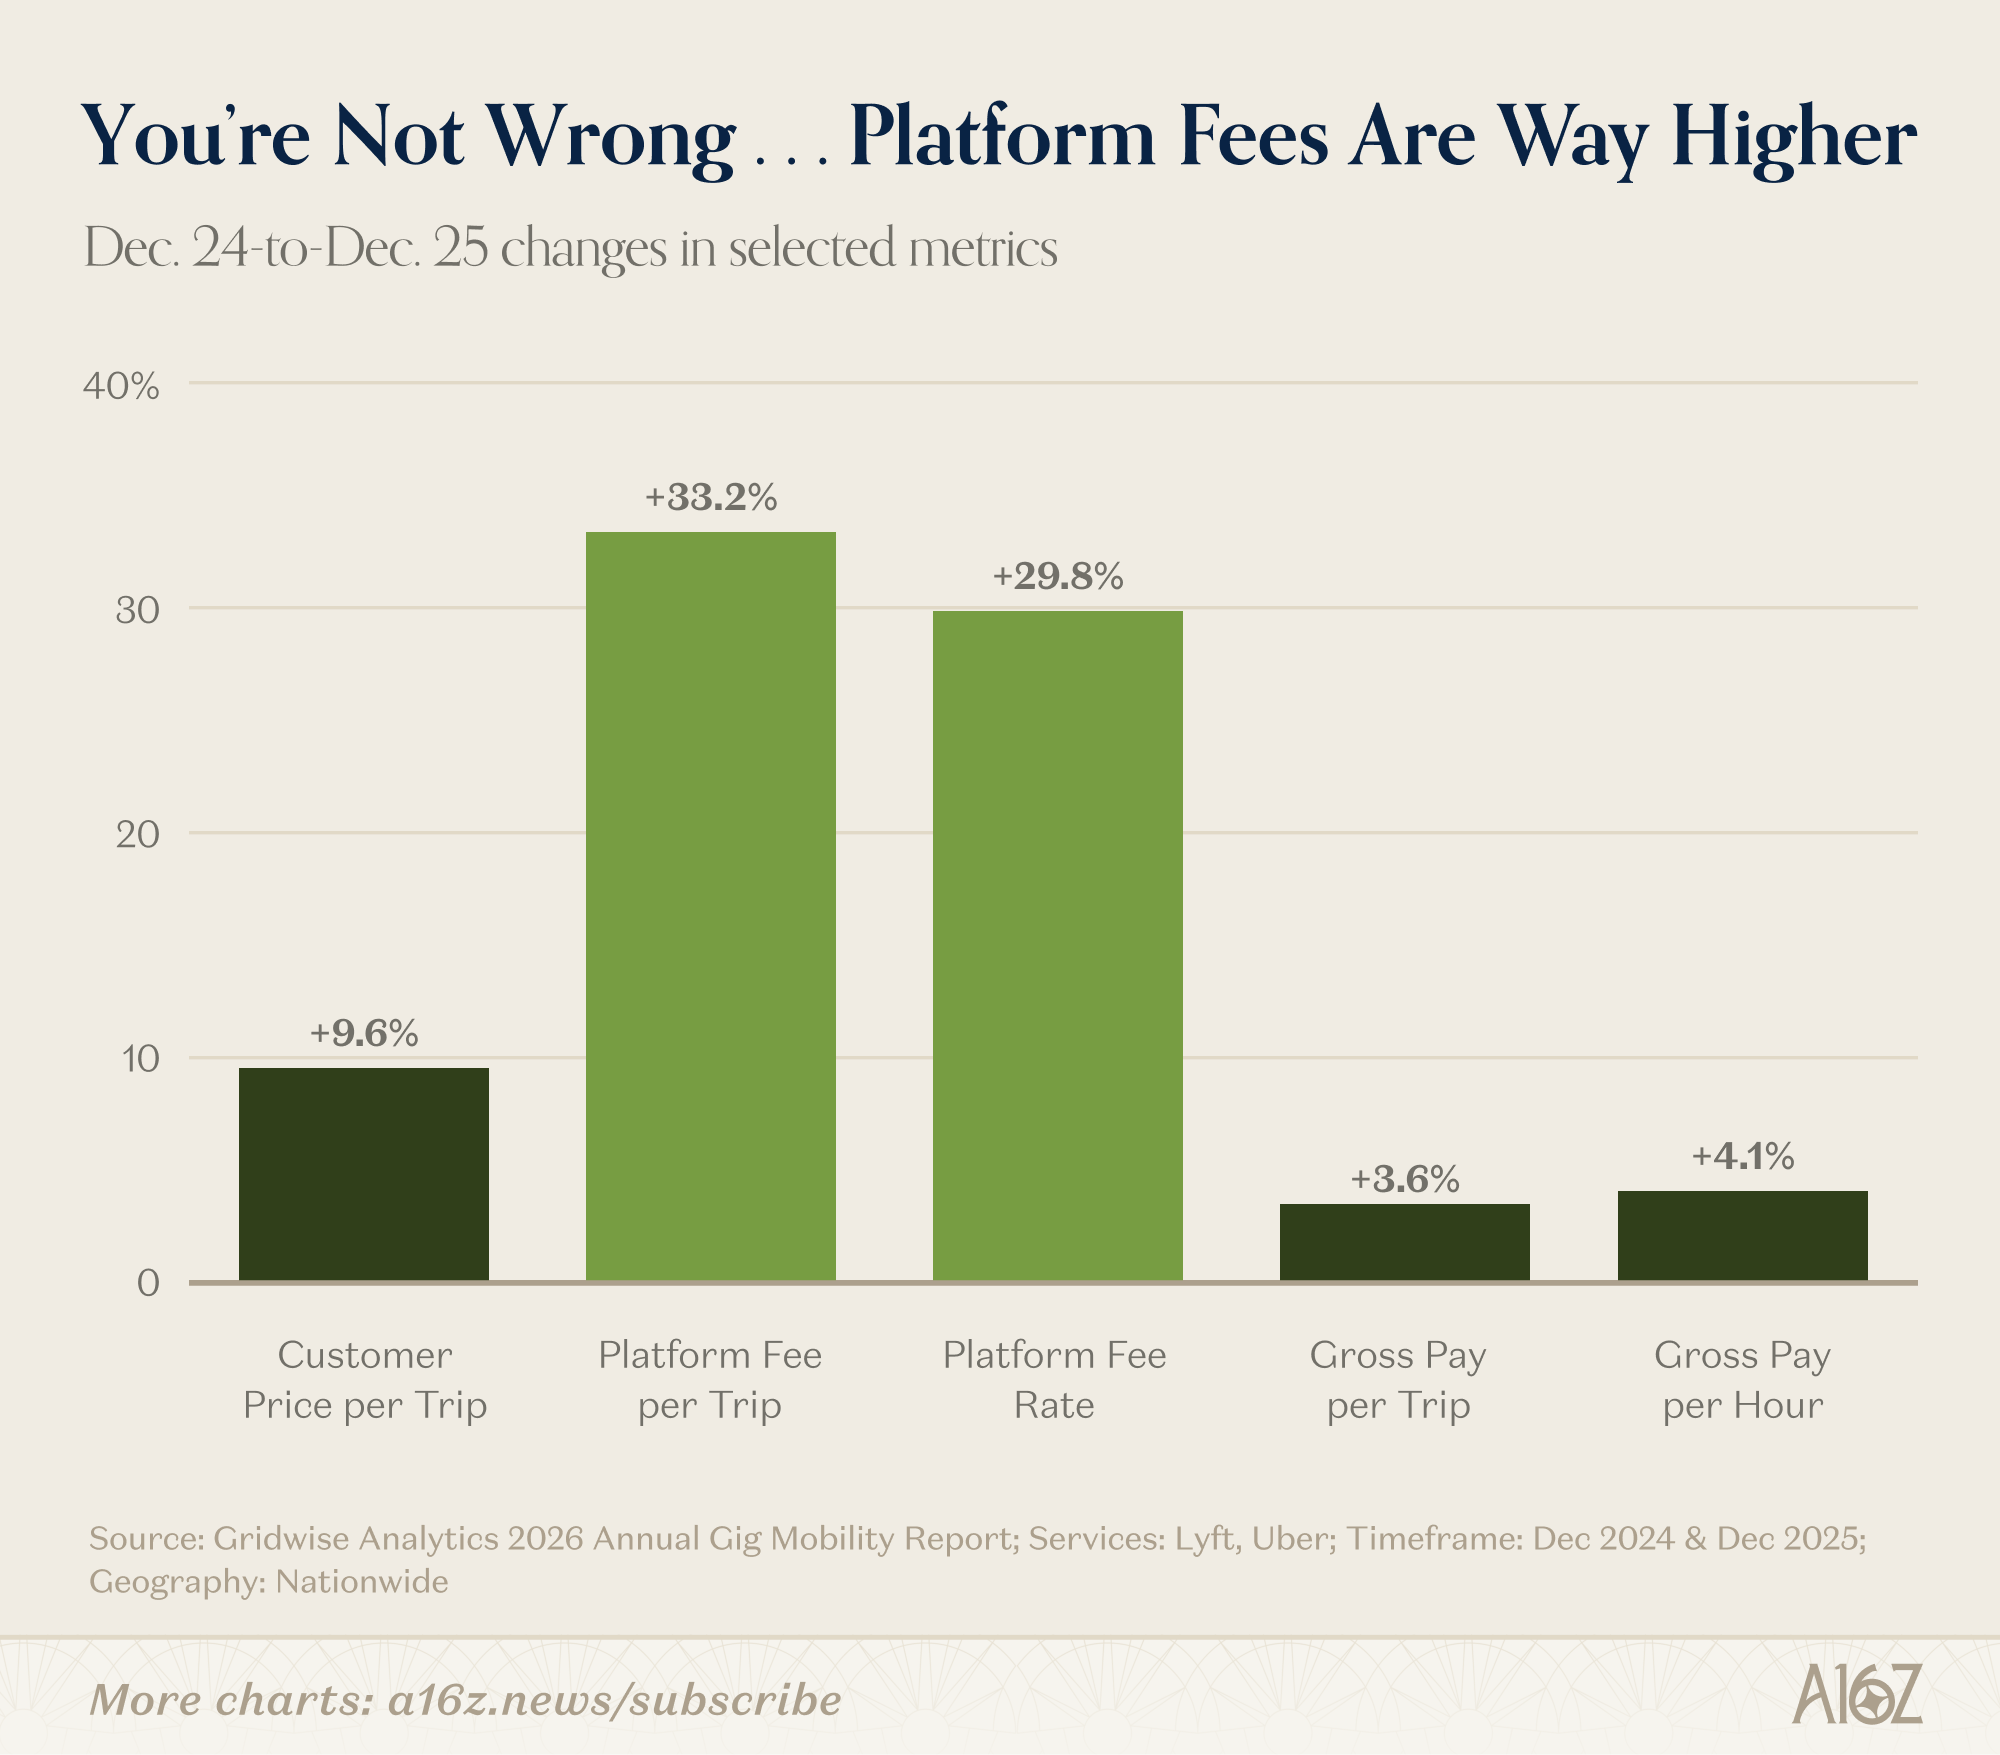
Platform fees per trip have grown ~33% yoy from December ‘24 to December ‘25, while hourly driver pay has grown a relatively paltry 4.1%.
If it felt like Uber was charging higher fees, then there’s your data to back up your feels. What did you think profitability meant? Vibes? Papers? Essays?
It’s hard to say, though, whether all the bad feels have mattered, all that much. If you look at NPS scores, you could probably draw whatever conclusion you wanted to draw
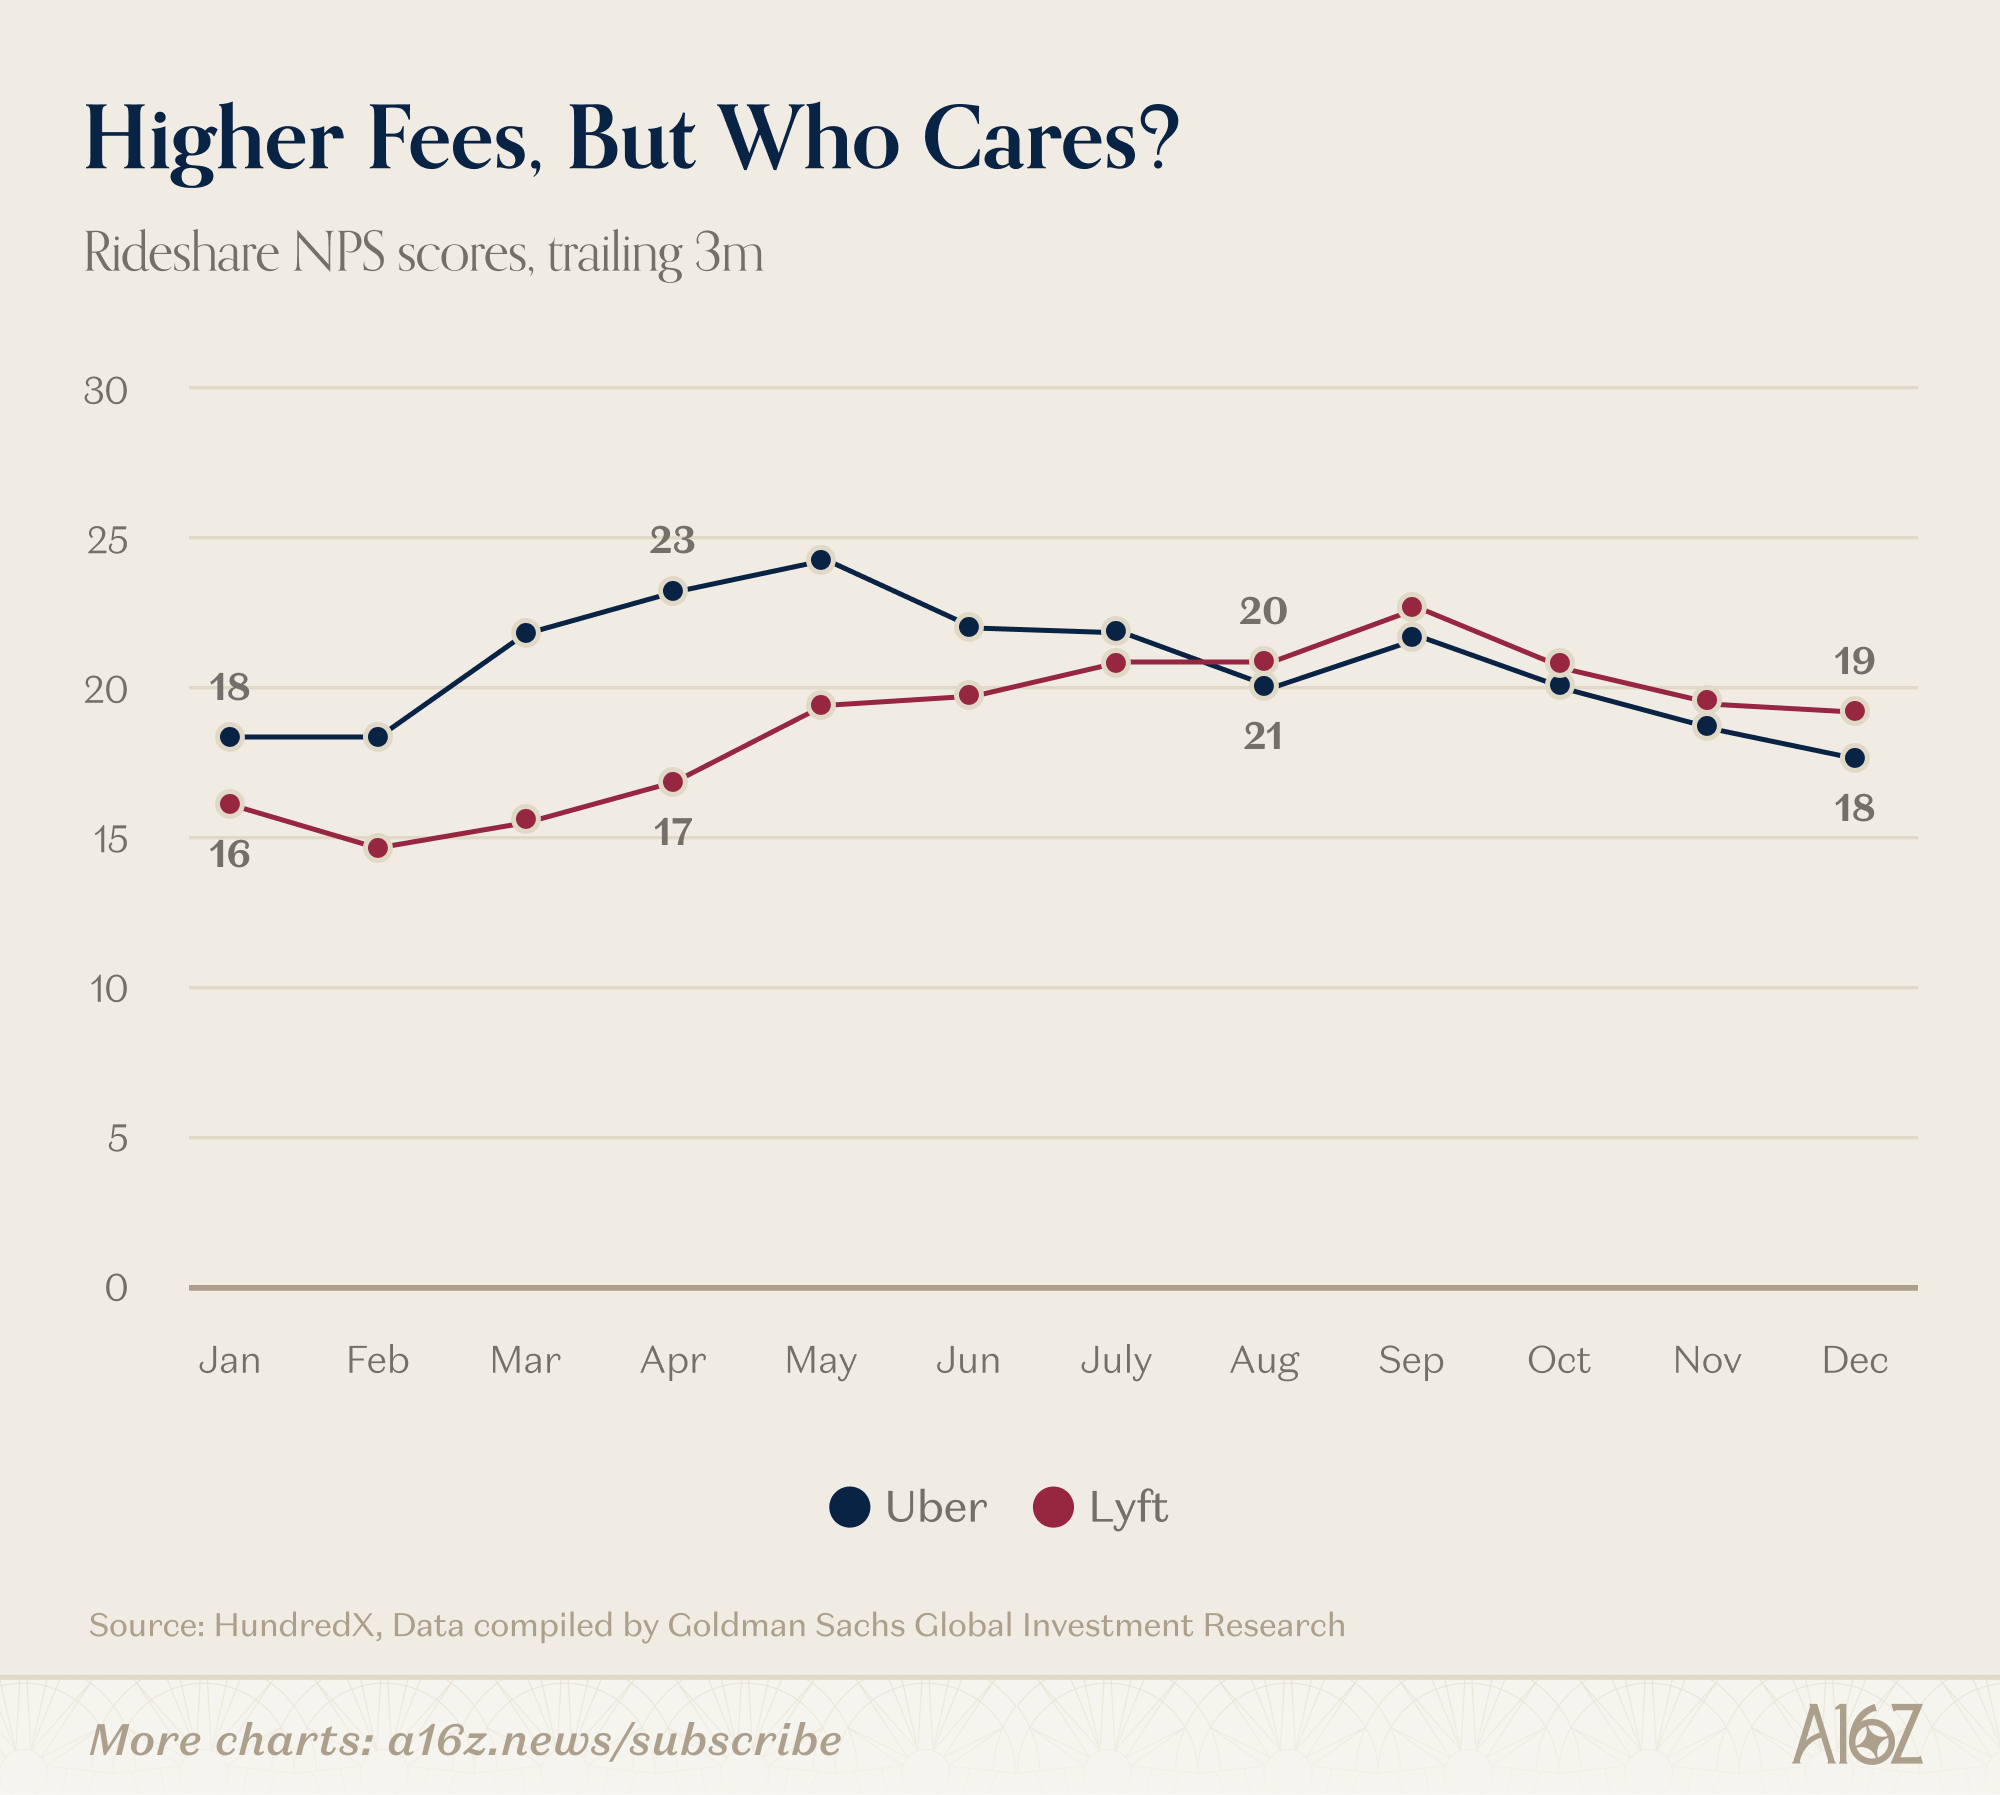
Ridesharing NPS scores for 2025 went up . . . and then down . . . and are now more or less back where they started.
An NPS of 18 is generally considered pretty much ok (inasmuch as it aligns with the industry). Not good. Not bad. But ok.
Uber and Lyft may be charging more (and the driver hourly rate has increased), but it sure seems like riders are just going to shrug and bear it.


This newsletter is provided for informational purposes only, and should not be relied upon as legal, business, investment, or tax advice. Furthermore, this content is not investment advice, nor is it intended for use by any investors or prospective investors in any a16z funds. This newsletter may link to other websites or contain other information obtained from third-party sources - a16z has not independently verified nor makes any representations about the current or enduring accuracy of such information. If this content includes third-party advertisements, a16z has not reviewed such advertisements and does not endorse any advertising content or related companies contained therein. Any investments or portfolio companies mentioned, referred to, or described are not representative of all investments in vehicles managed by a16z; visit https://a16z.com/investment-list/ for a full list of investments. Other important information can be found at a16z.com/disclosures. You’re receiving this newsletter since you opted in earlier; if you would like to opt out of future newsletters you may unsubscribe immediately.
Who wrote this? LOL. "Boss-tier," "meme-stonk," "boo SaaS" and missing periods / colons at the end of sentences...
... intentional errors to Proof-of-Human or I don't know, but, this was actually still an interesting read. Thanks for that and the chuckle.
Thank you for the informative content you put out.
In relation to Uber, try mapping Waymo’s NPS onto the chart. That’s where you’ll see whether “all the bad feels mattered,” or not.