

Charts of the Week: Vertical SaaS, Rawr!
LLM retention and usage; Open Source Rising; Second-order effects of MoltBot; Of Capex, R&D, and productivity


America | Tech | Opinion | Culture | Charts
Out today, Anne Neuberger in the WSJ: AI Can Help Defend Against Cyberattacks

Vertical SaaS, Rawr!
First, just a little callback to the topic de jour, vertical SaaS. George Sivulka, CEO/Founder of Hebbia, made the case that vertical SaaS is anything but dead. It turns out, he may be on to something (because of course).
According to some recent data, the sales cycle for publicly traded vertical SaaS is looking pretty, pretty good:
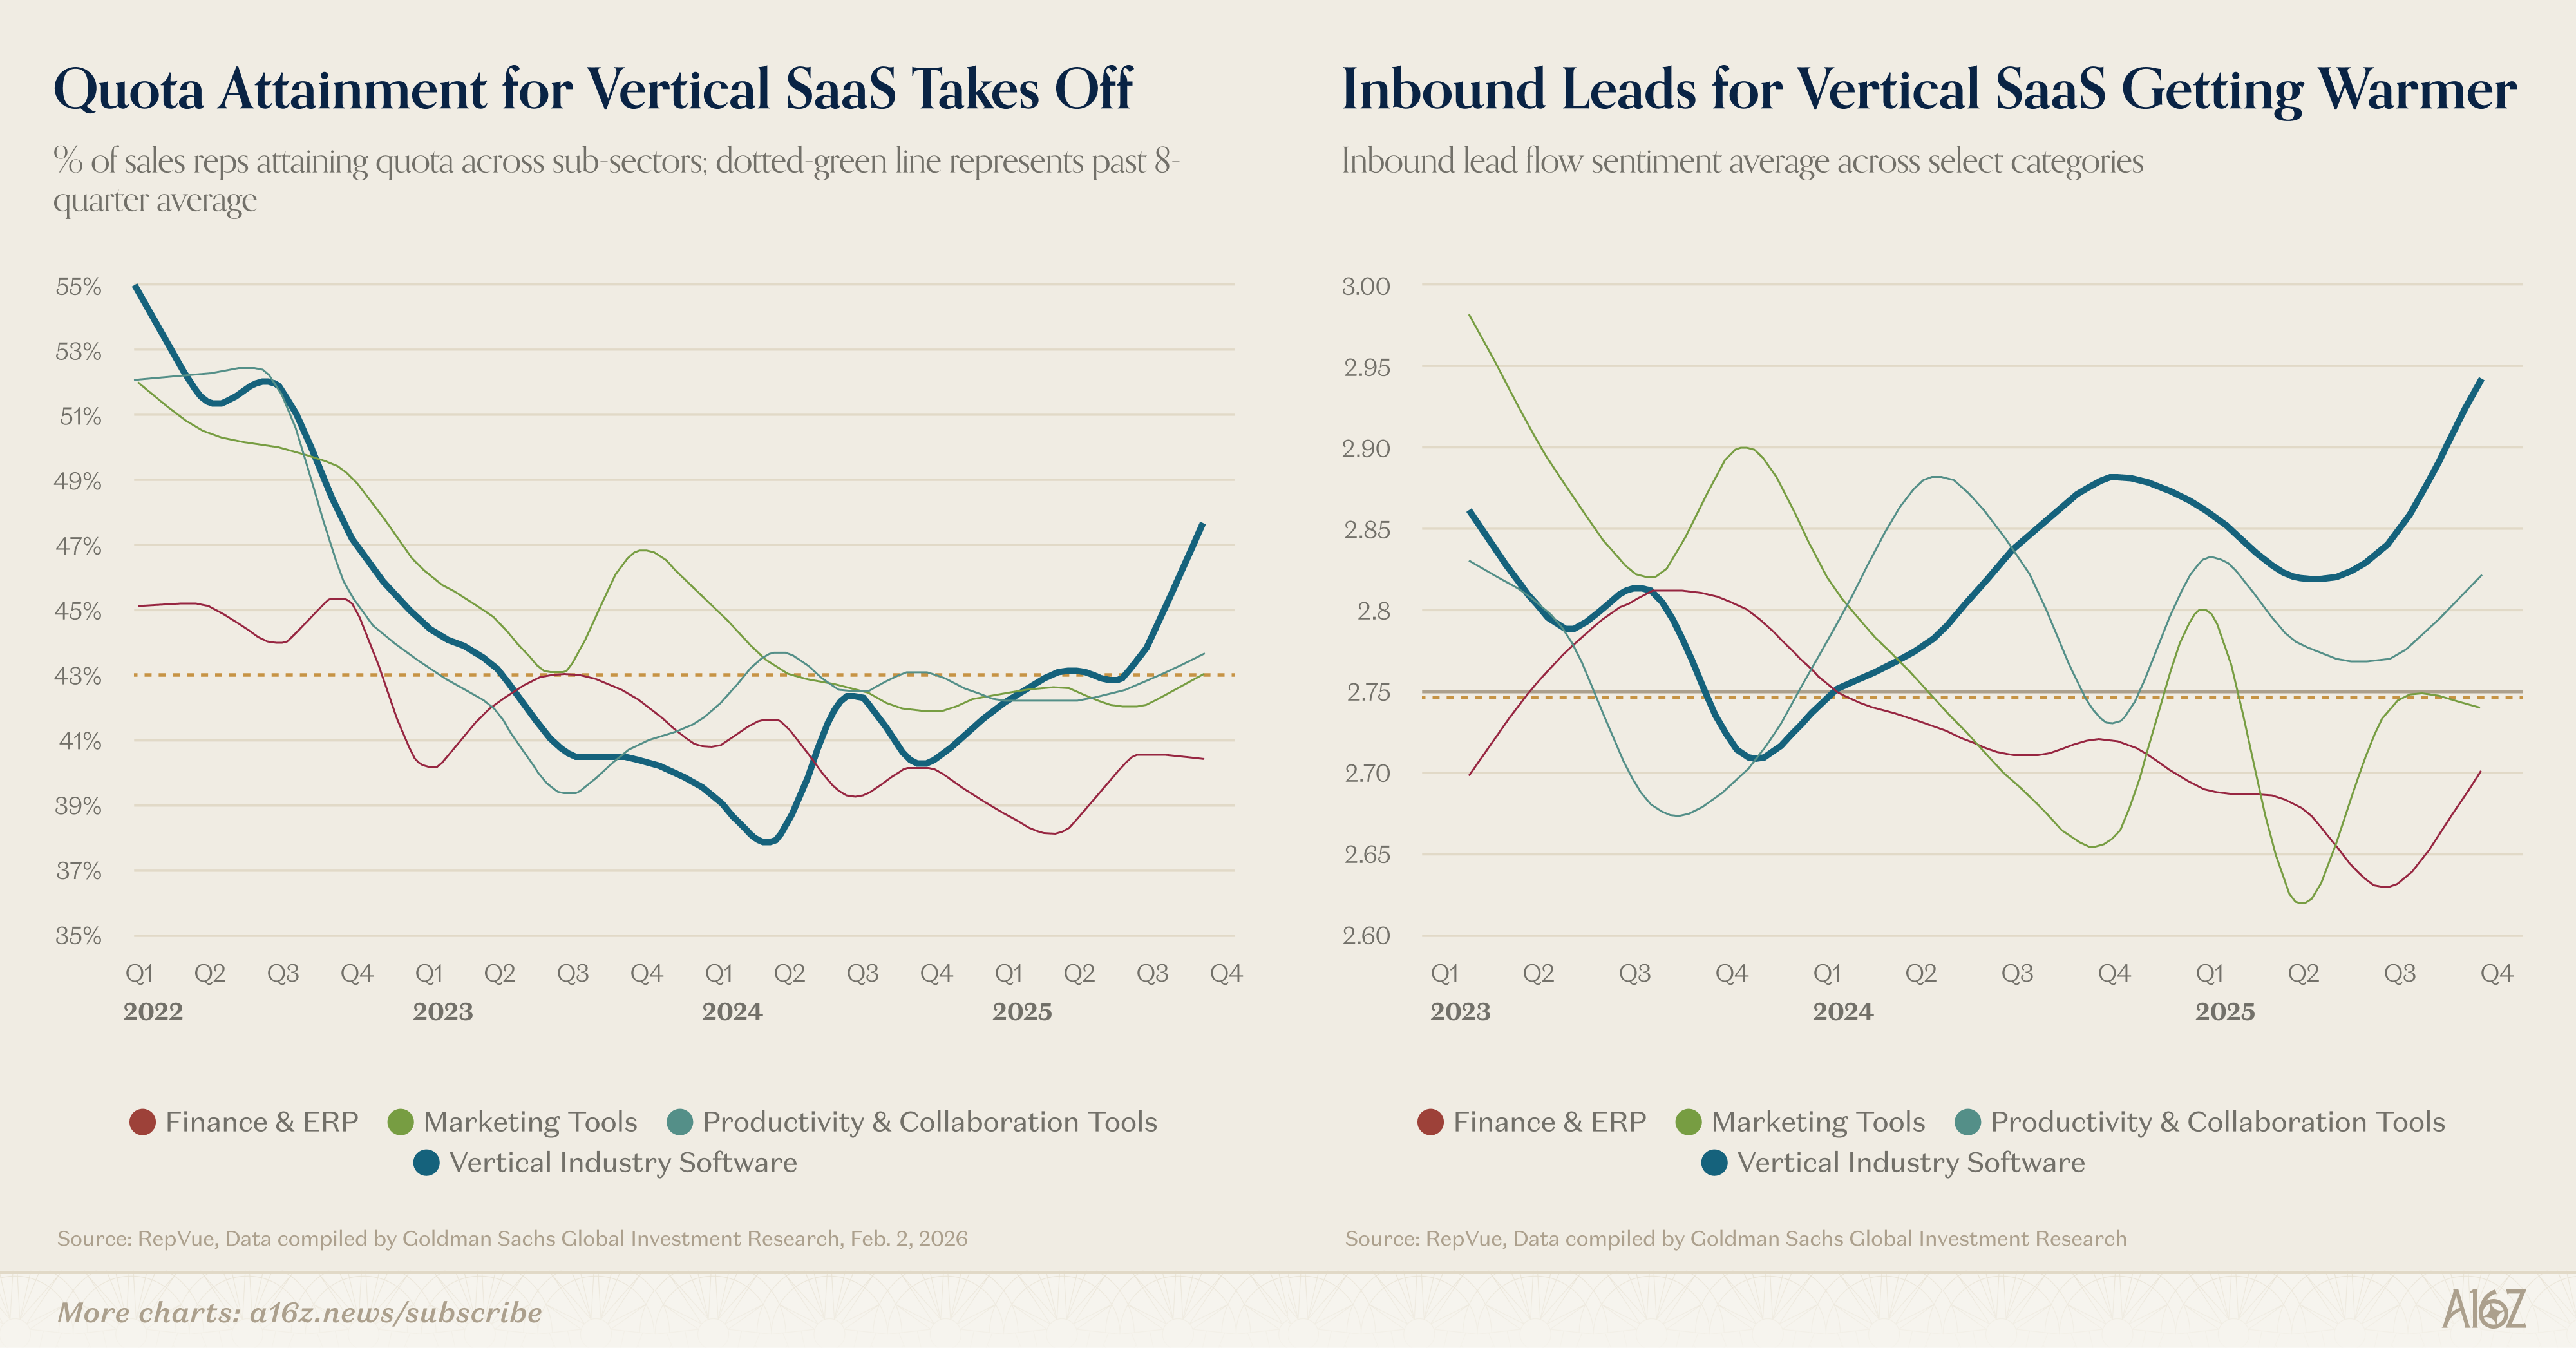
Both quota attainment and inbound lead sentiment improved dramatically for vertical software, which now leads every other category of its enterprise peers, i.e. Finance & ERP, Marketing, and Productivity.
If vertical software is dead, no one tell the sales reps.
For now at least, it appears as though specialized knowledge of industry workflows still matters.


Retention too good to smile
How much do people love their LLMs? Better and better with time, apparently.
Retention curves do not usually look like this:
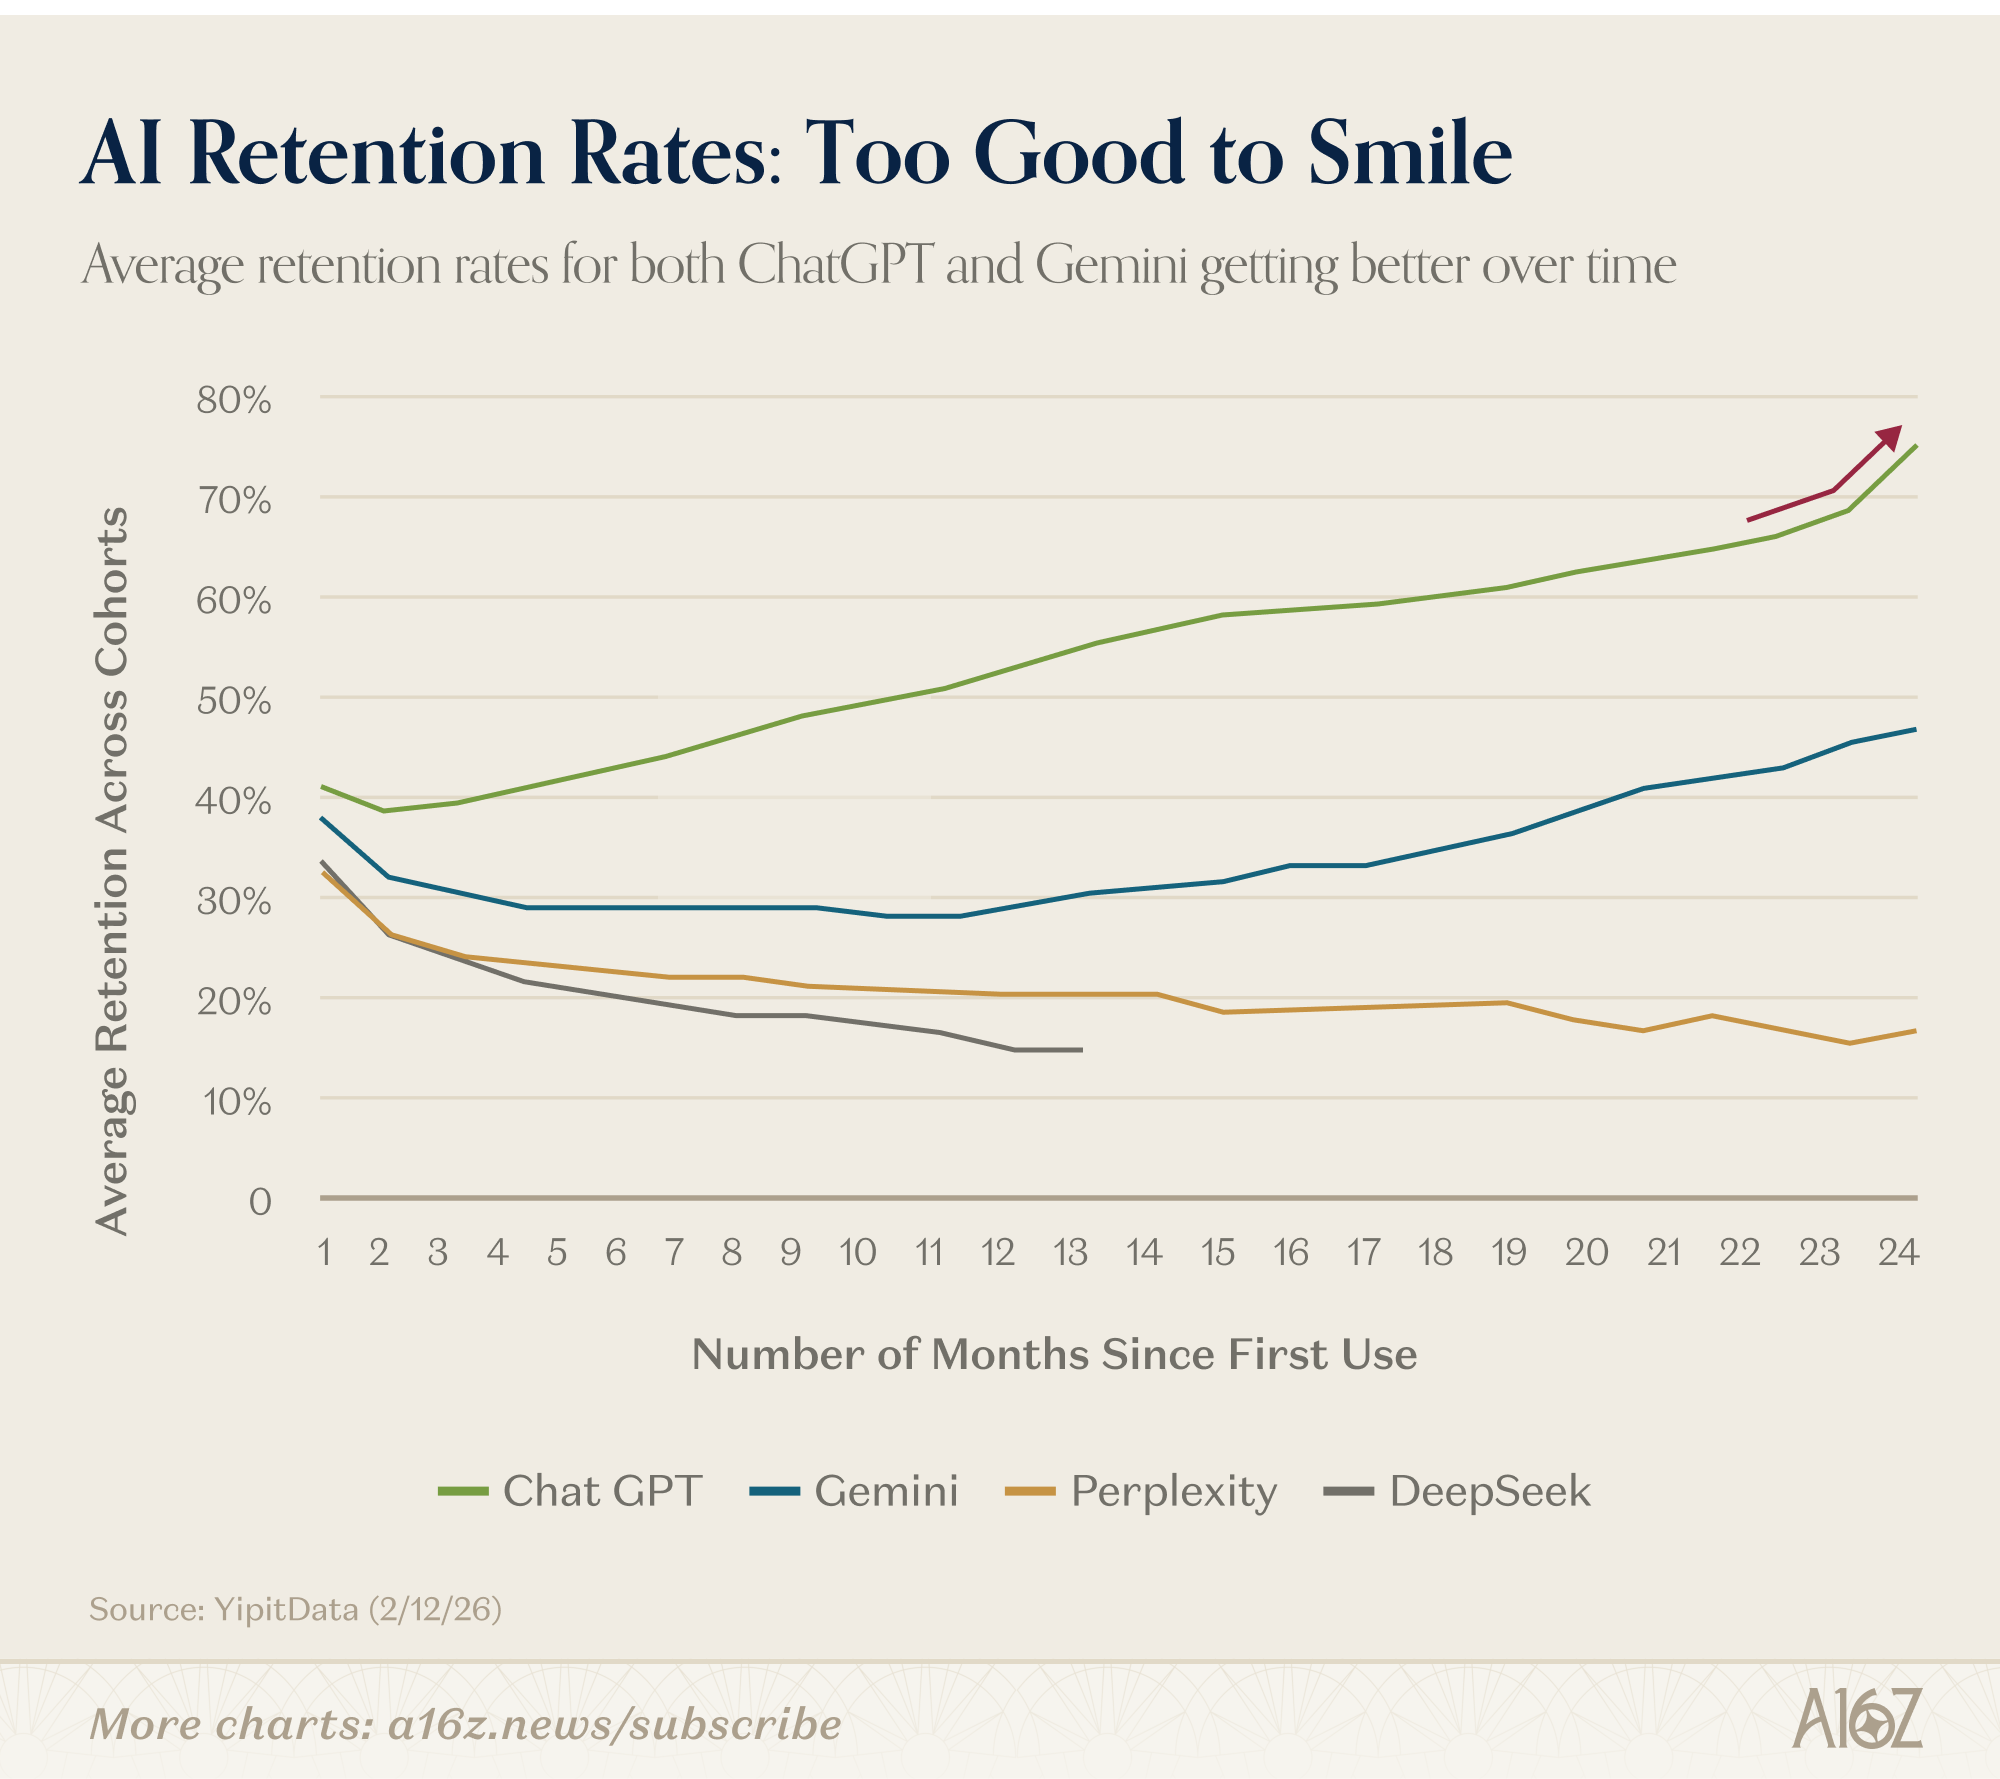
ChatGPT’s average retention rates keep getting better from week 2 onwards, and even more impressively, inflect upwards at week 23;
Gemini, for its part, has a “smiling” retention curve, whereby rates dip initially (as per usual), but then pick up again at week 10 (and continue to climb).
A smiling retention curve is generally considered very impressive. It’s common for users to drop off over time, but it’s special when they start coming back over even more time.
But a retention curve that just keeps going up, and doesn’t even have a chance to smile? That’s basically unheard of, especially at this scale.
The other thing that’s pretty impressive about LLM usage is that active users are becoming more active:
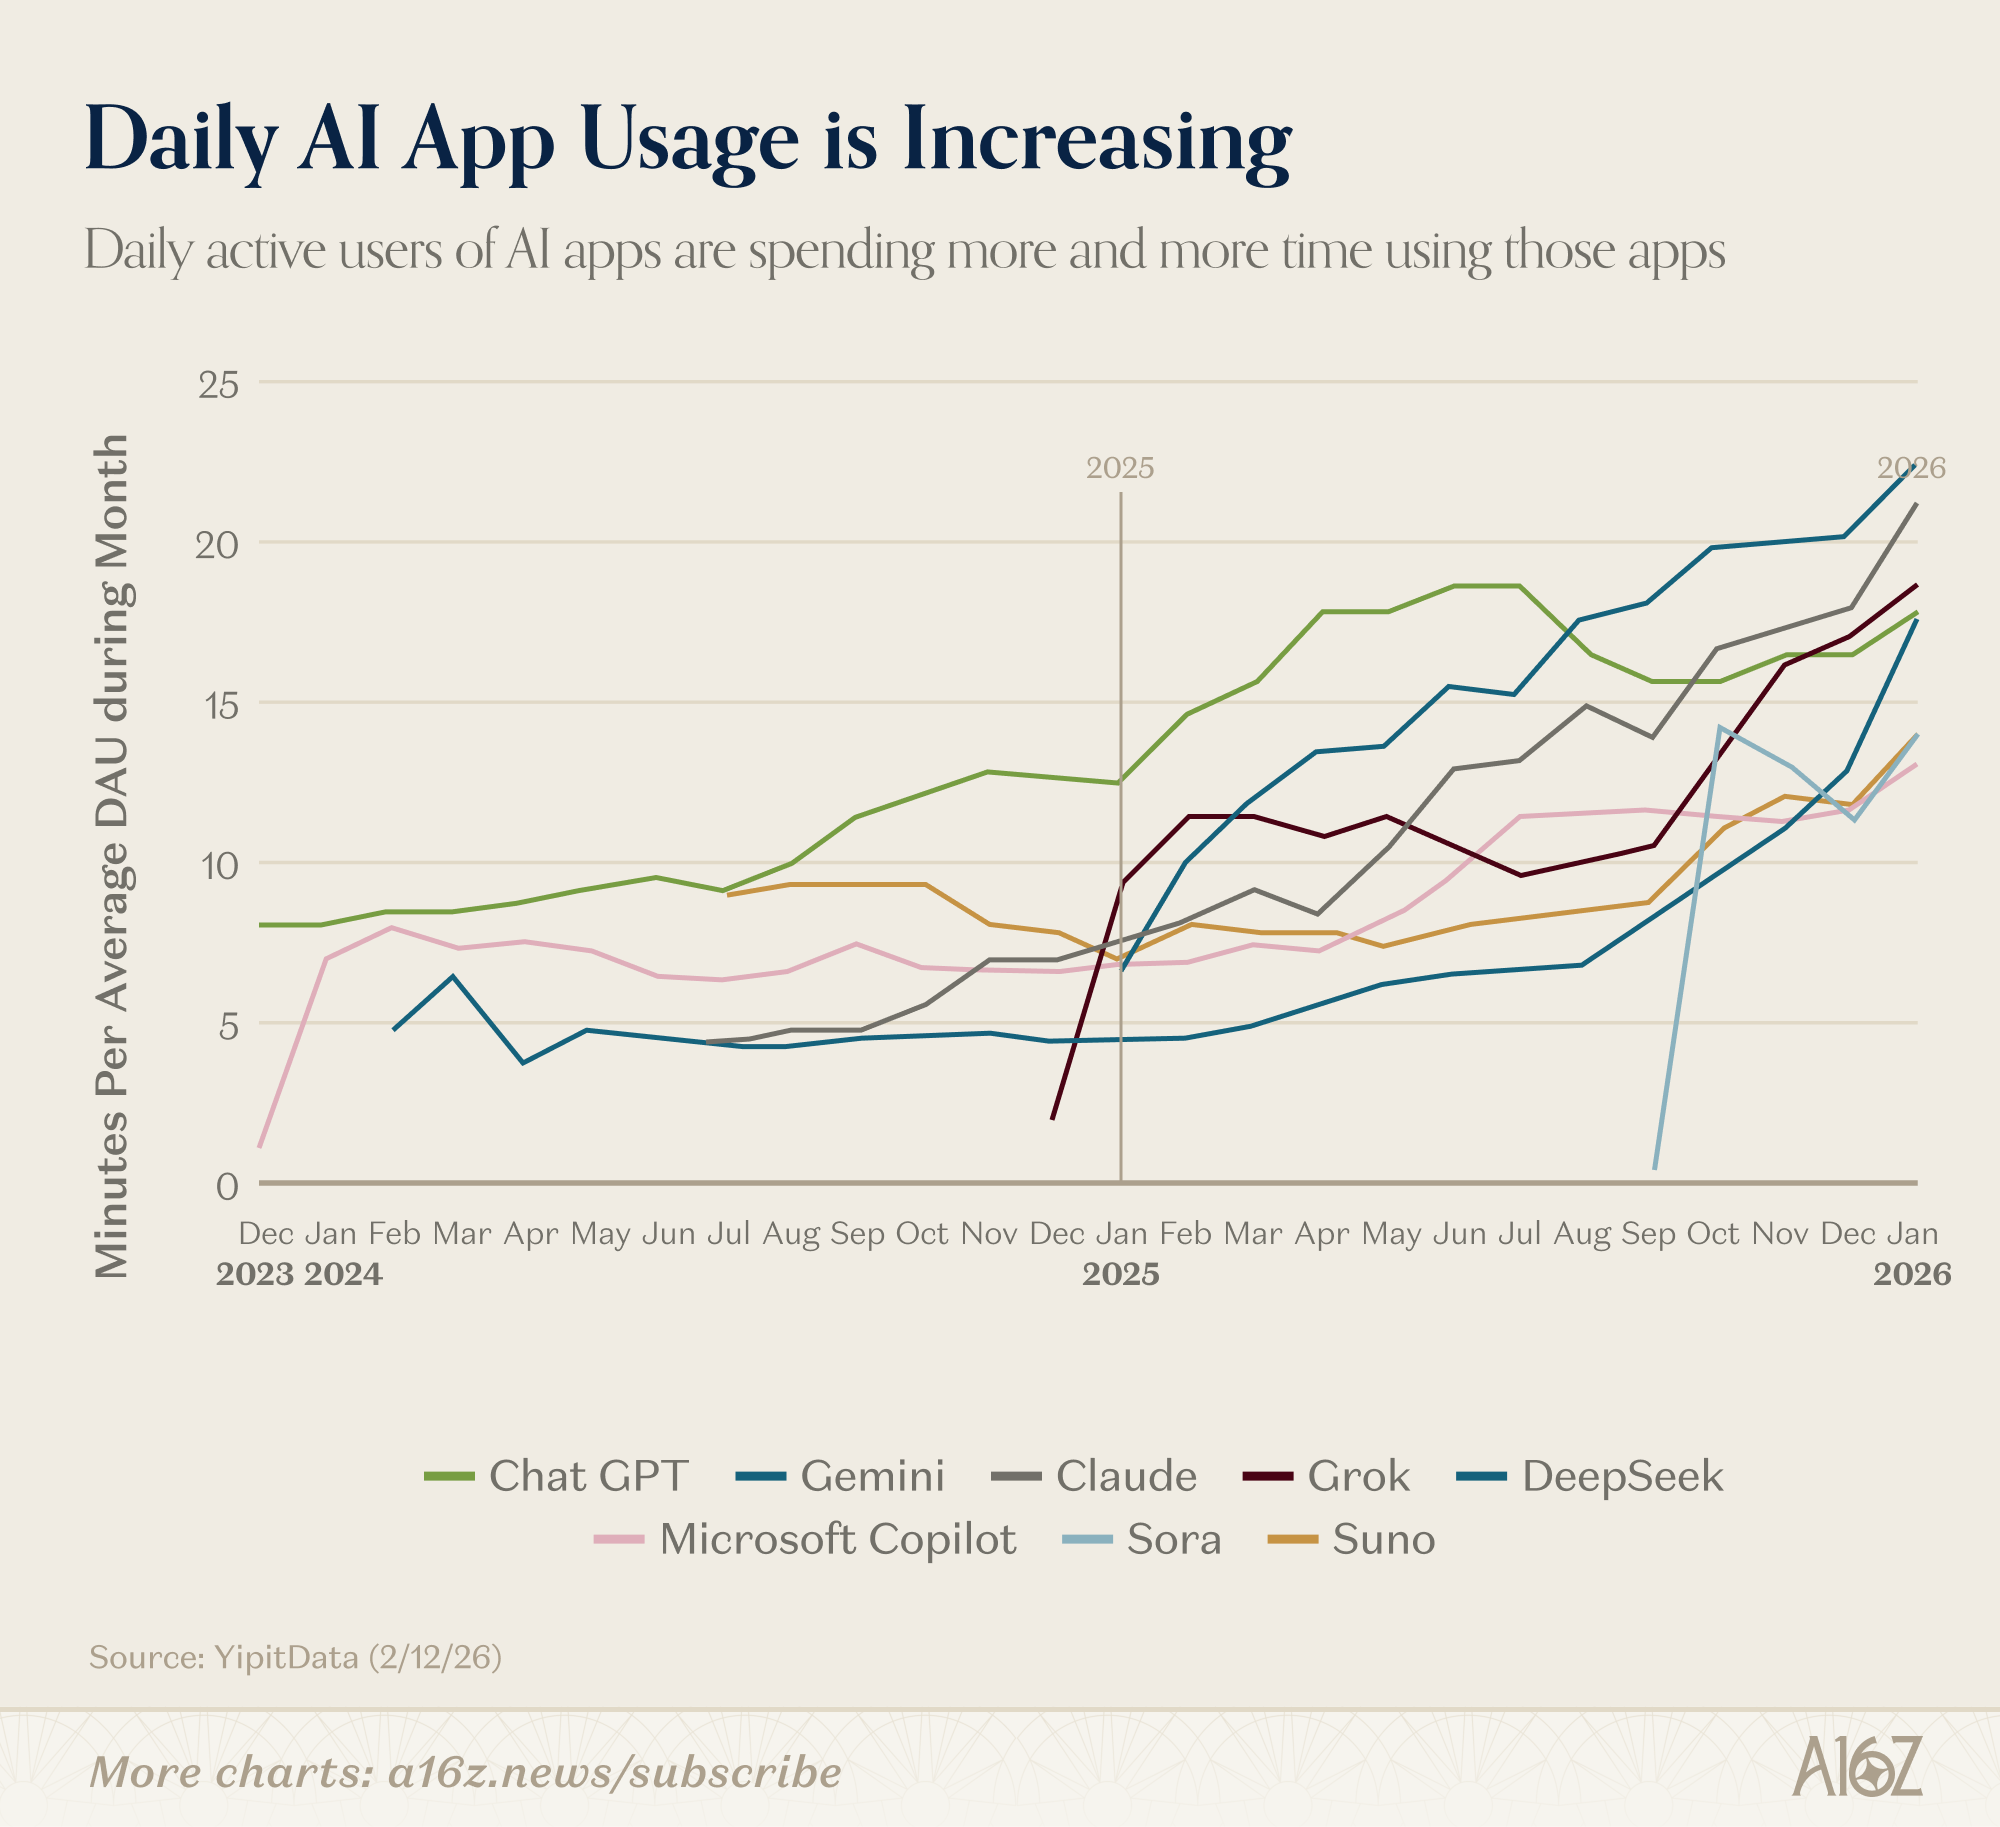
Minutes per day for Daily Active Users is rising across the board, for nearly all the AI apps in the panel.
Deepseek and Claude lead the field, with more than 20 min/day for DAUs, but Grok, ChatGPT and Gemini are close on their heels.
The platform shift is well underway, and the rising tide is lifting (nearly) all boats (by this measure, at least).
Open Source Rising
Frontier models keep getting better, but open source alternatives are keeping pace:
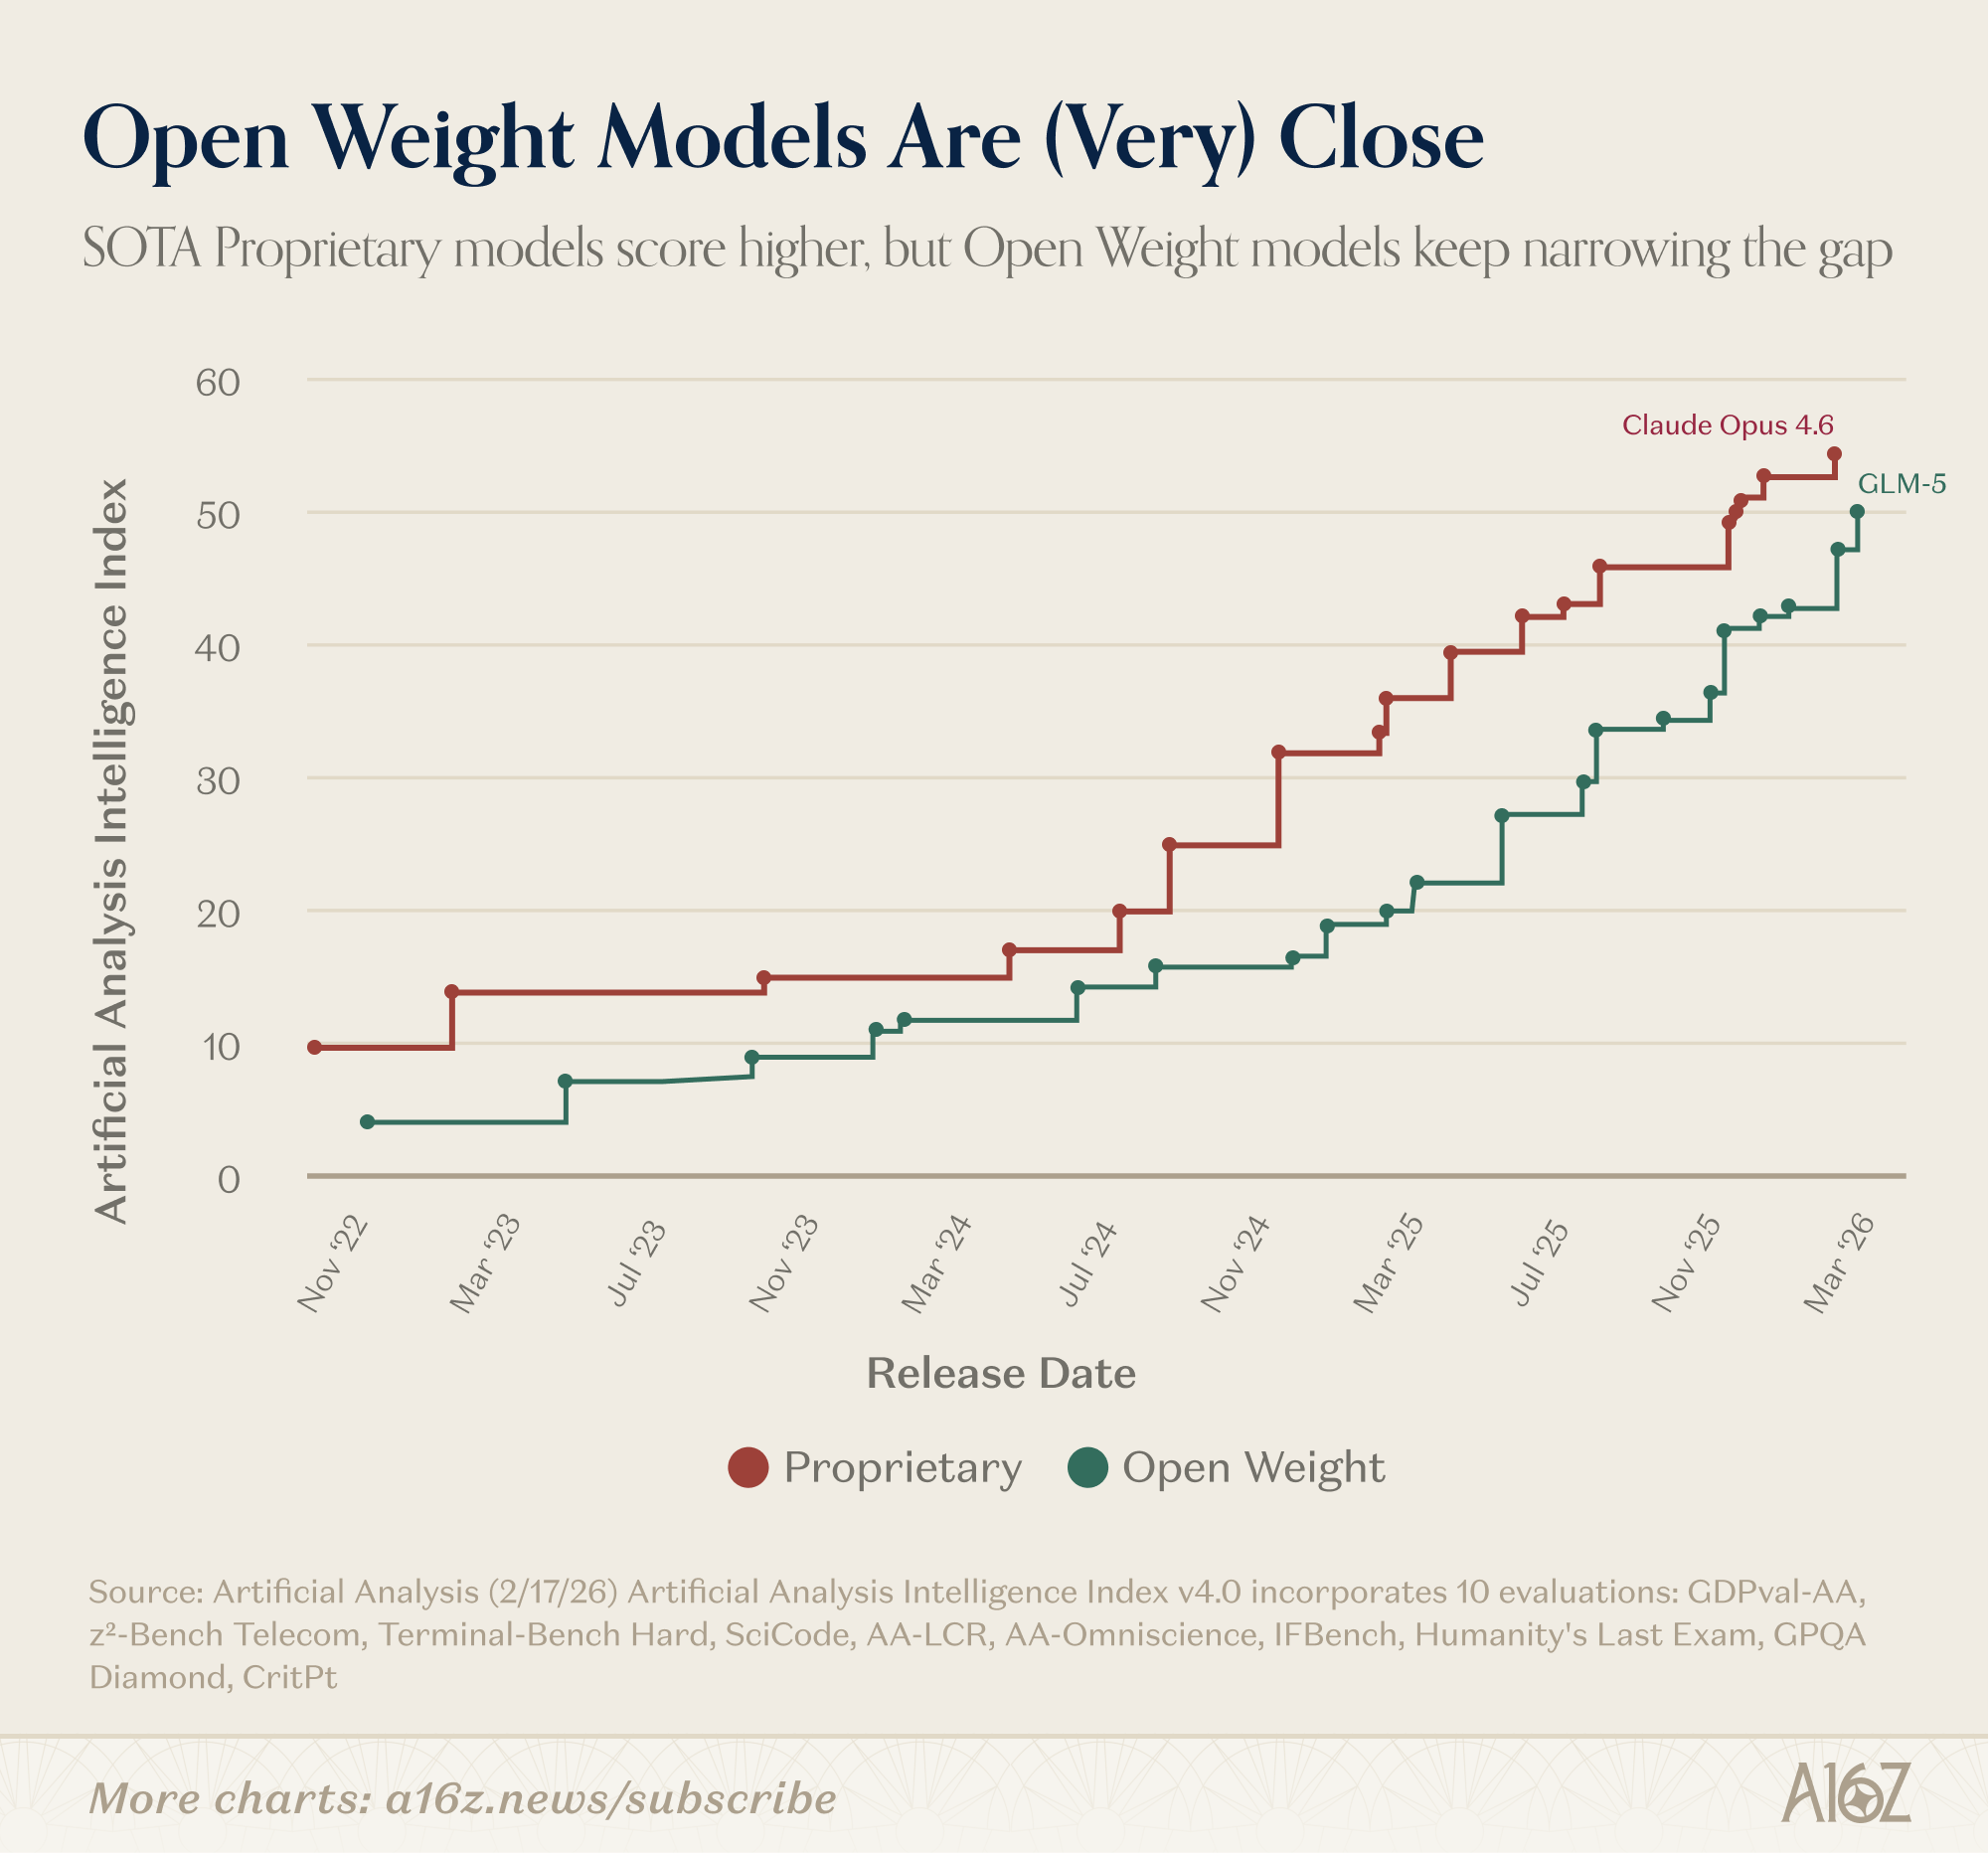
A proprietary model (Claude Opus 4.6) is still the “most intelligent,” but the gap between it and the next best open weight model has closed substantially.
Open models are nearly replicating the performance of leading proprietary models (on certain dimensions, at least), but they’re often a fraction of the cost.
The relative cost advantage of open models seems pretty apparent to users, as well:
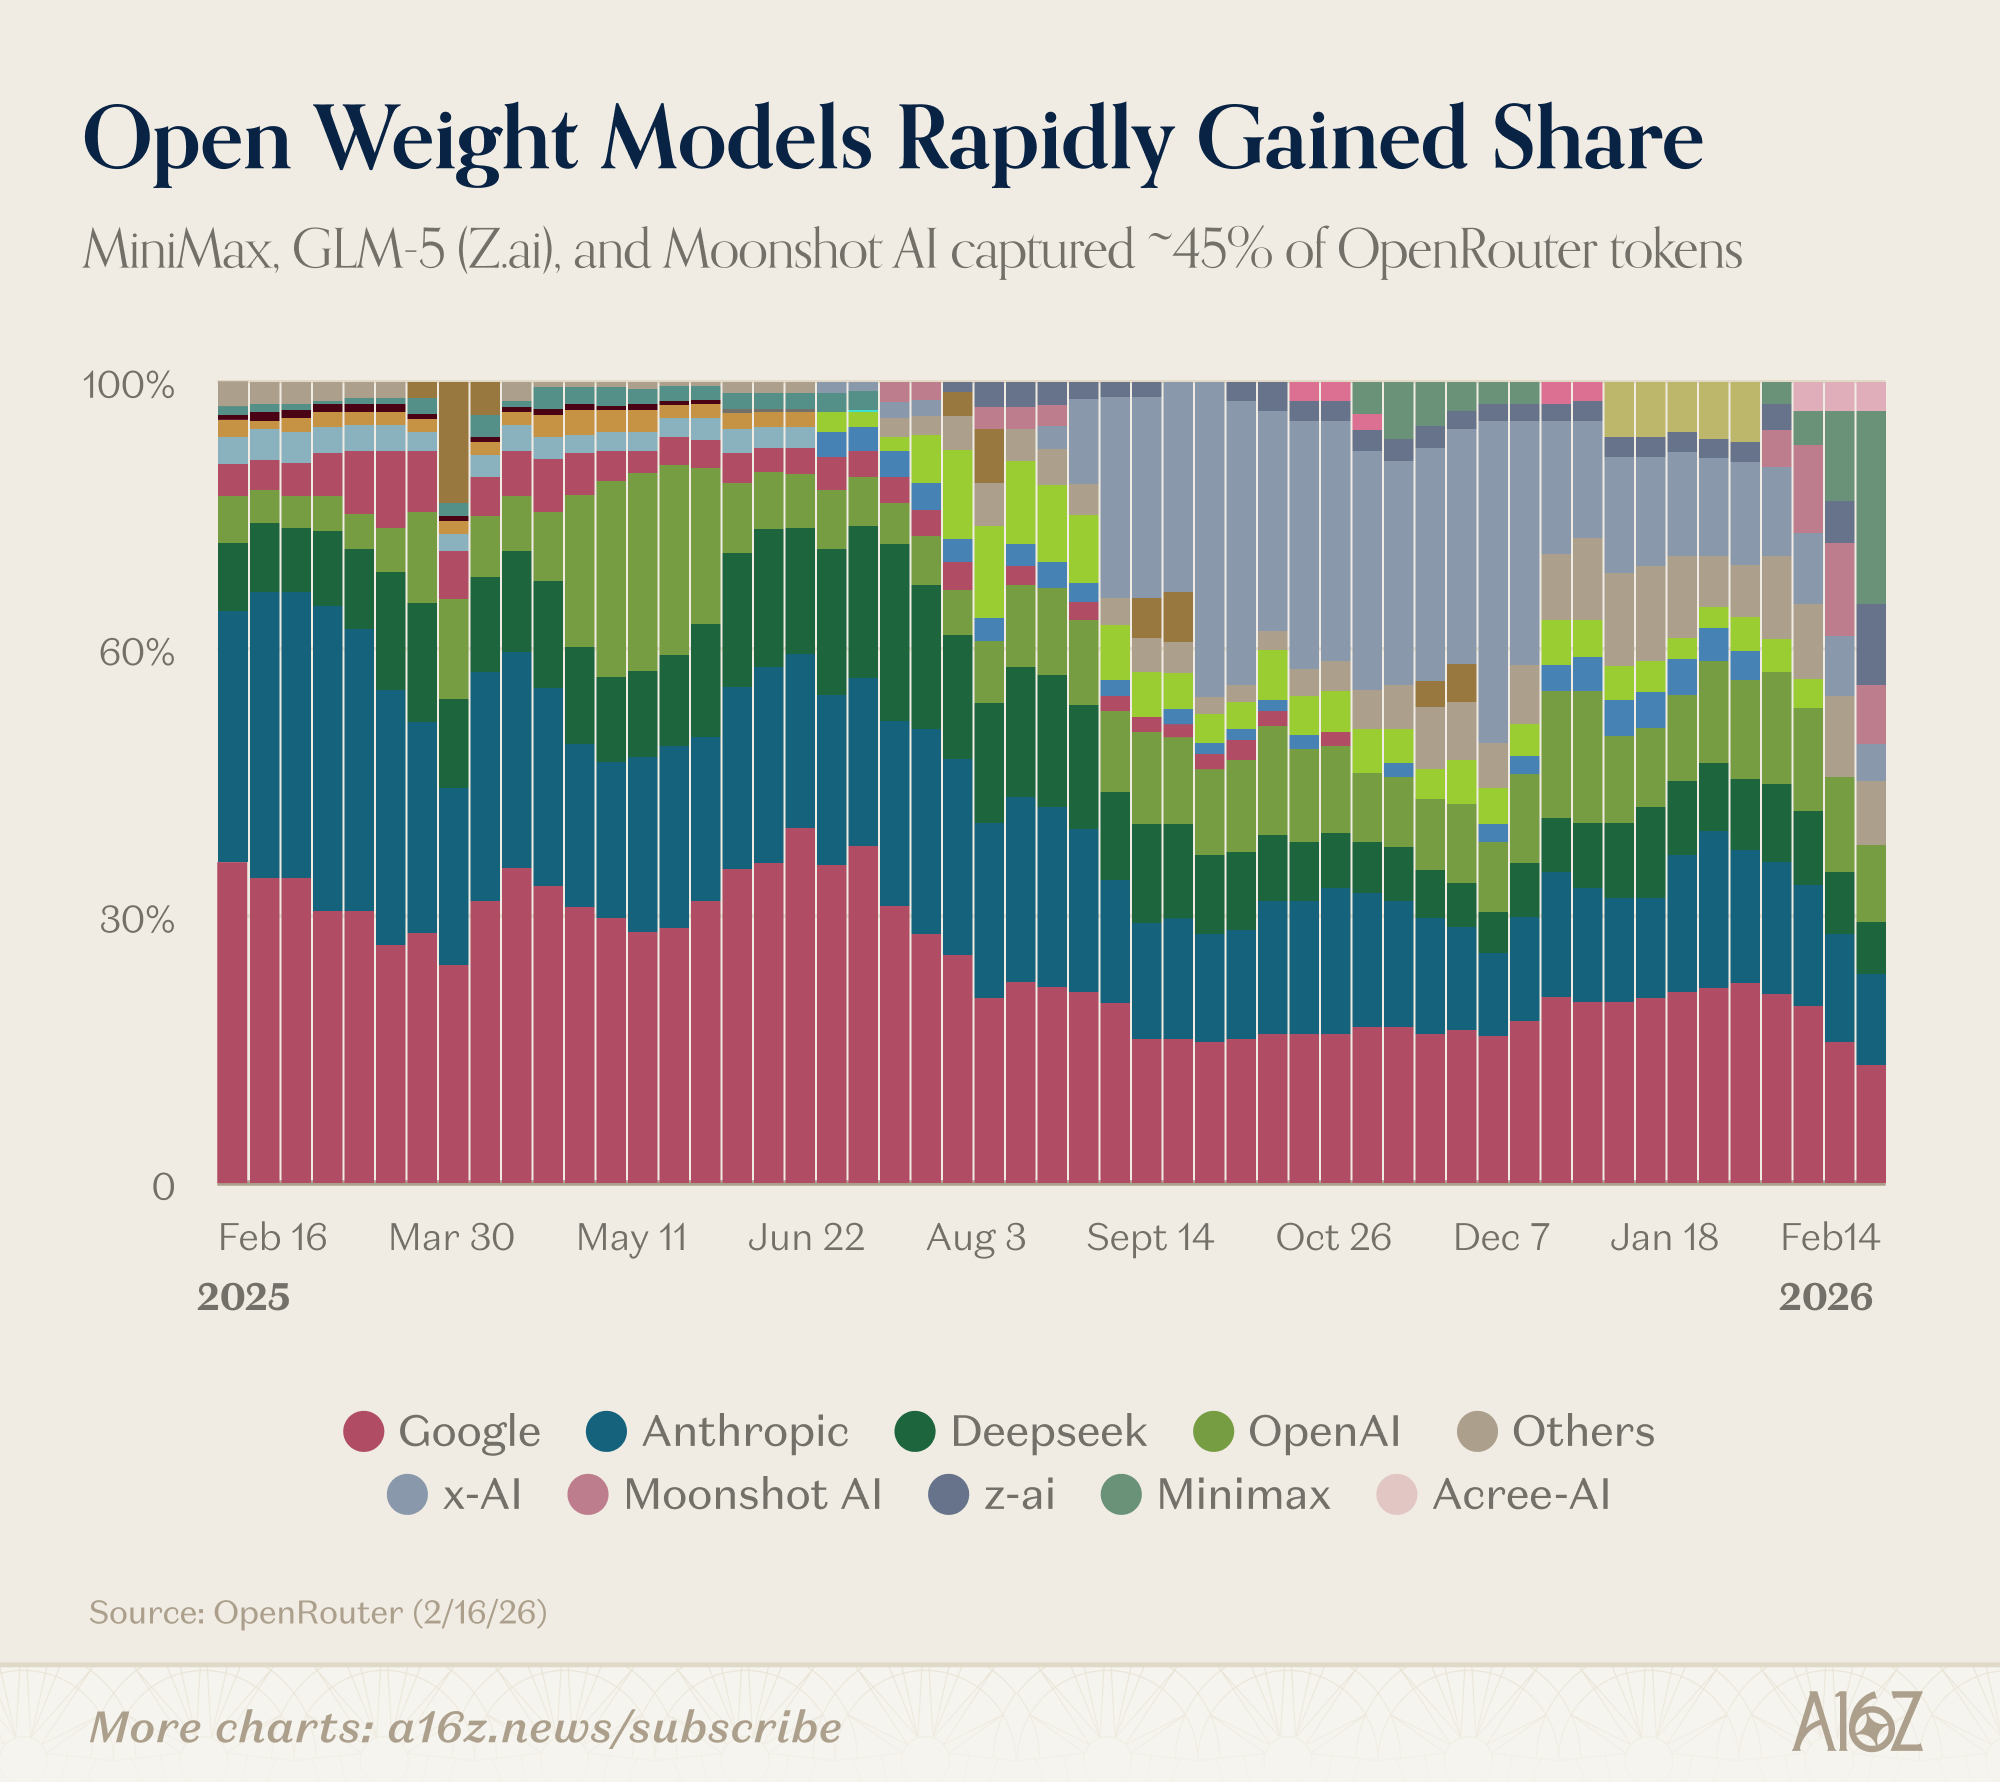
Open weight models have jumped into the token consumption leaderboard, according to OpenRouter.
4 out of the top 5 models by token consumption this past week are open weight models. MiniMax and GLM-5 (from z-ai) have come out of nowhere to capture ~25% and 10% of marketshare, respectively. Add Moonshot’s contribution, and the top three authors of open weight models were responsible for ~45% of tokens.
To be fair, OpenRouter only captures a subset of token consumption, and it’s likely to be biased towards open weight models, given the kind of usage that it tracks (i.e. it’s a model API router), but the rapid rise of MiniMax and others is still pretty striking. It’s hard (and expensive) enough for the proprietary models to stay ahead of each other, without far cheaper open weight models nipping at their heels.
Second-order effects of MoltBot
While Apple appears to be sitting out the AI Capex race (for now), that doesn’t mean it’s not benefitting from the AI wave.
In this case, the AI wave is OpenClaw (née Moltbot née ClawdBot)
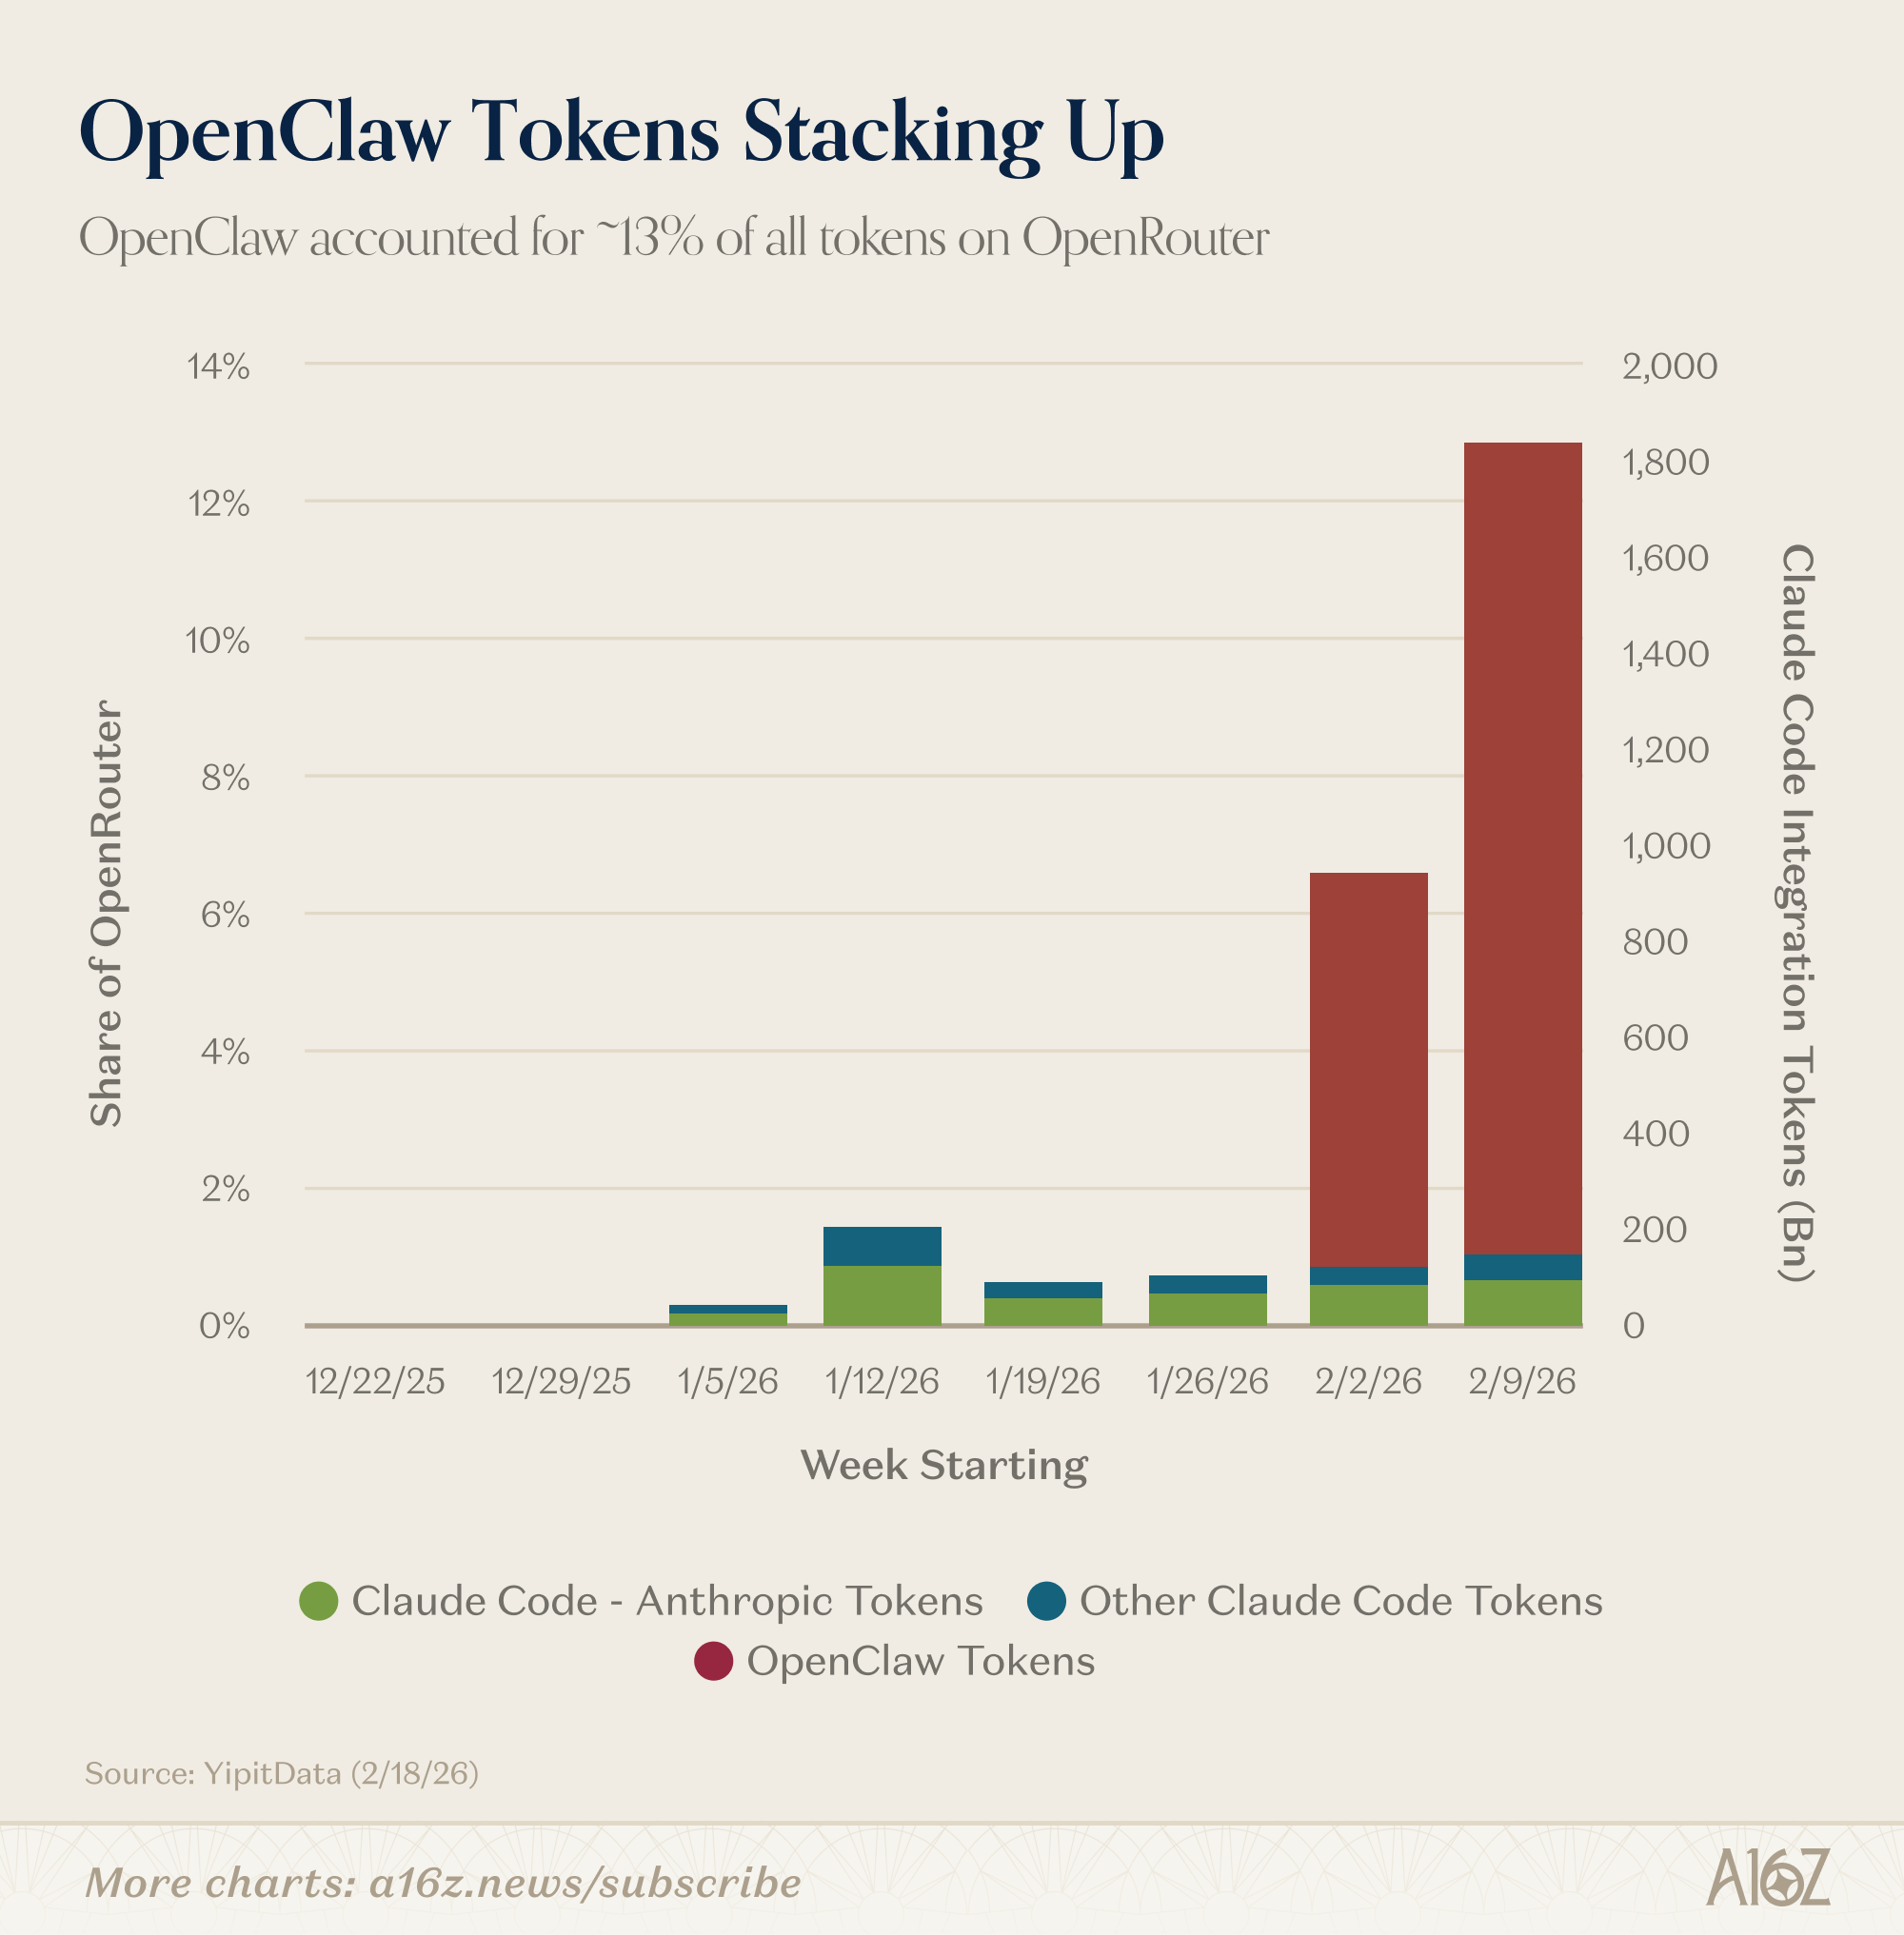
OpenClaw token usage surged to ~13% of all tokens on OpenRouter in just a two week period (mostly via open weight models).
Great for OpenClaw, but what about Apple?
Well, when OpenClaw was released into the wild, interest in Mac minis spiked:
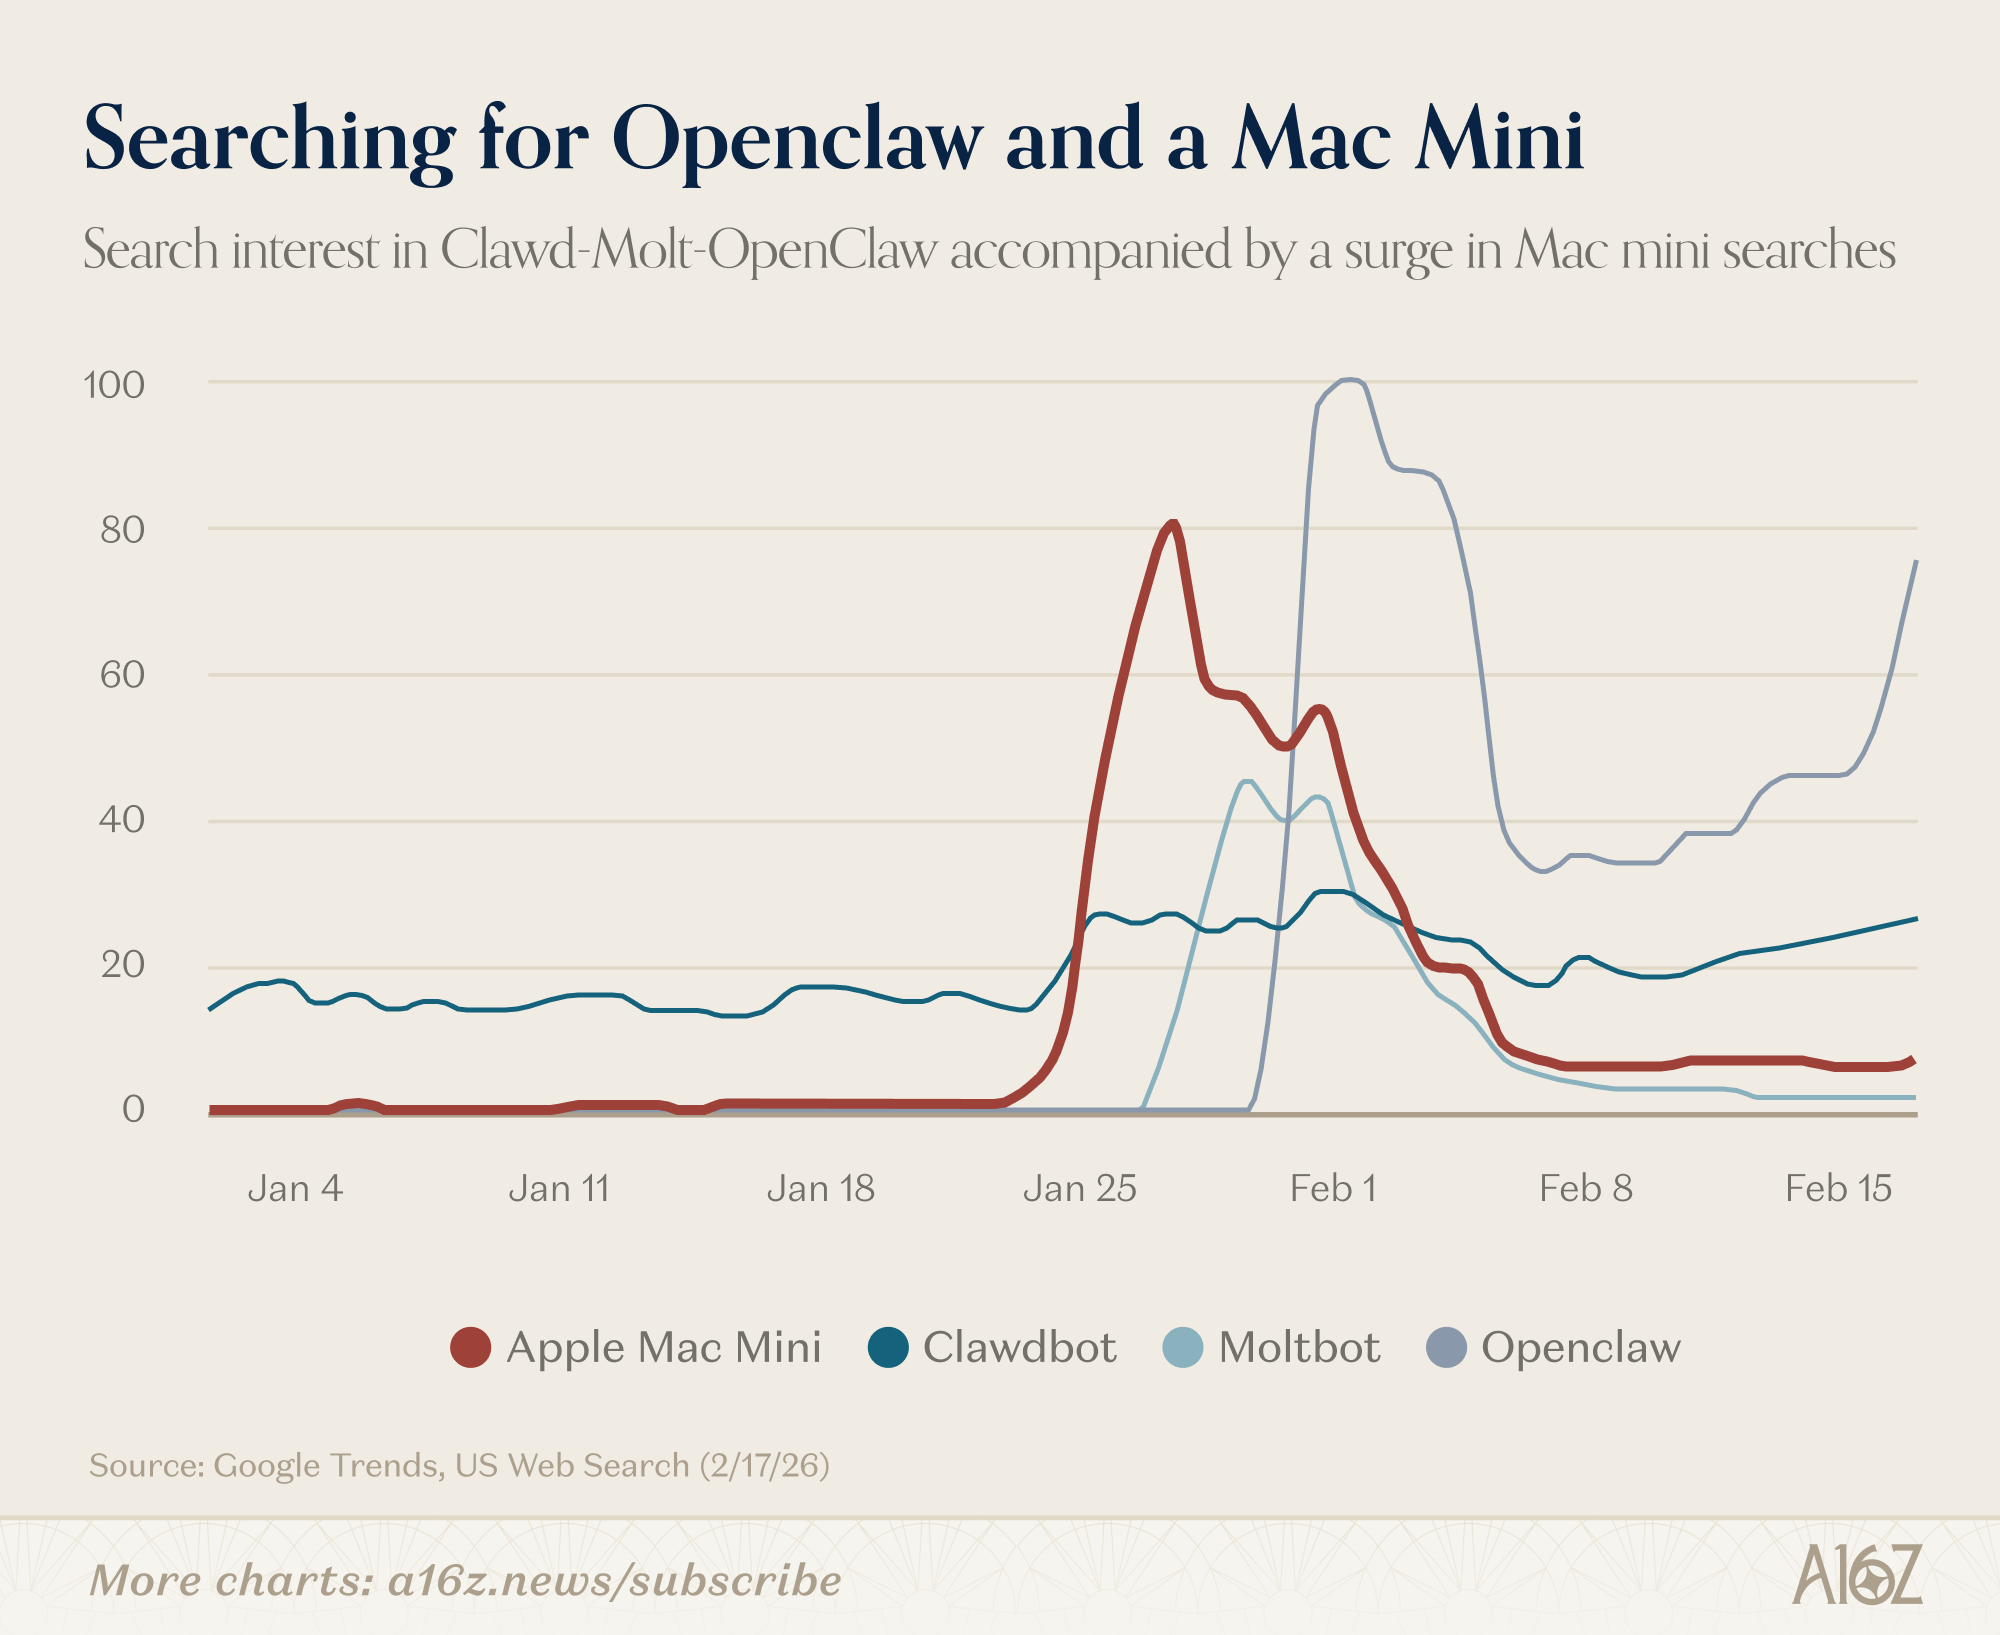
Search interest in Mac mini, Clawdbot and Moltbot all jumped together, with OpenClaw picking up where its predecessor names left off.
It’s not just that people are curious, either.
Prices for the Mac mini on Amazon jumped, as well:
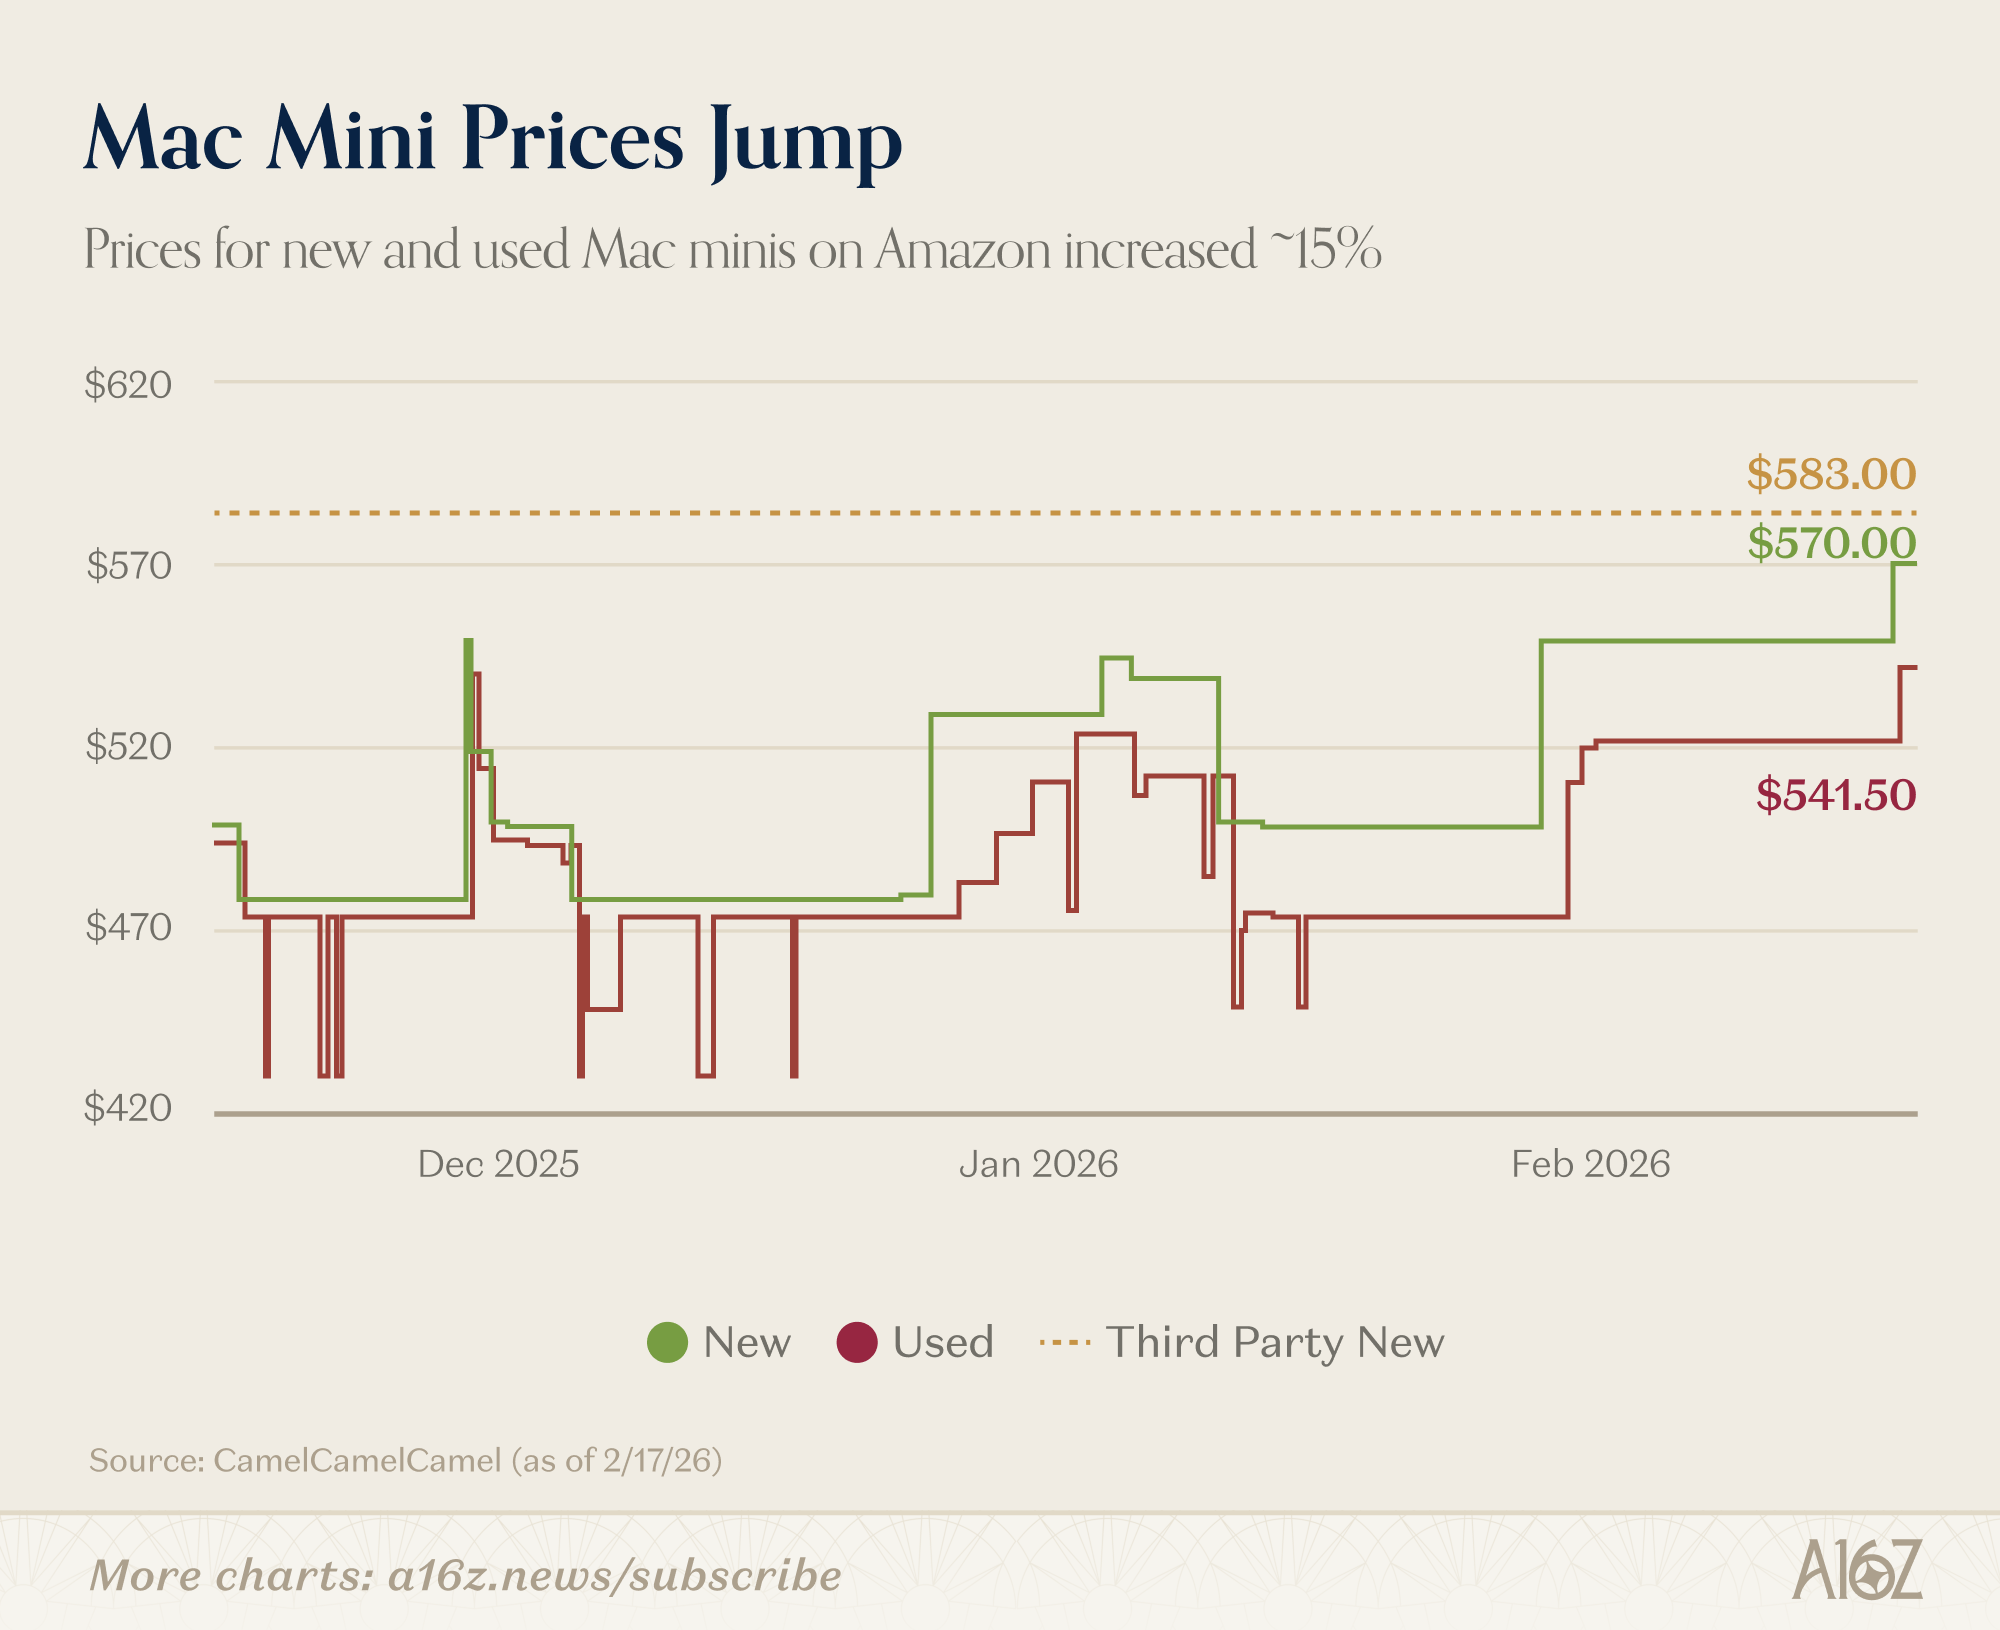
According to the price tracker, CamelCamelCamel, towards the end of January, a Mac mini cost ~$500 and ~$475 new and used, respectively. Those prices have increased ~15% since OpenClaw first took over the timeline, just a few weeks ago.
At $570, a new Mac mini costs nearly as much now, as it did over a year ago, when it first hit the market.
It’s not just Mac minis by the way that are riding the OpenClaw wave
Raspberry Pi has also seen a surge in demand:
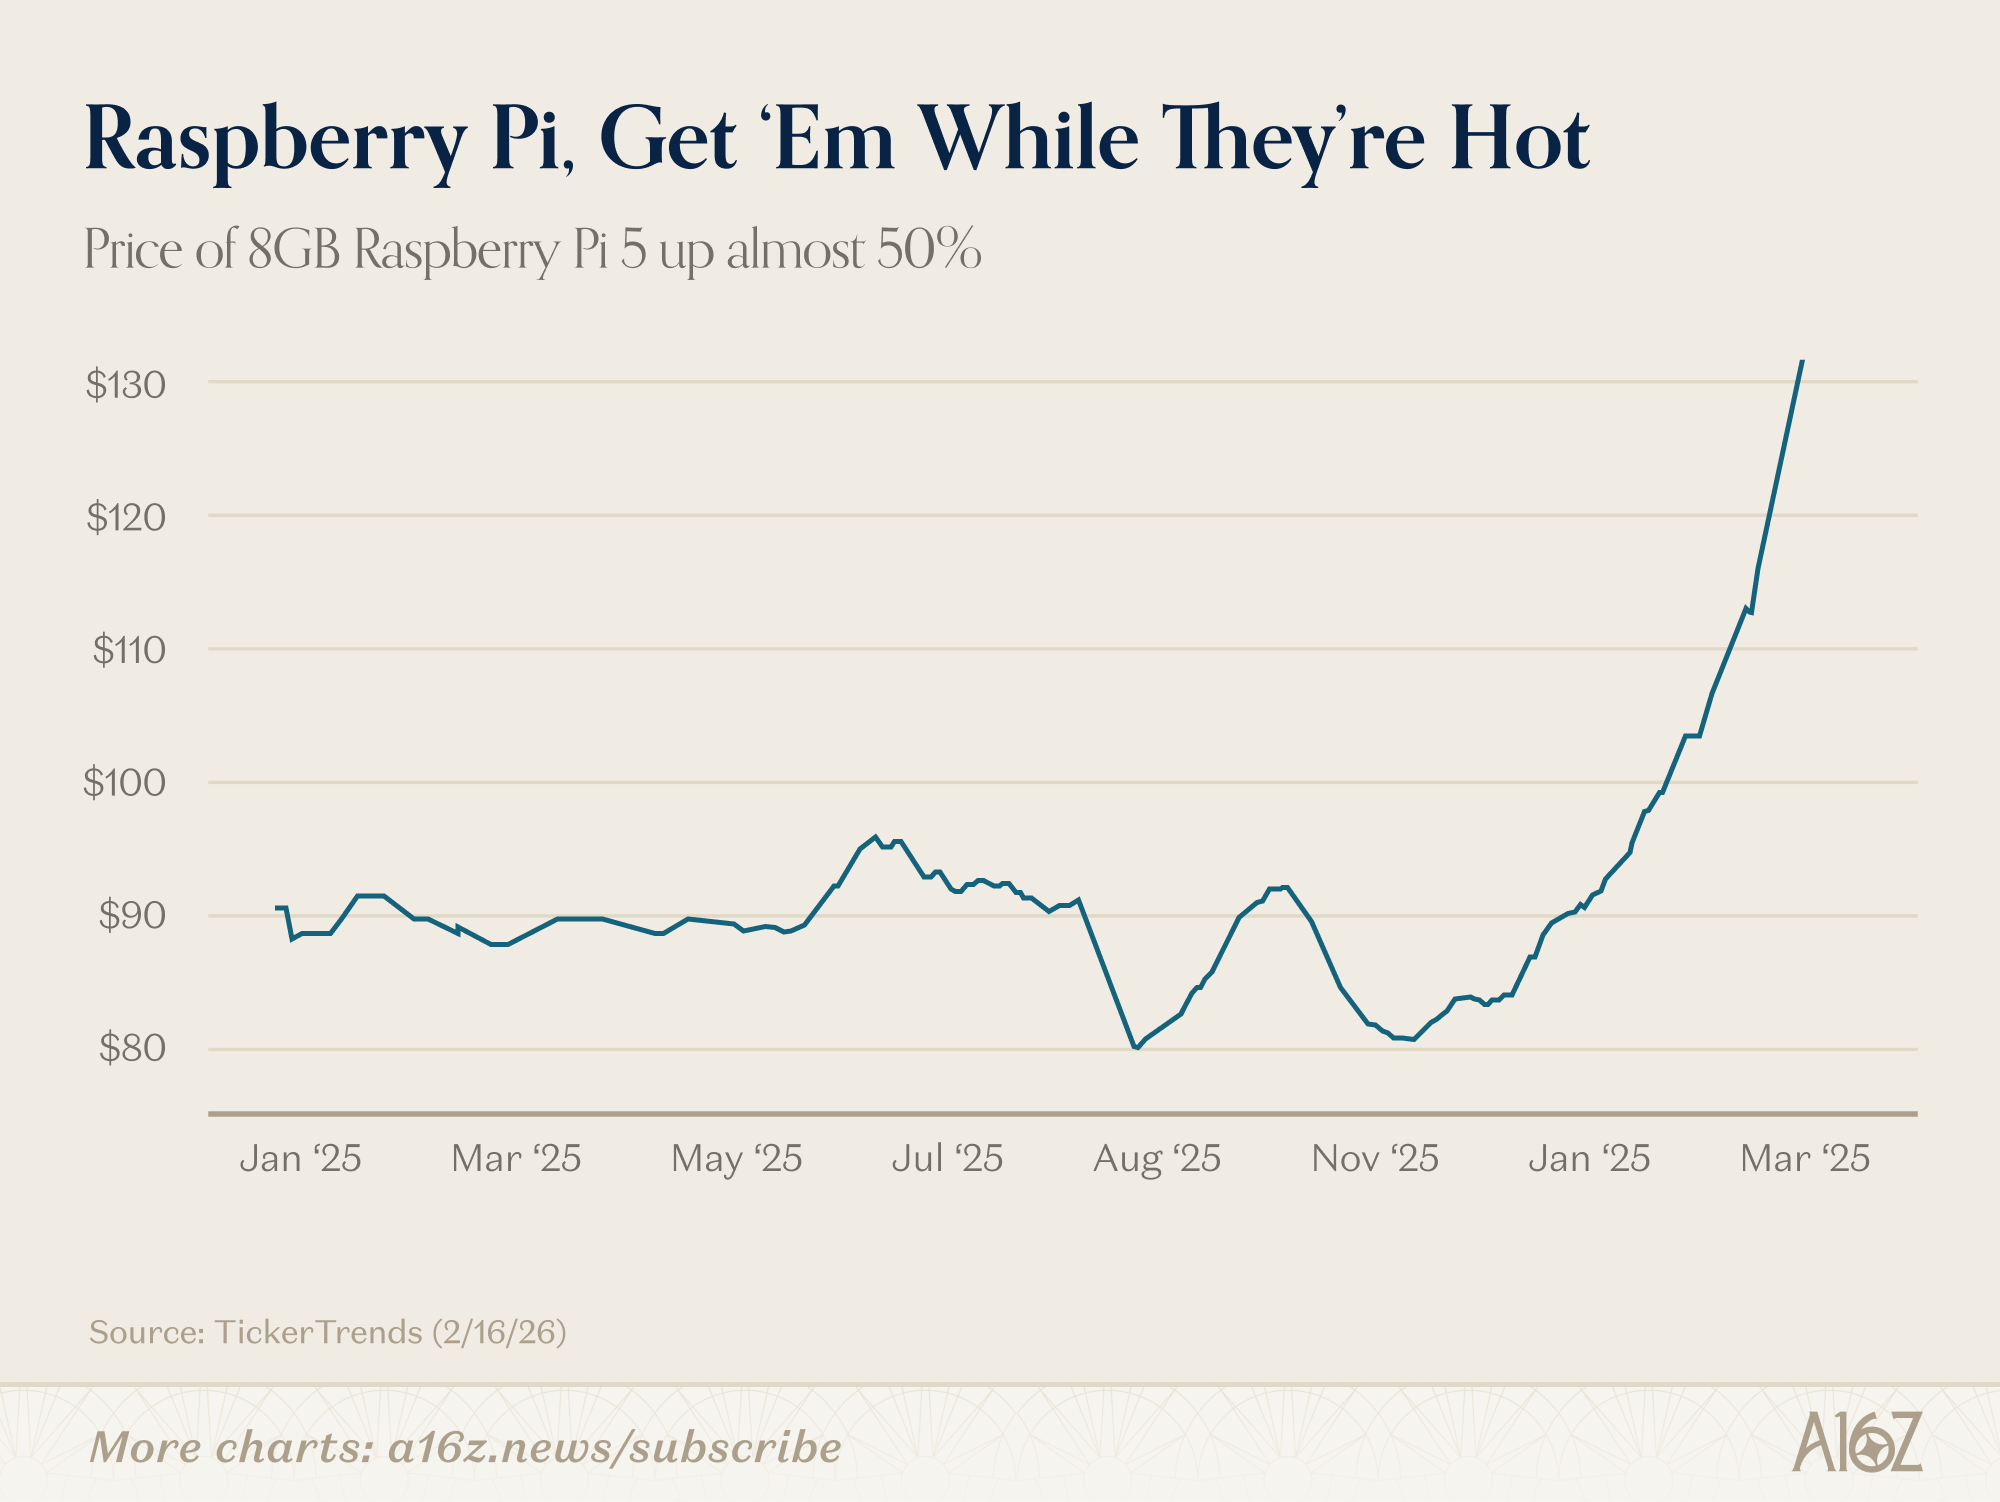
The price of an 8GB Raspberry Pi has surged ~50%
Raspberry Pi is a lower cost, lower performance alternative to the Mac mini, and tutorials for running OpenClaw have been popping up everywhere.
Apple may not be pushing the frontier on foundation models, but if everyone buys your hardware to run them, maybe that’s ok too. There may be a method to Cook’s “madness,” after all.
Of Capex, R&D, and productivity
For big companies, the regular cost of doing business has been in decline for a while (although note the dual-Y axis):
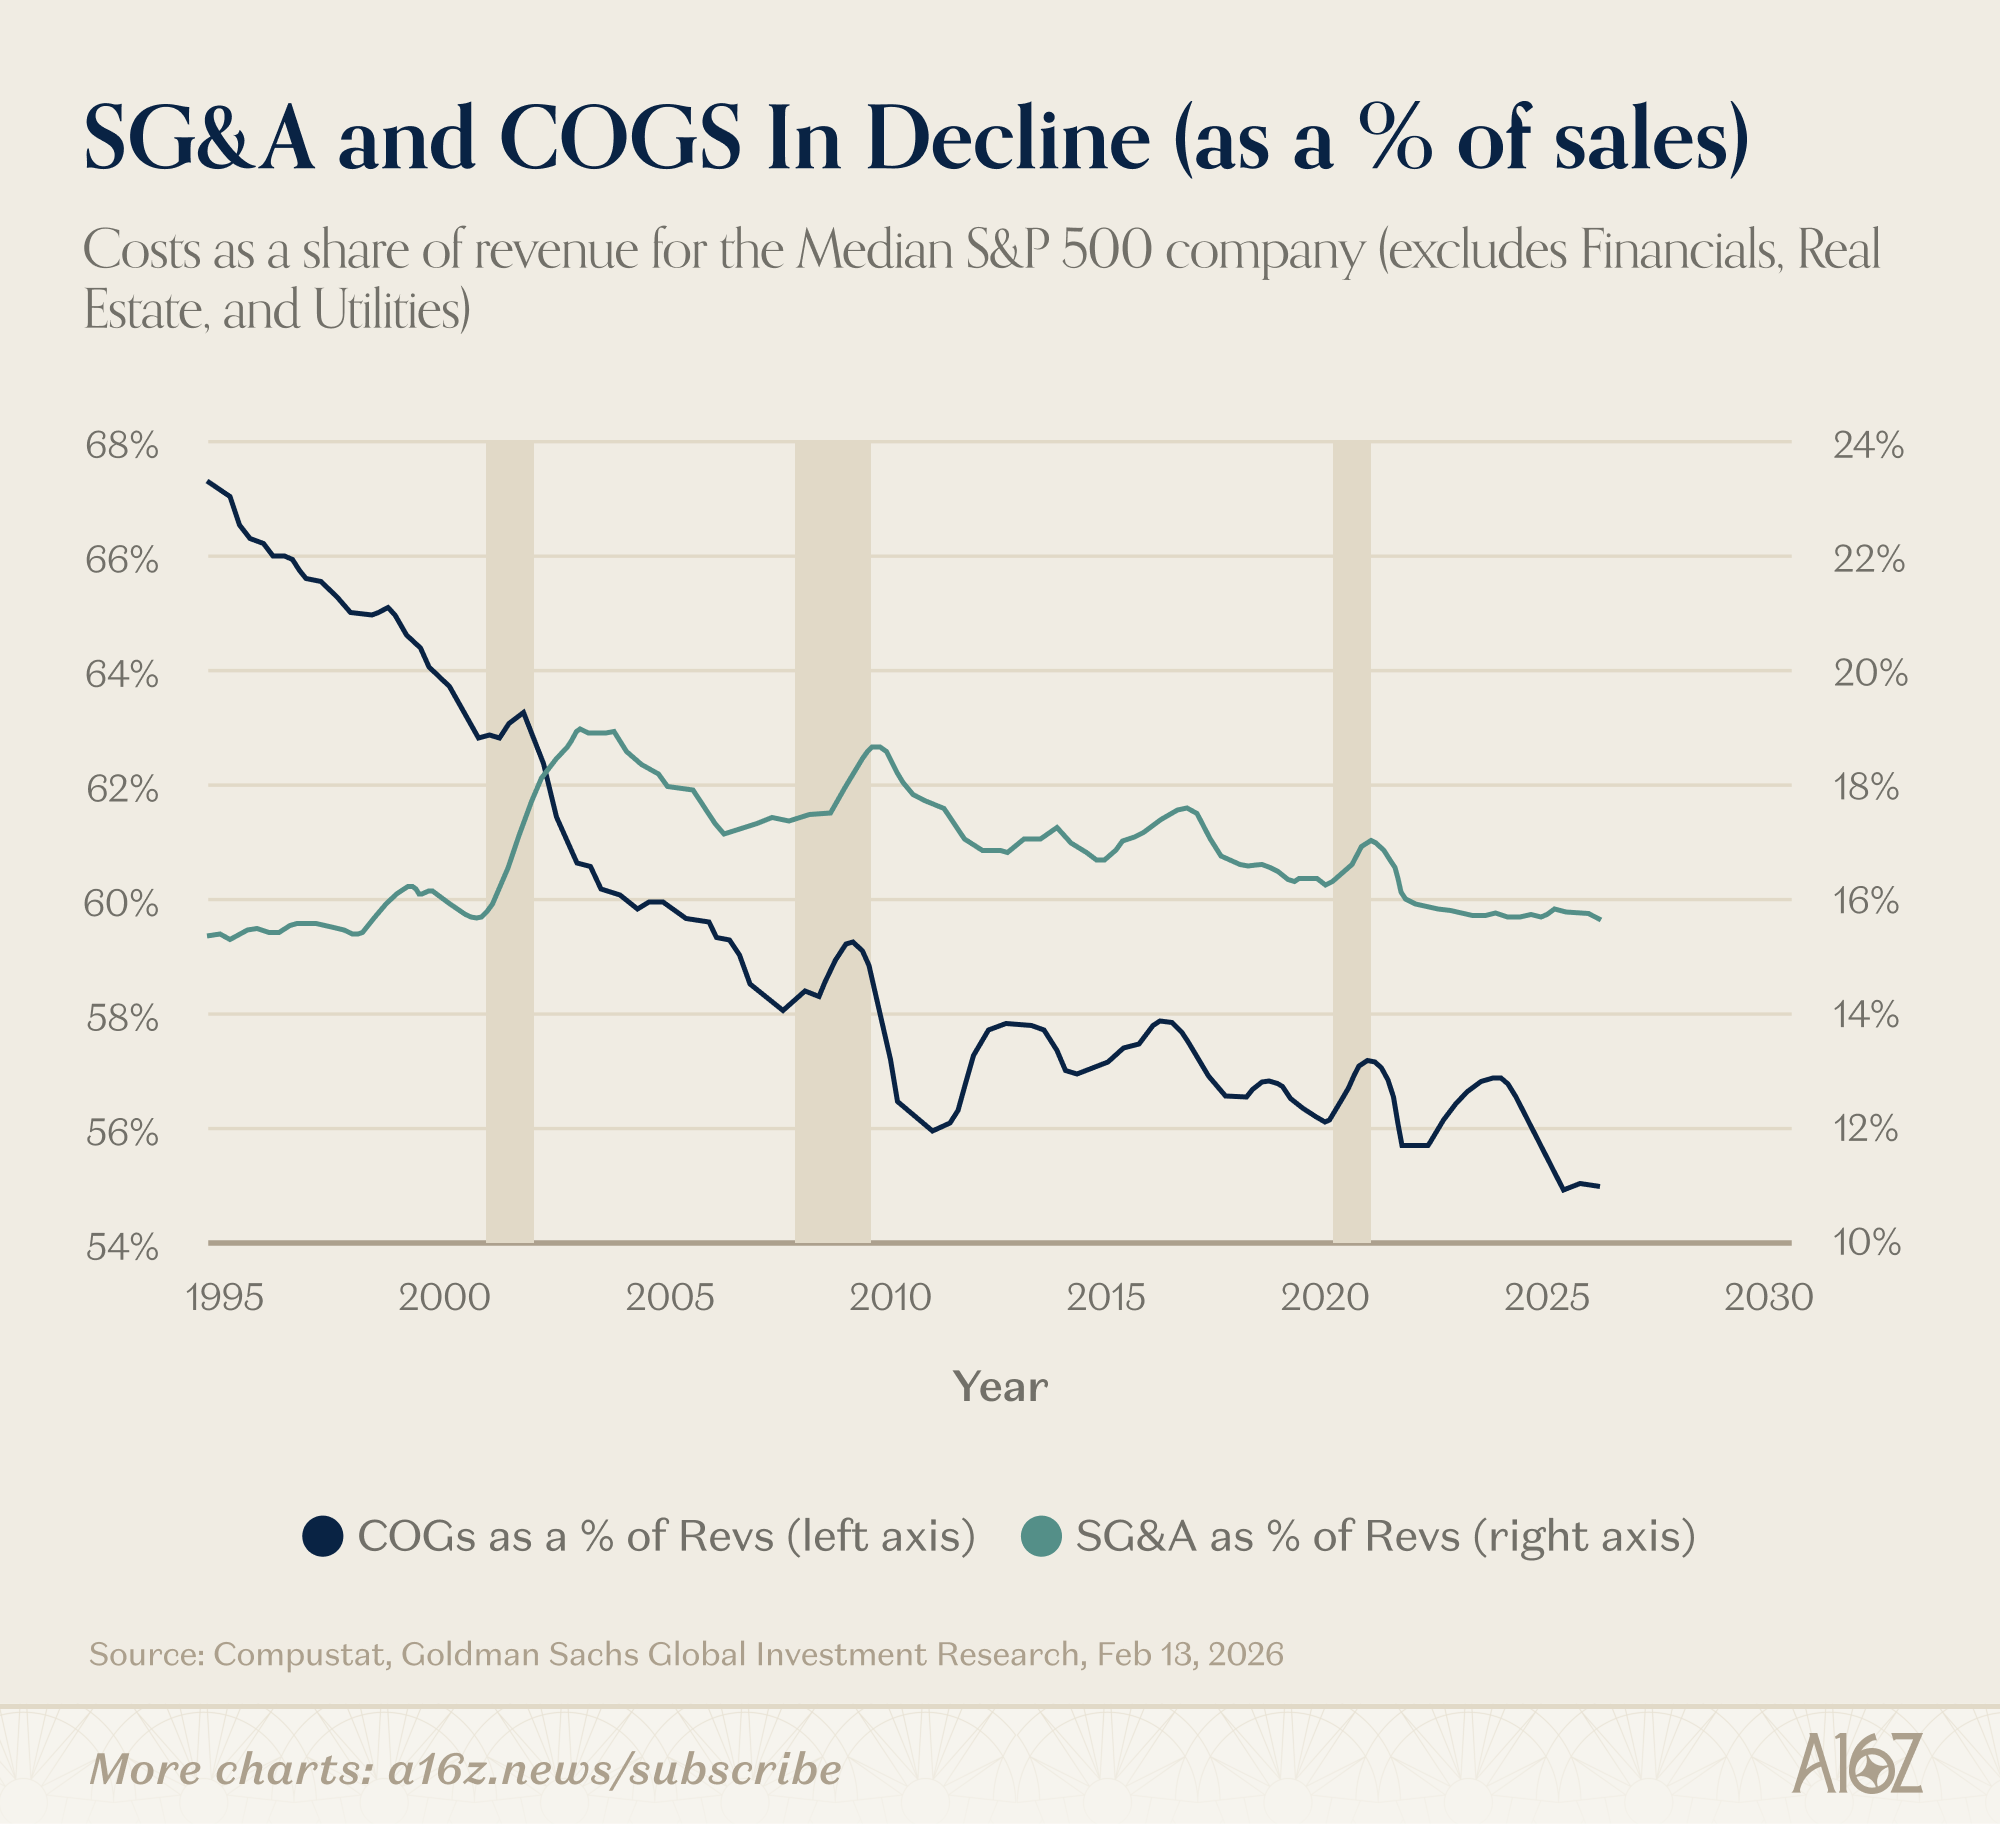
For the median S&P 500 company, SG&A as a share of revenue has been in gradual decline since Dotcom, while COGS as a share of revenue has dropped even more dramatically, going from ~67% to about 55% (and falling) over the last 30 years.
The decline in operating expenses has (unsurprisingly) coincided with a steady rise in operating margins, as well, to now historical highs.
Now, a lot of this is obviously explained by the prevalence of high margin software and tech businesses increasingly dominating the index, but since we’re talking about the median large cap, that’s not the whole story. Another part of the story is tech itself making companies more efficient, as they’ve been able to scale their organizations, while keeping operating costs in check.
The reward for good work, though, is more work. And having pushed margins to historical highs, the market may be asking “what have you done for me lately,” especially as AI disruption increasingly enters the zeitgeist.
The question now, then, is whether companies continue to cut costs (or at least keep them in check), or do they now begin to invest towards the promise of a better tomorrow, perhaps even by increasing their tech budgets (to the delight of beleaguered SaaSCos and AI upstarts alike).
For now, “expense management” continues to be the word of the day:
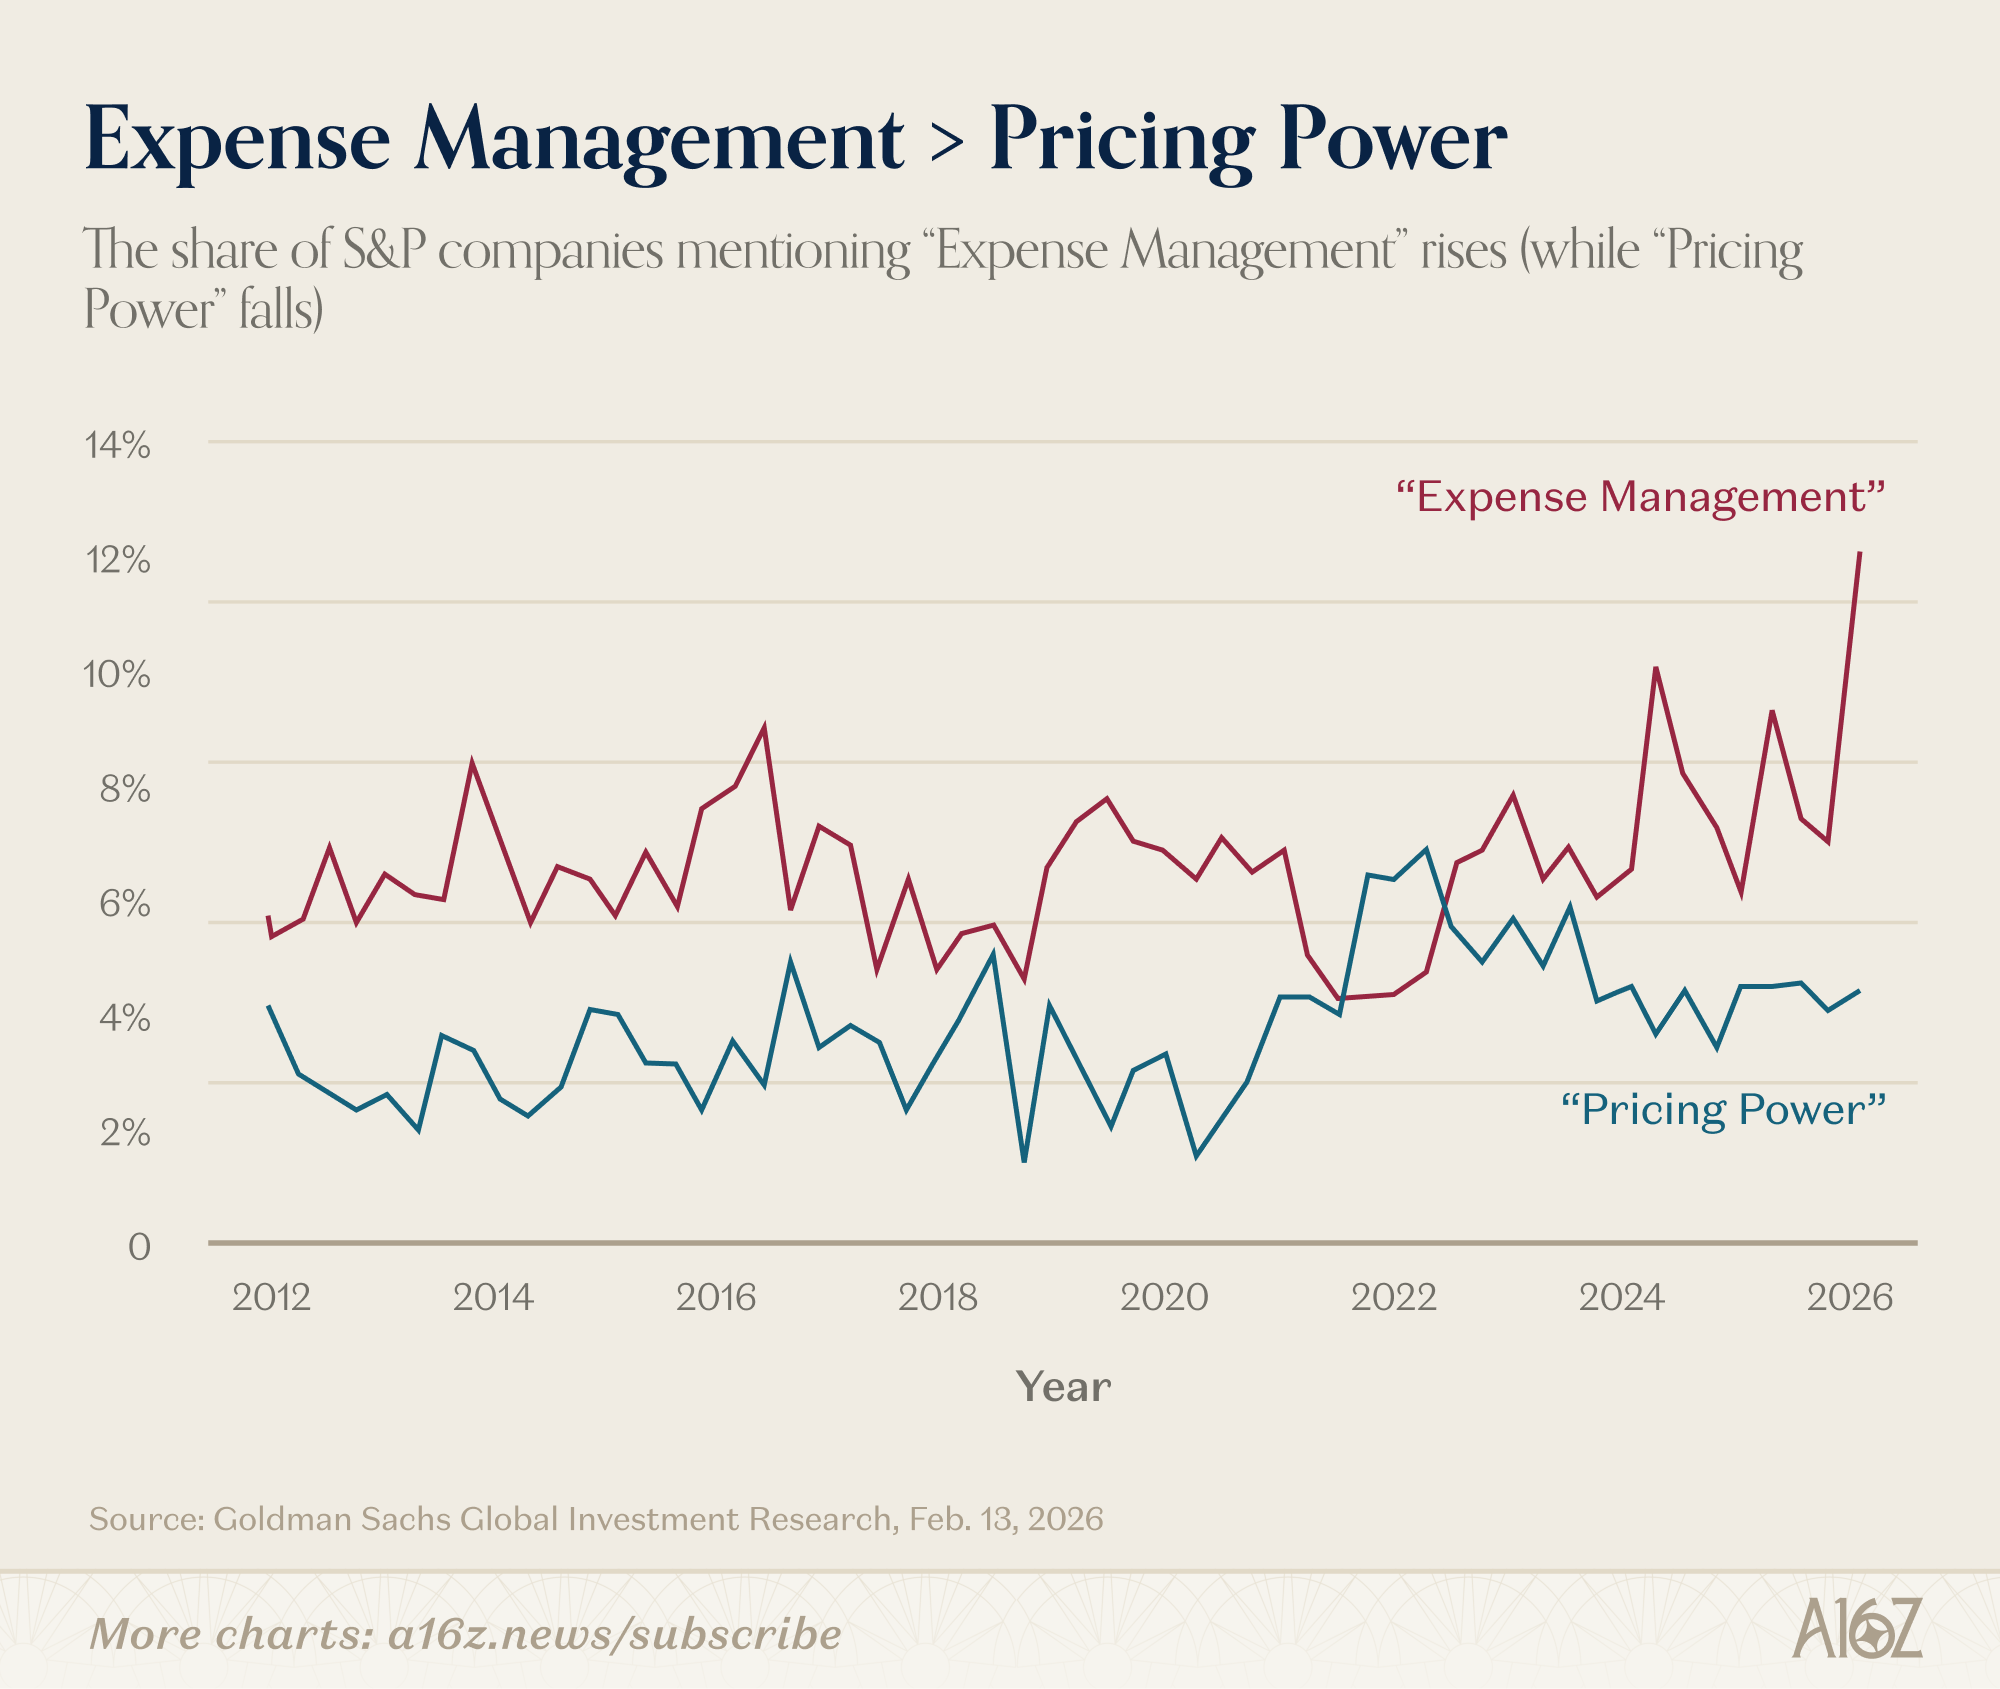
The share of companies mentioning “expense management” on earnings calls has begun to rise substantially.
Generally, “expense management” is the opposite of “invest” and/or “spend,” and protecting margins may be the name of the game.
To be fair, R&D at least, does appear to be on the rise:
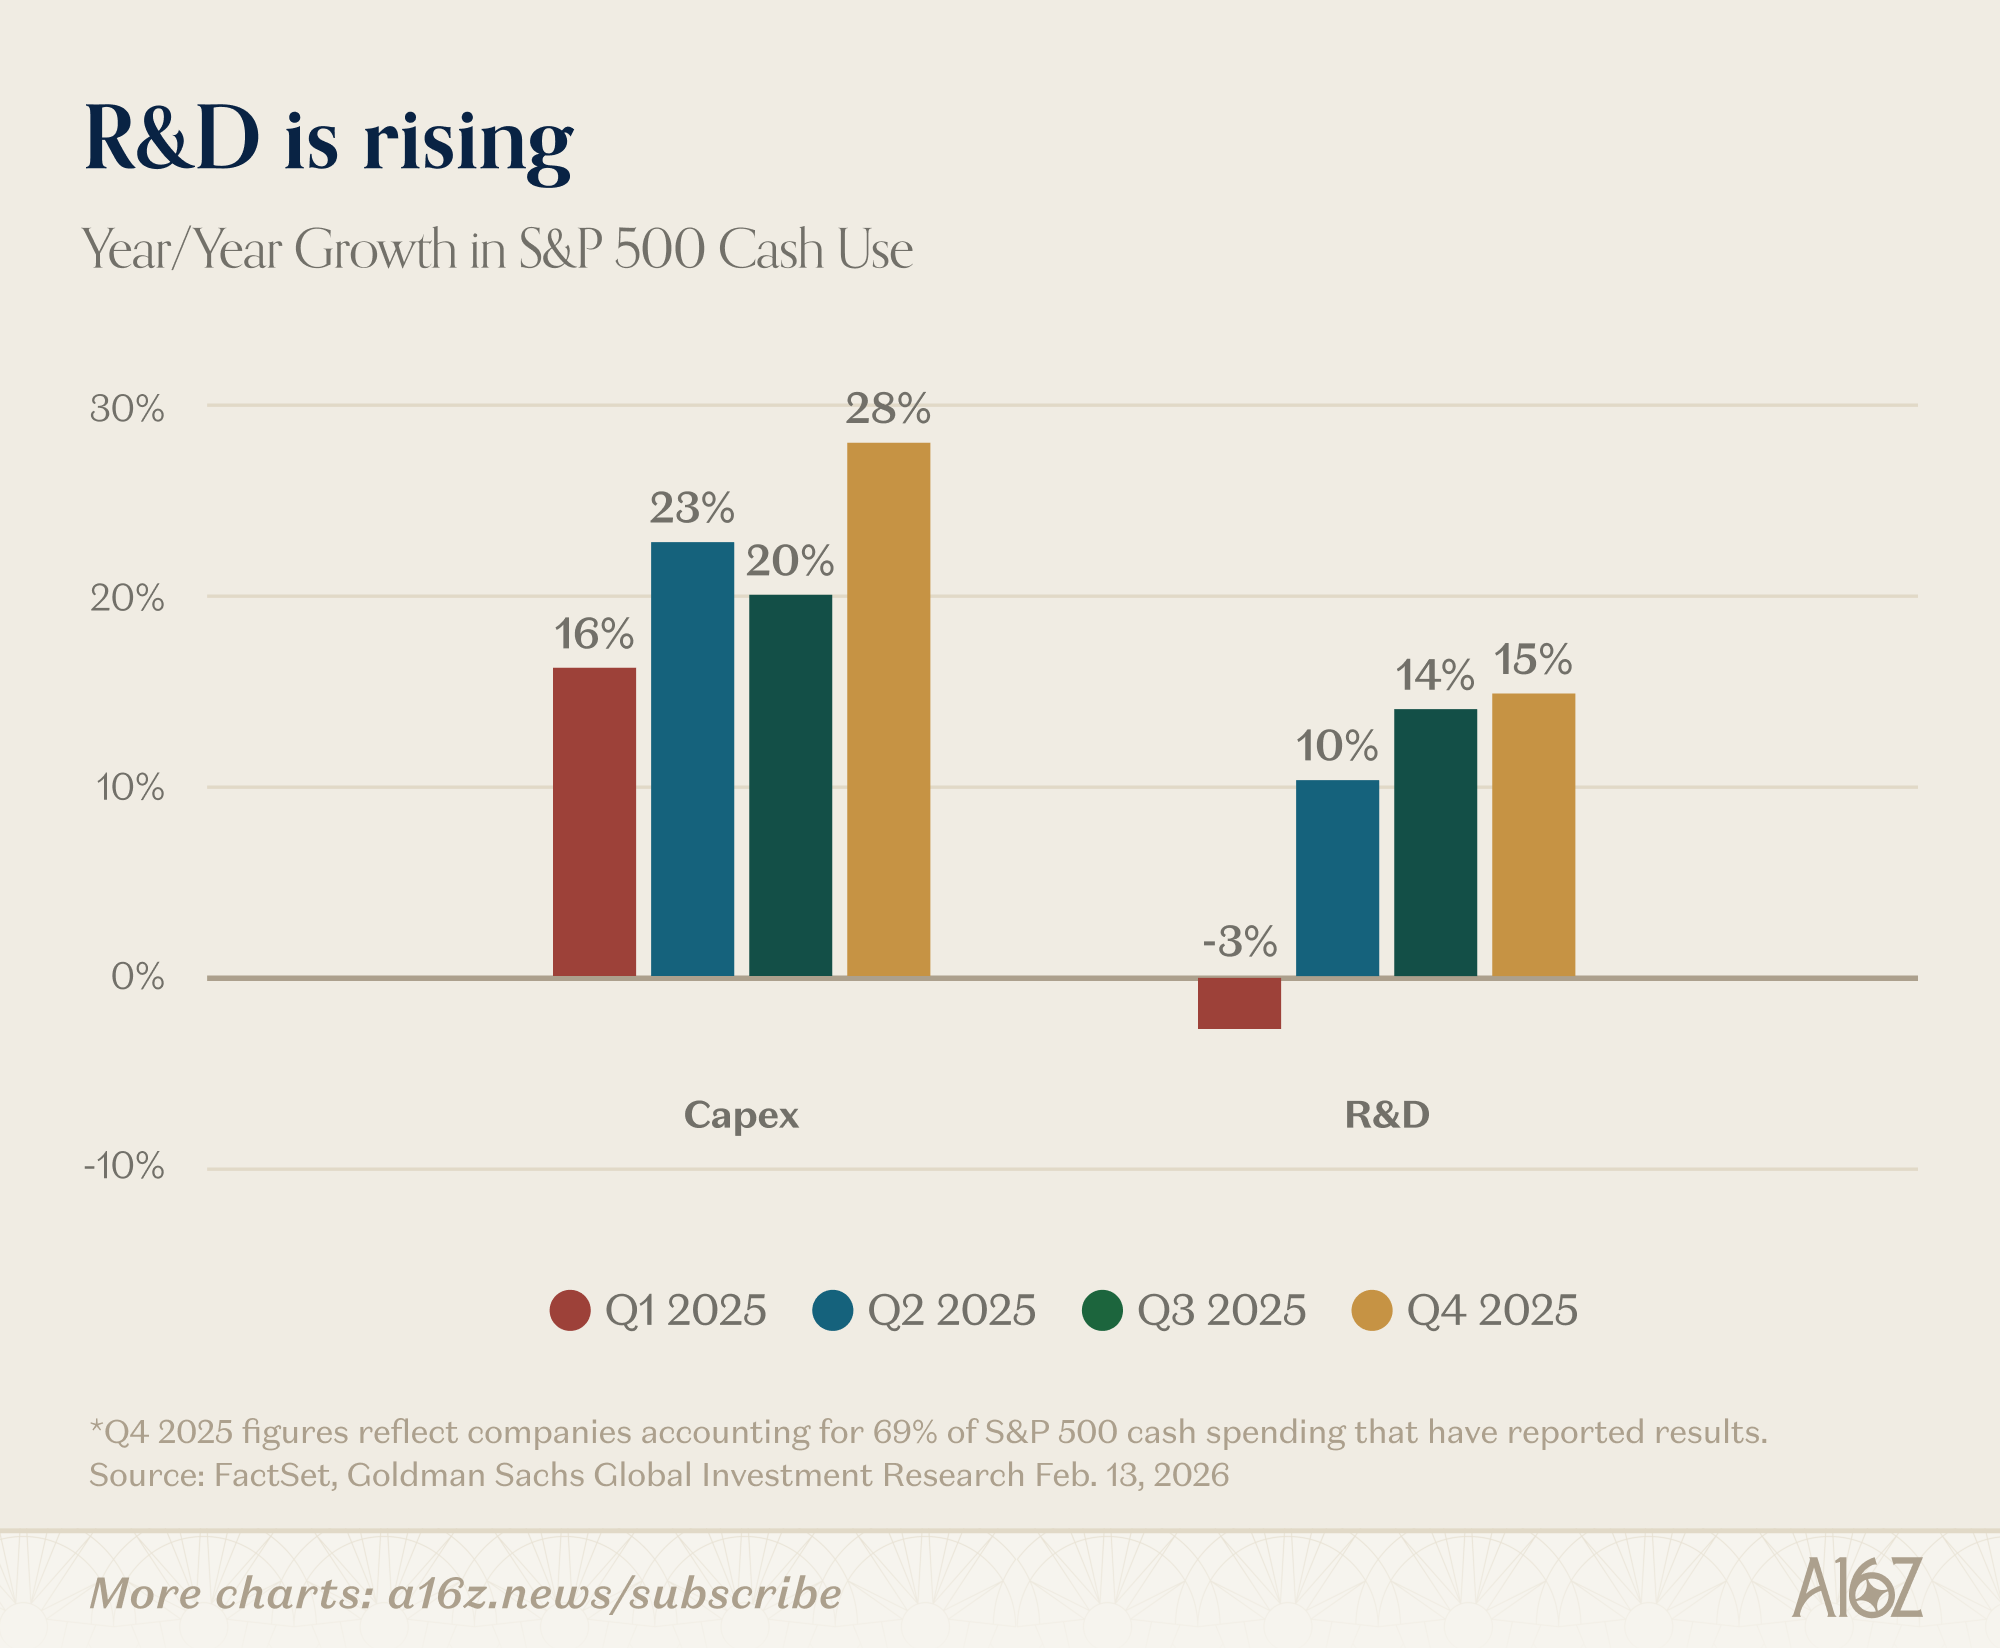
Capex we know has grown (driven almost entirely by the hyperscalers), but R&D has grown 15% YoY (with growth accelerating as the year went by).
R&D is on the “build” side, generally, less so than “buy” (and as per above, SG&A costs as a % of revenue are still in decline).
For privately held companies though, there’s at least some evidence that buying tech has become a recent priority:
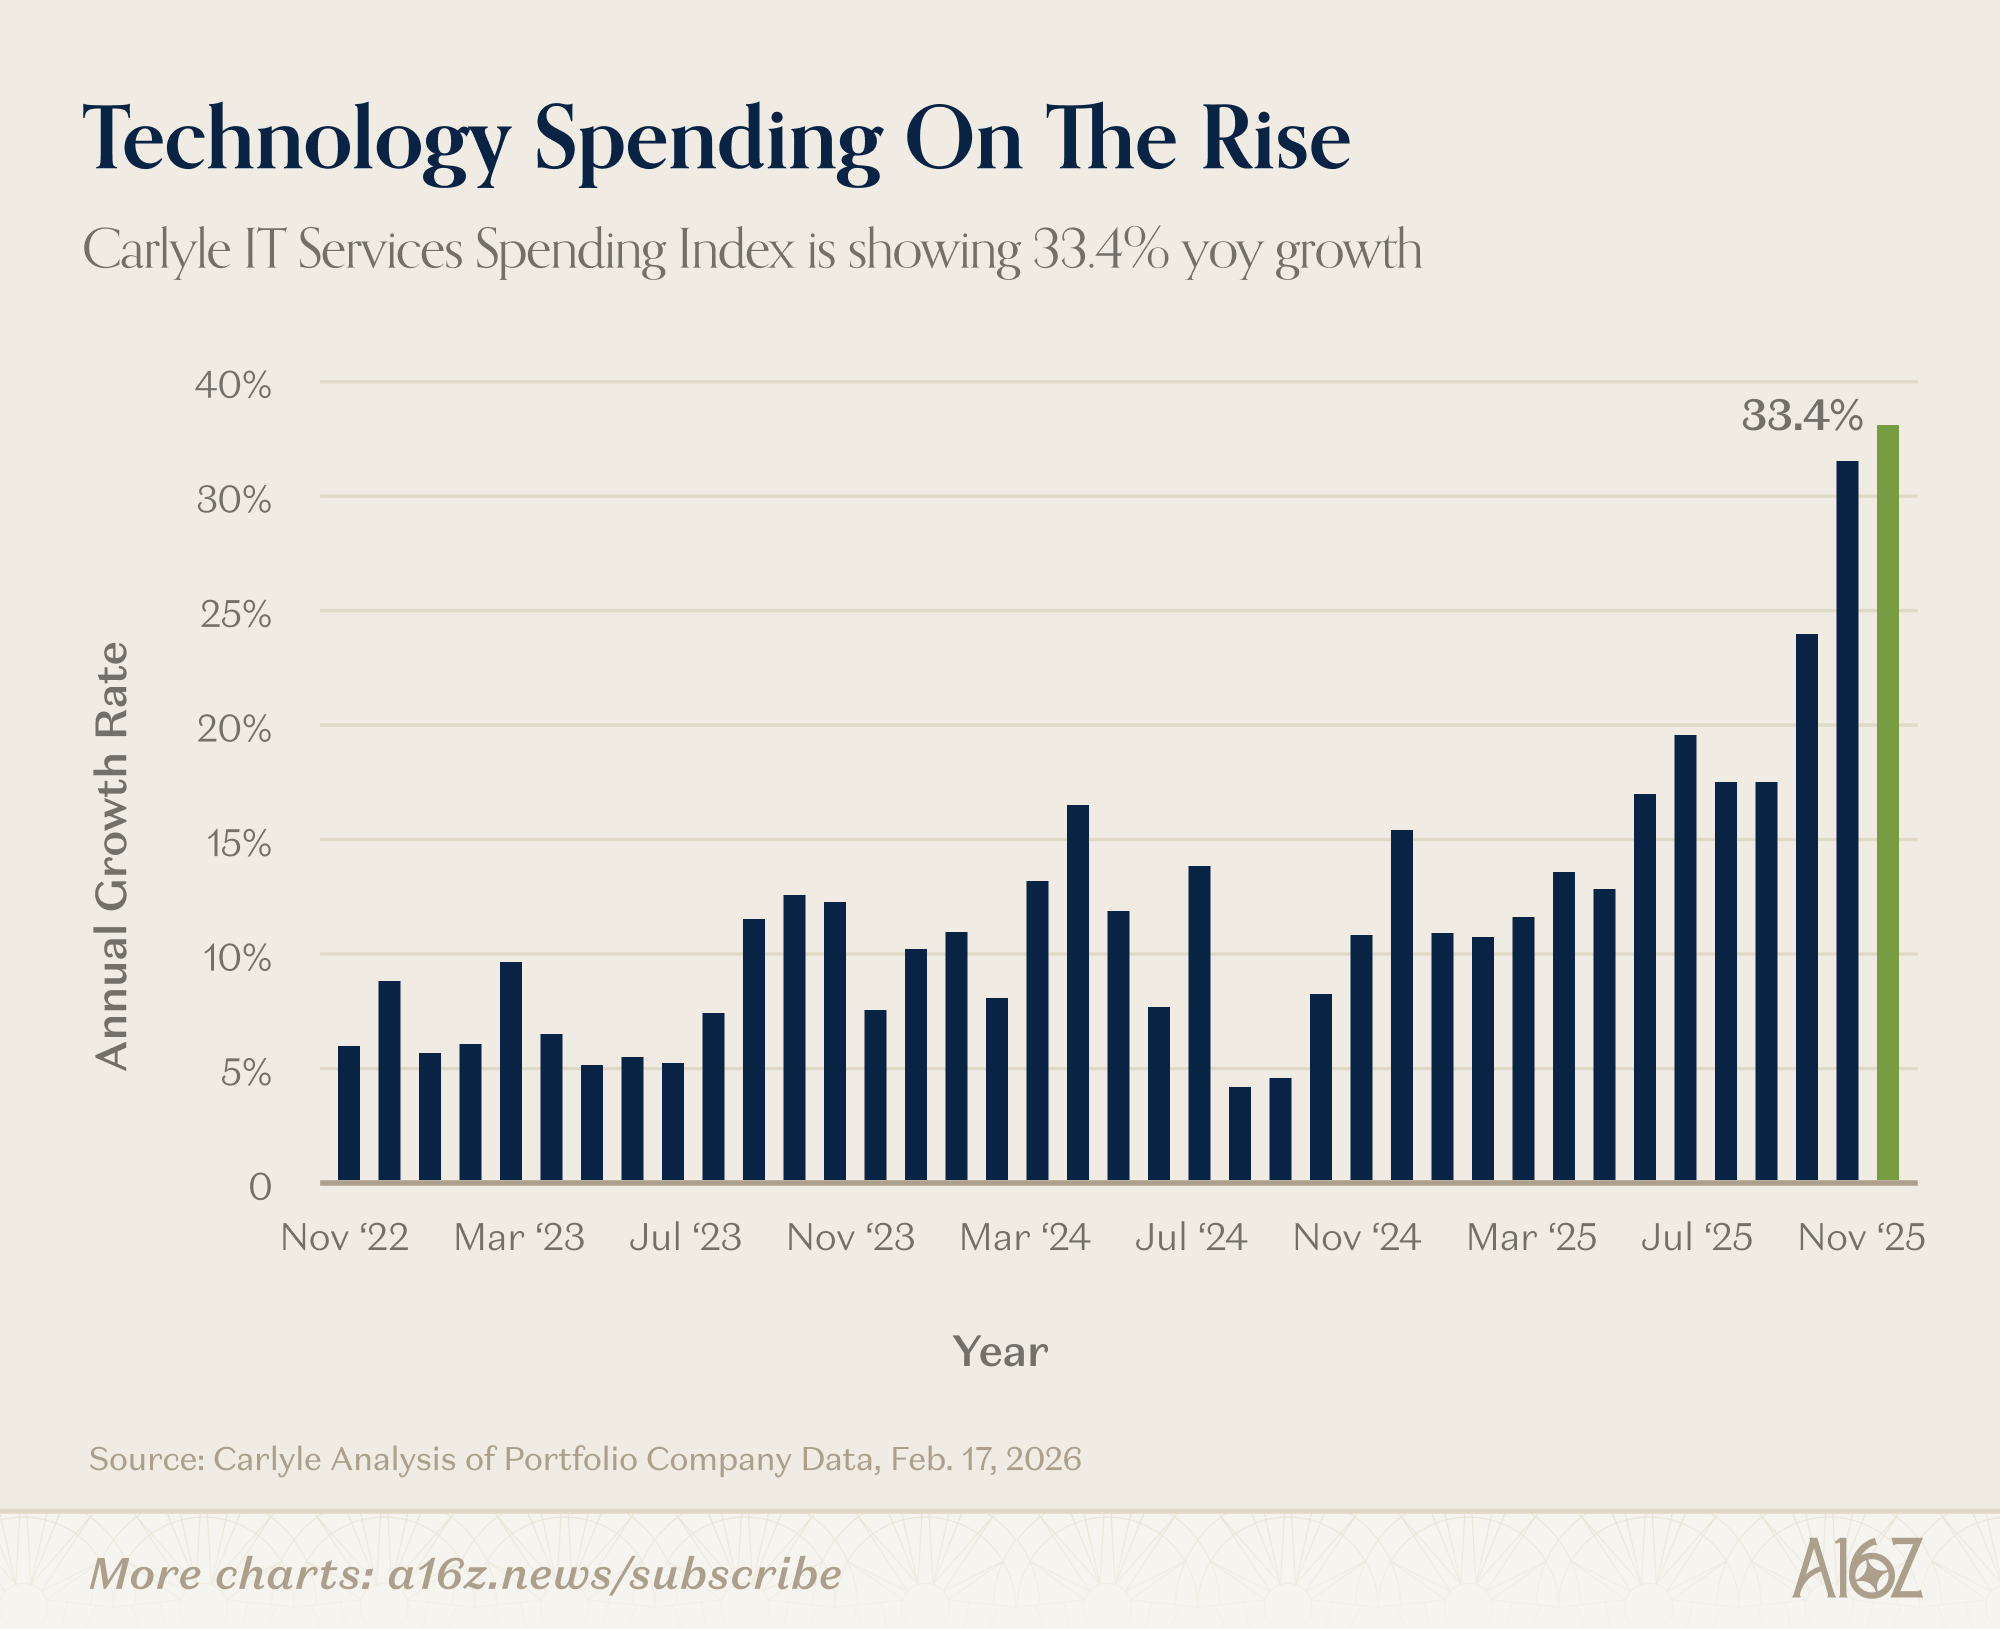
According to the Carlyle IT Service Spend Index, which is a composite of private portfolio companies, IT Service Spending is growing over 33% per year.
Now that’s just the companies in Carlyle’s sample, but IT spending is growing ~3x more quickly than it was just a year ago. Gotta spend money to make money, if you’re a private company, at least.
The other interesting thing here is the relative incentives PrivateCos have to invest in the future. While PublicCos are worried about getting hammered on margins by the public market, PrivateCos can ramp their spend without worrying about any volatility whiplash.
‘Volatility laundering’ is good, actually.


This newsletter is provided for informational purposes only, and should not be relied upon as legal, business, investment, or tax advice. Furthermore, this content is not investment advice, nor is it intended for use by any investors or prospective investors in any a16z funds. This newsletter may link to other websites or contain other information obtained from third-party sources - a16z has not independently verified nor makes any representations about the current or enduring accuracy of such information. If this content includes third-party advertisements, a16z has not reviewed such advertisements and does not endorse any advertising content or related companies contained therein. Any investments or portfolio companies mentioned, referred to, or described are not representative of all investments in vehicles managed by a16z; visit https://a16z.com/investment-list/ for a full list of investments. Other important information can be found at a16z.com/disclosures. You’re receiving this newsletter since you opted in earlier; if you would like to opt out of future newsletters you may unsubscribe immediately.
Expense management on the rise... while tech spend is also on the rise. Totally makes sense. LOL. At this point, throw tokens at the problem.
Thanks for sharing and with the surge of AI Agents, we created Vex (tryvex.dev) - this to ensure that agents running will not deviate or hallucinate from the JTBD.