

Charts of the Week: 'Is Tech Cheap, Now?'
AI Favors the Activists (the other kind); Quantifiable AI Benefits Rising; Oil Matters Less than it Used to; The Most Expensive Affordable Grocery Store Ever


America | Tech | Opinion | Culture | Charts
Check out a16z GP Martin Casado’s recent Financial Times feature: It’s not that hard to build AI models.

Goldman Wonders ‘Is Tech Cheap, Now?’
Software and Tech have sold off so dramatically that one could now make the argument that they’re actually cheap—well, not just any “one,” but none other than Goldman Sachs Research.
As Goldman Sachs Research lays out, it used to be that tech and software stocks traded a big premium, reflecting faster topline growth, and a margin profile that only zero-marginal-cost tech could offer.
As of April 8th, that premium has (mostly) evaporated:
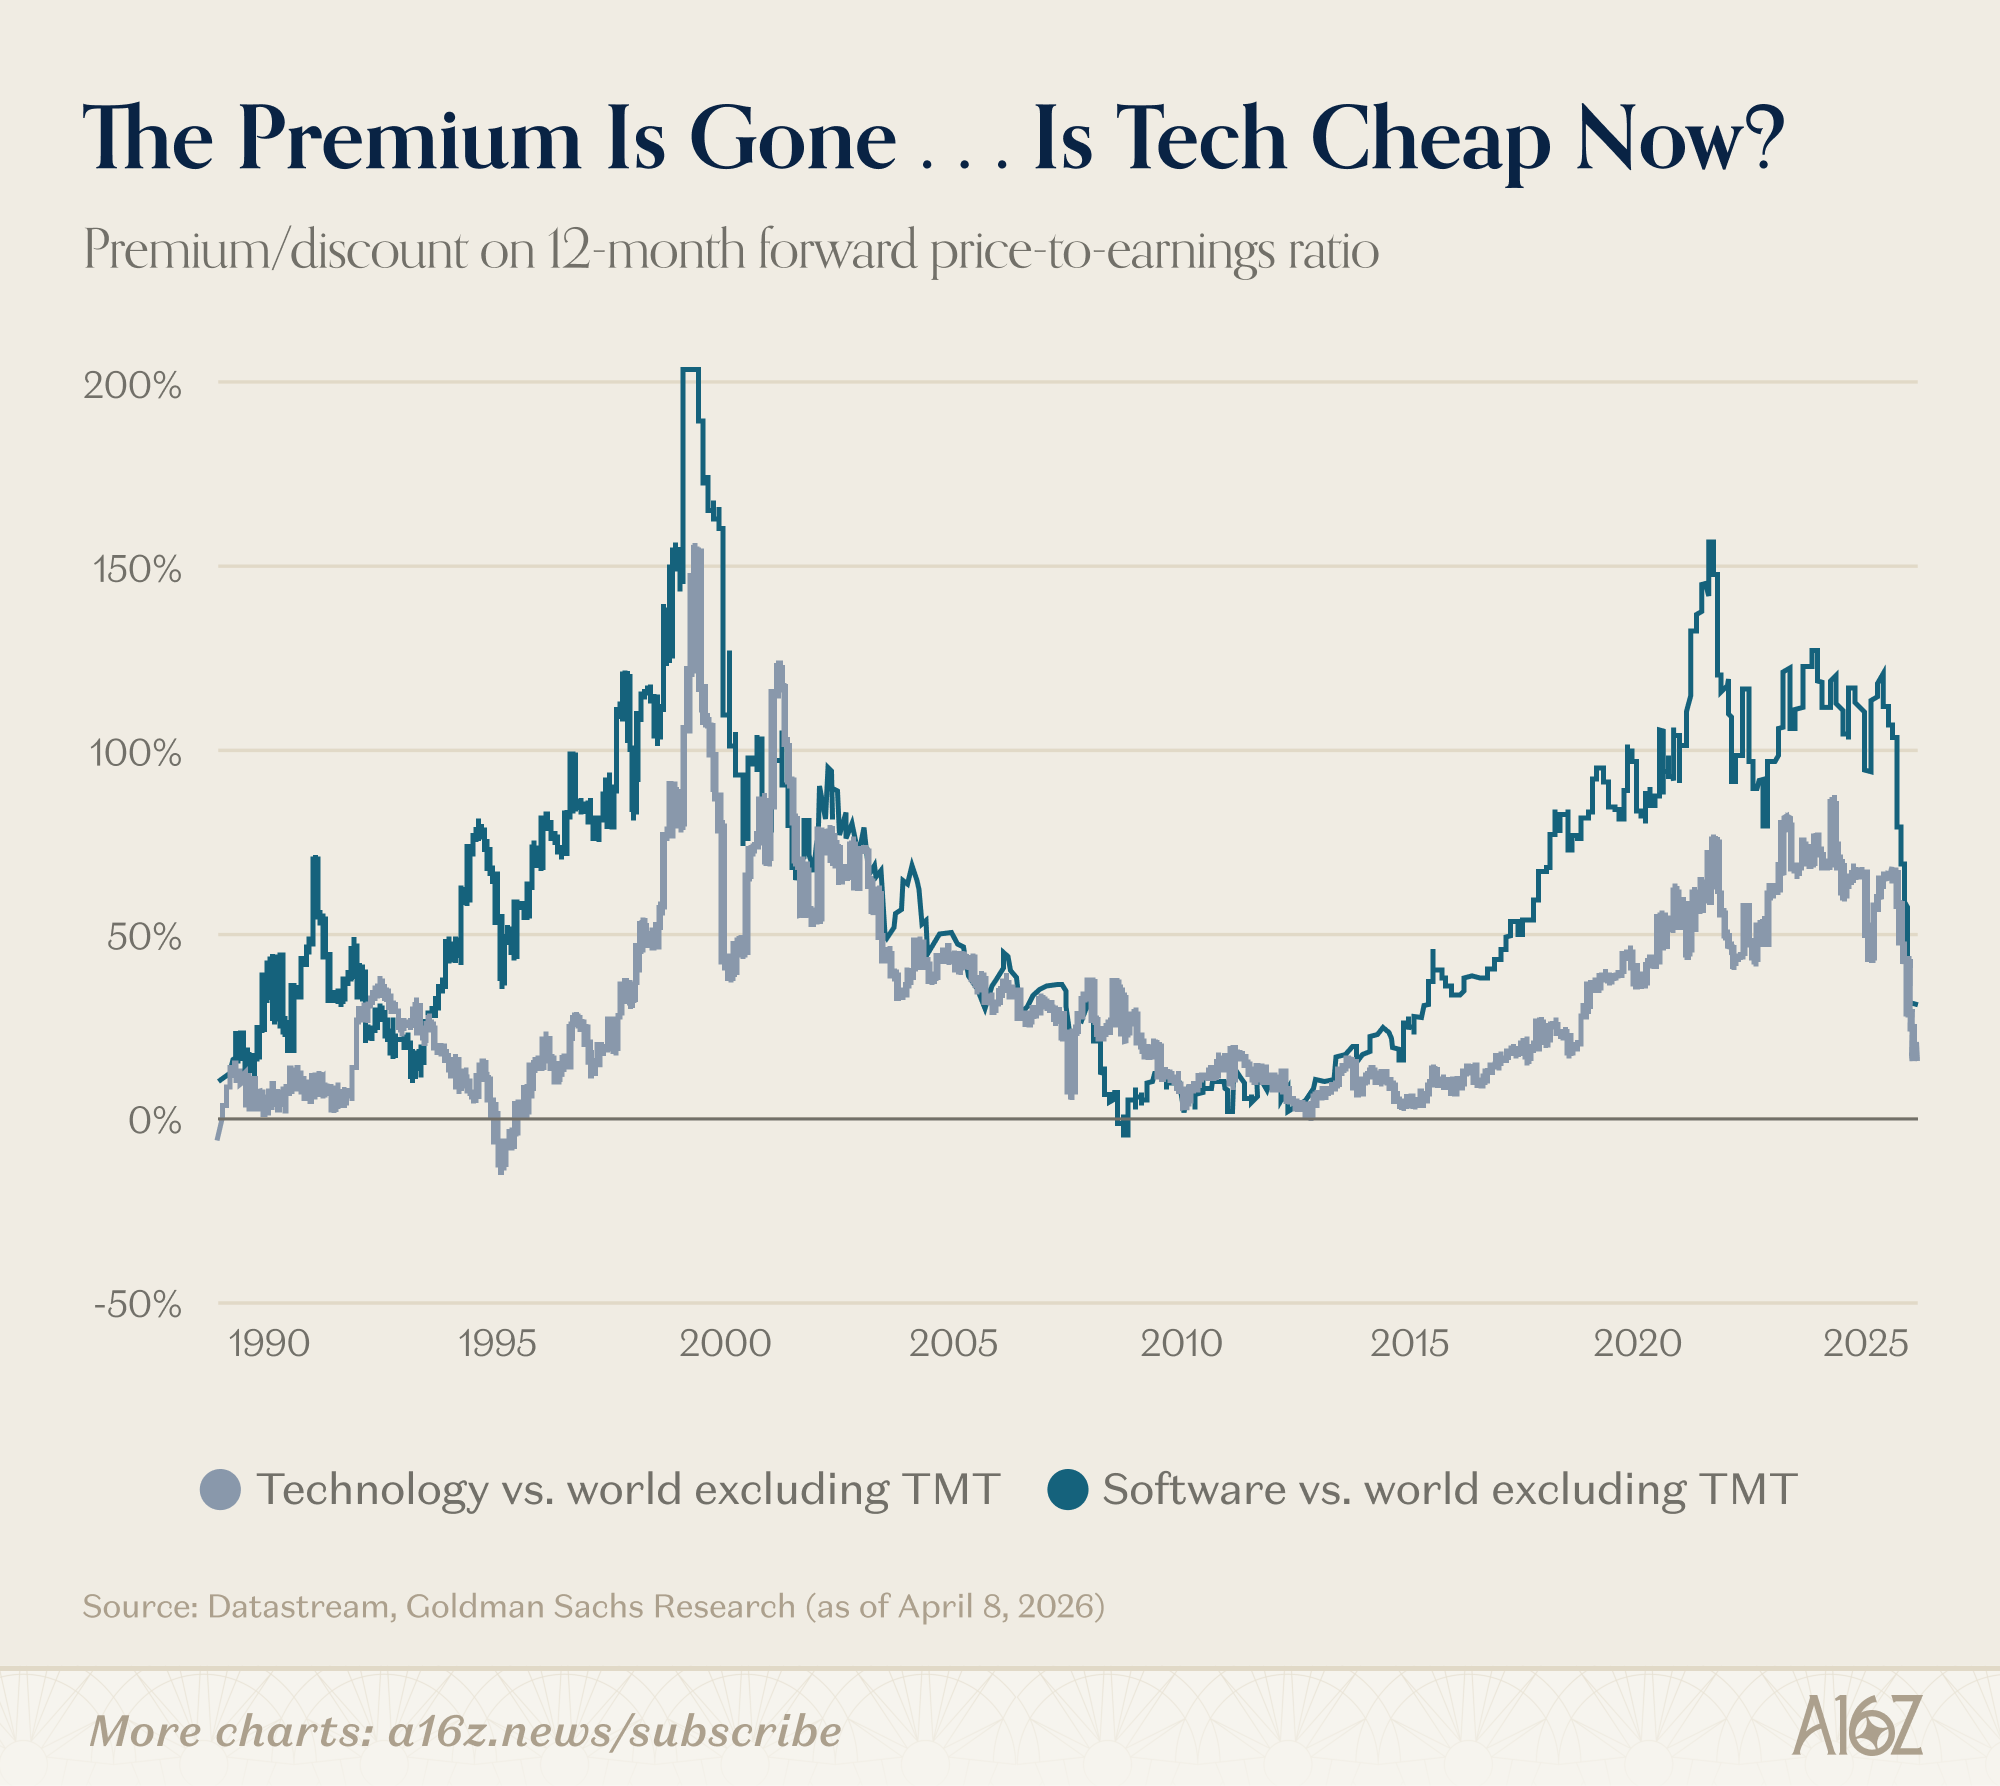
Tech and Software earnings are still trading at a ~25% premium to the rest of the market, but that’s a fraction of what it was only a year ago, and back in-line with ~2018 levels.
Globally, the technology sector now has a price-to-earnings ratio below that of the consumer staples and industrials sectors. As we’ve observed before, Big Box retailers are more expensive than the hyperscalers.
The really interesting thing, however, is that despite the rising discount on tech earnings (or at least, the diminishing premium), tech earnings themselves continue to grow. So far in 2026, according to Goldman, tech companies have upward revised their earnings by more than any other sector globally.
Indeed, Tech earnings growth expectations are running at more than double the market’s, and they’ve been climbing through the entire selloff.
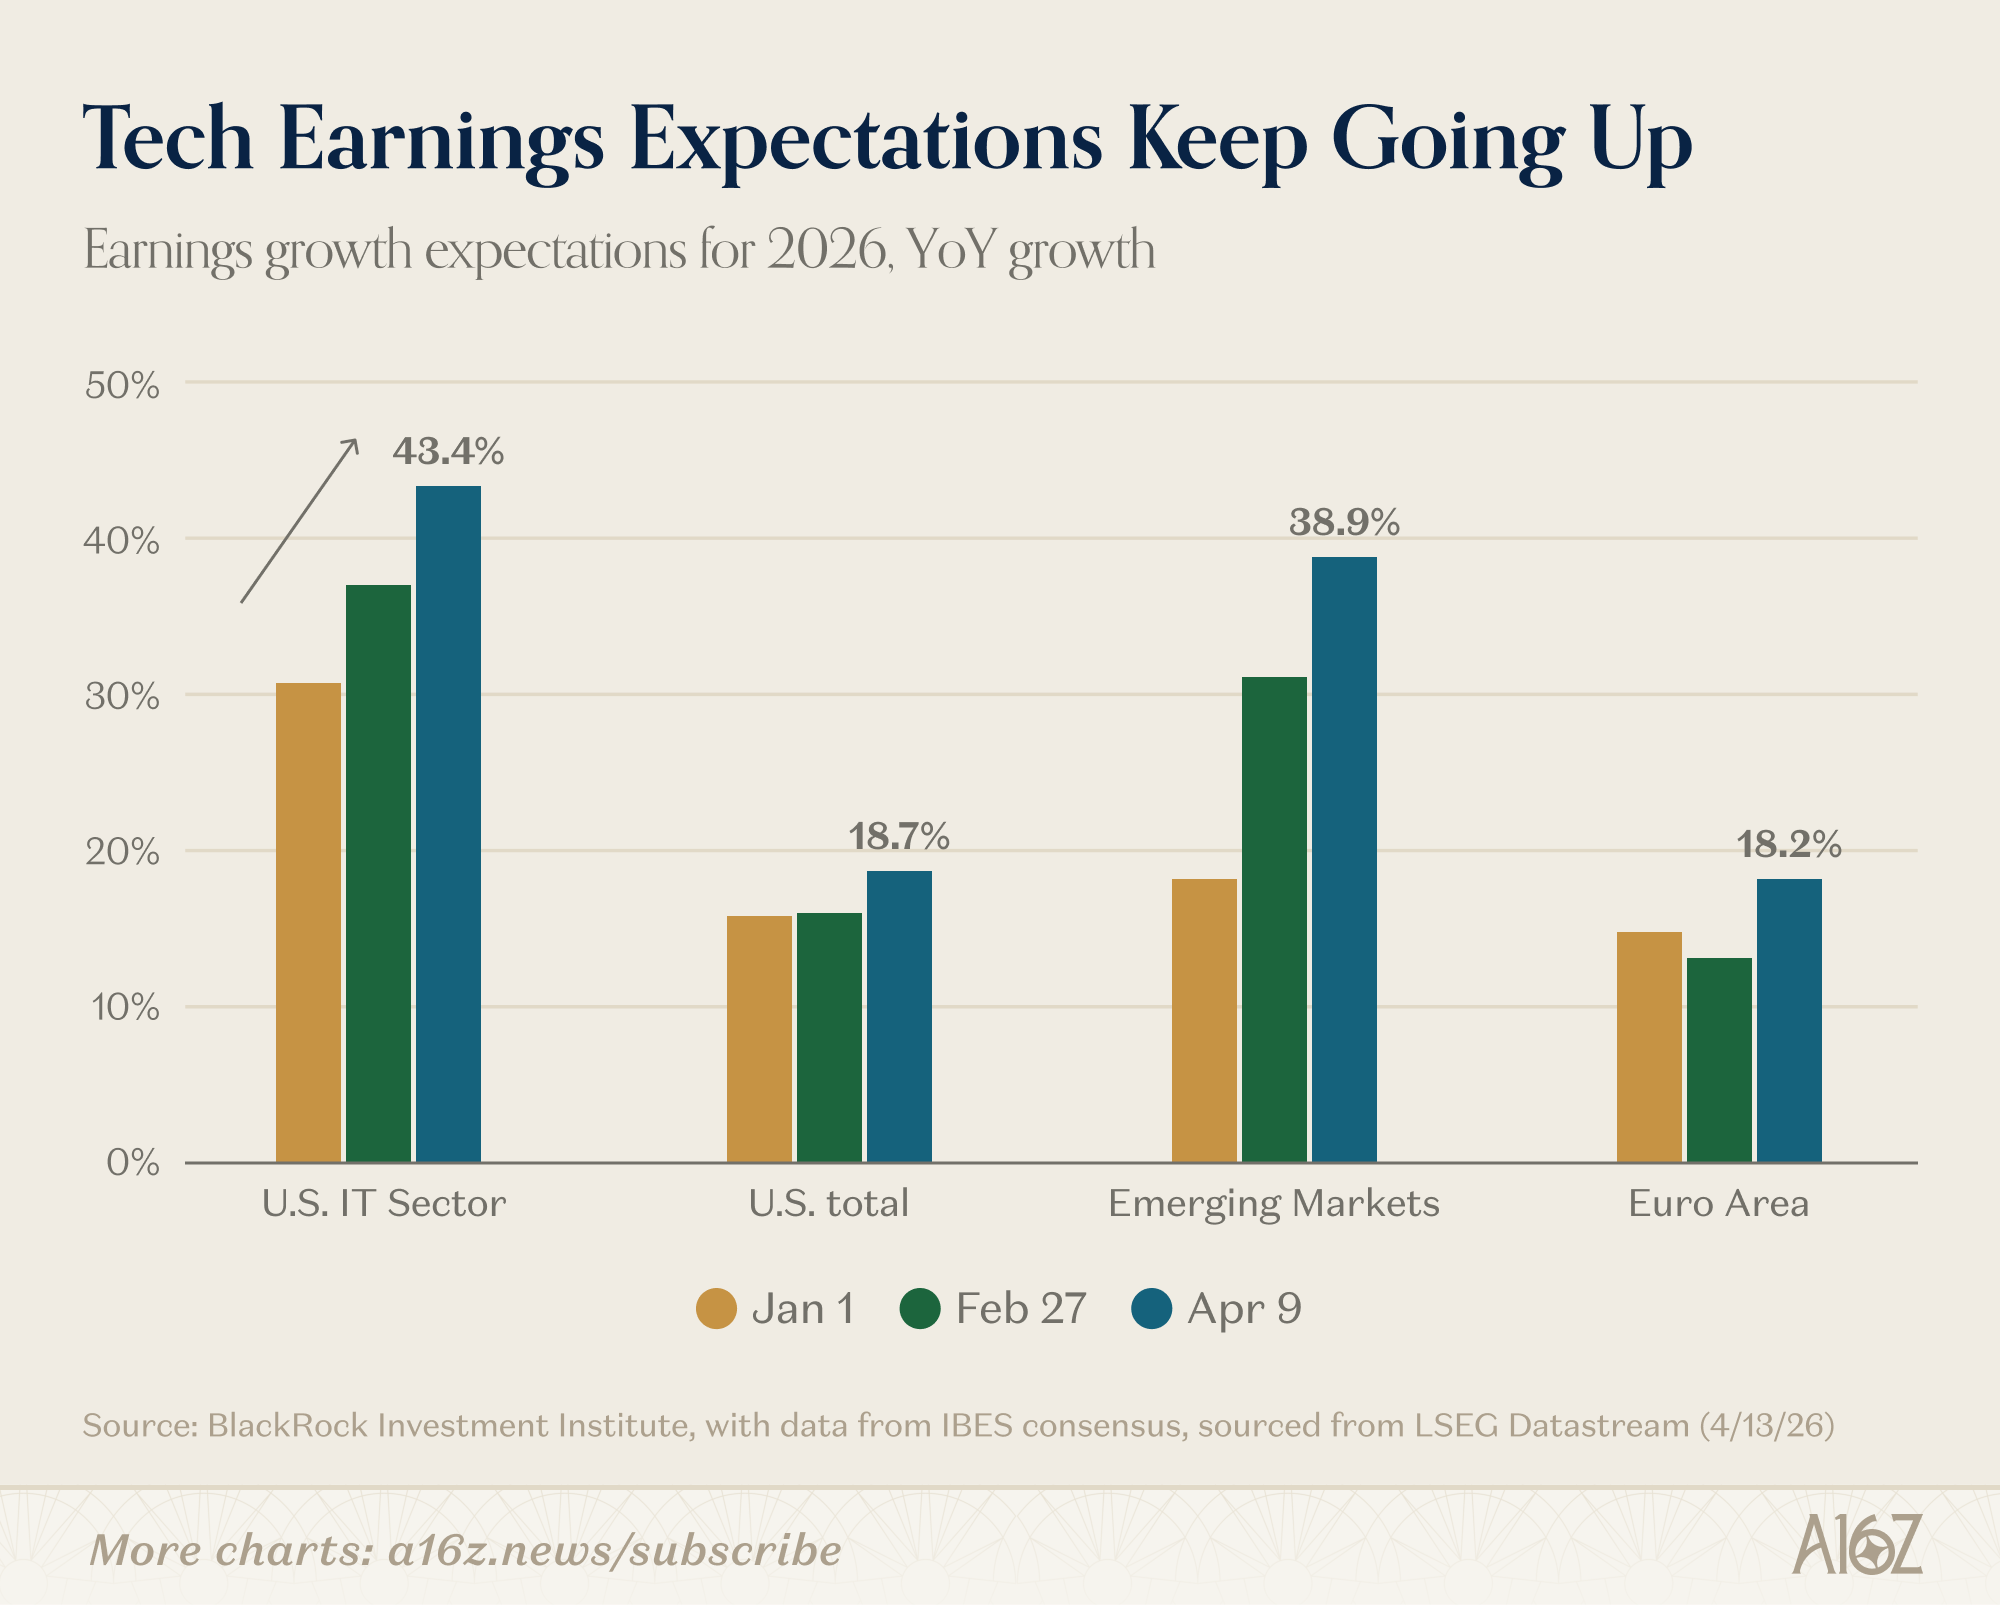
BlackRock’s data shows growth expectation for the US IT sector rising from 31% at the start of the year all the way to 43.4% as of April 9. The broader US market, by comparison, is sitting at mere 18.7%.
Not only are earnings expectations for tech rising, the only other sector that comes remotely close to Tech’s expected earnings growth for 2026 is Energy:
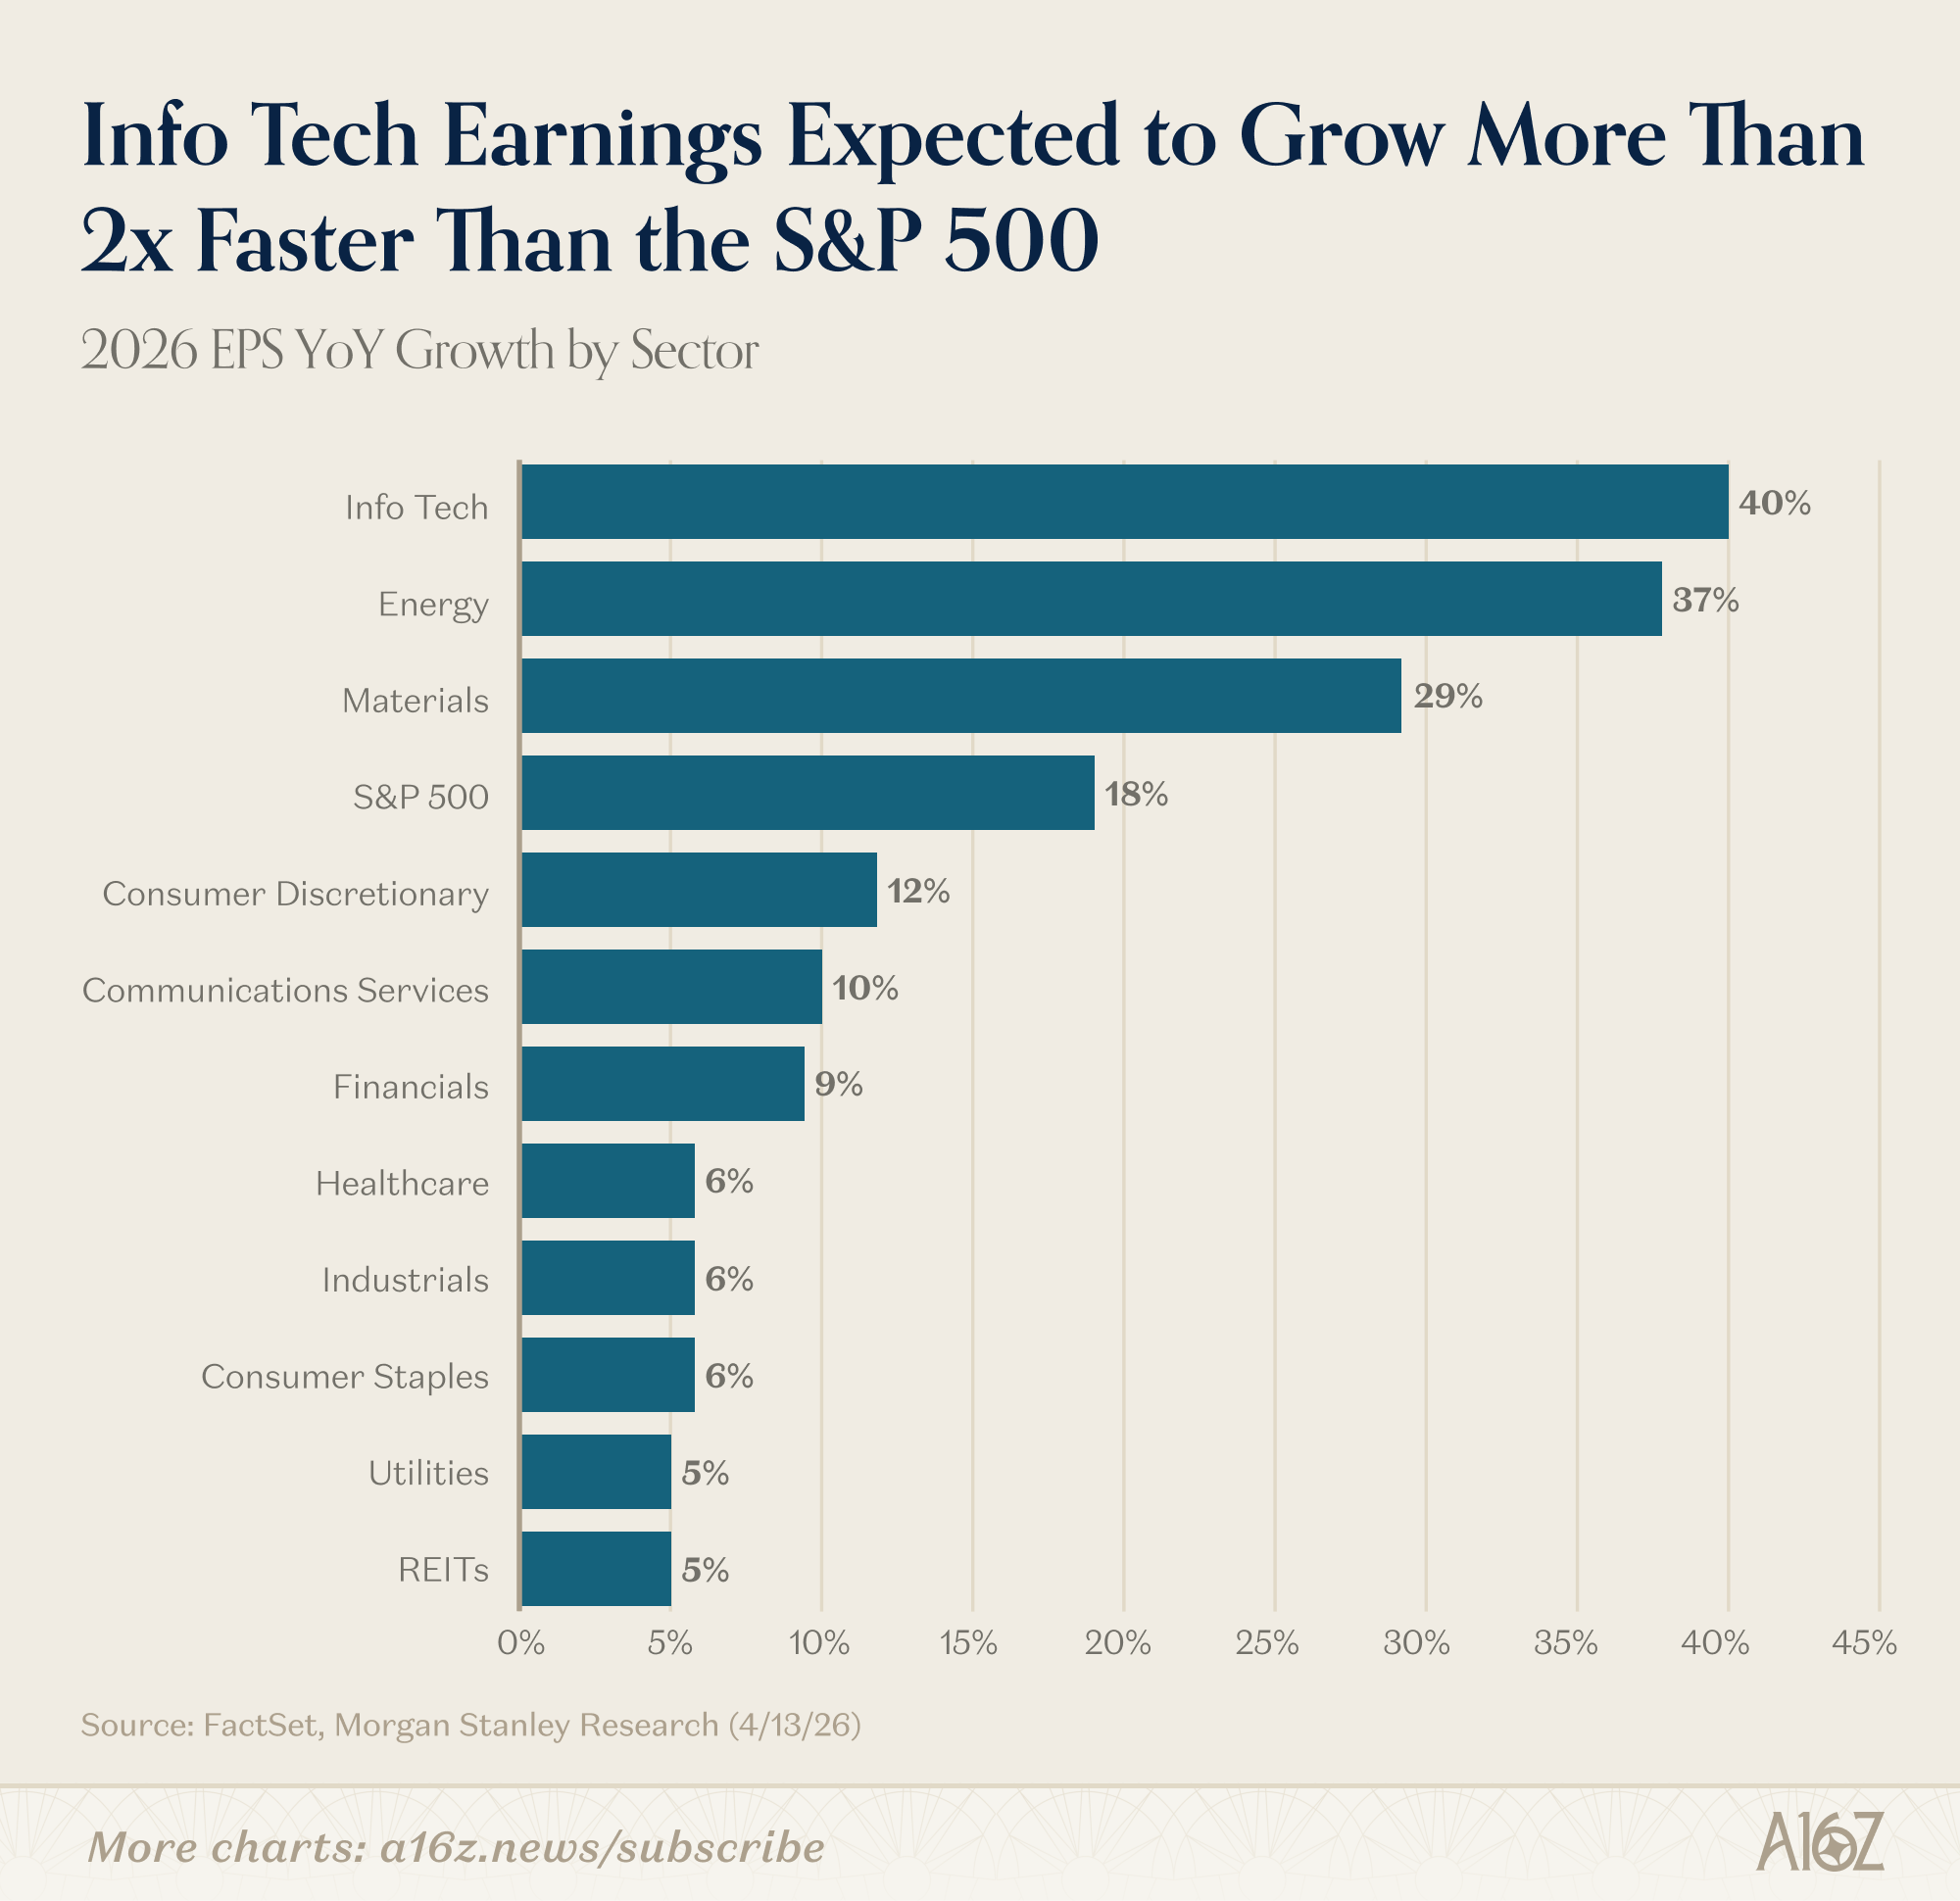
The composite estimate for EPS growth in Info Tech is 40%, more than double the broader index.
This obviously isn’t investment advice, and while Goldman’s view is that Tech is cheap, many others make the argument that it’s not cheap enough. But, it remains the case that it’s a very strange thing to have dramatically rising earnings expectations, while at the same time, dramatically falling premiums for those earnings.
If you were looking for some “skin-in-the-game” conviction that tech is cheap, there is evidence of that too. Tech-insider buying has increased:
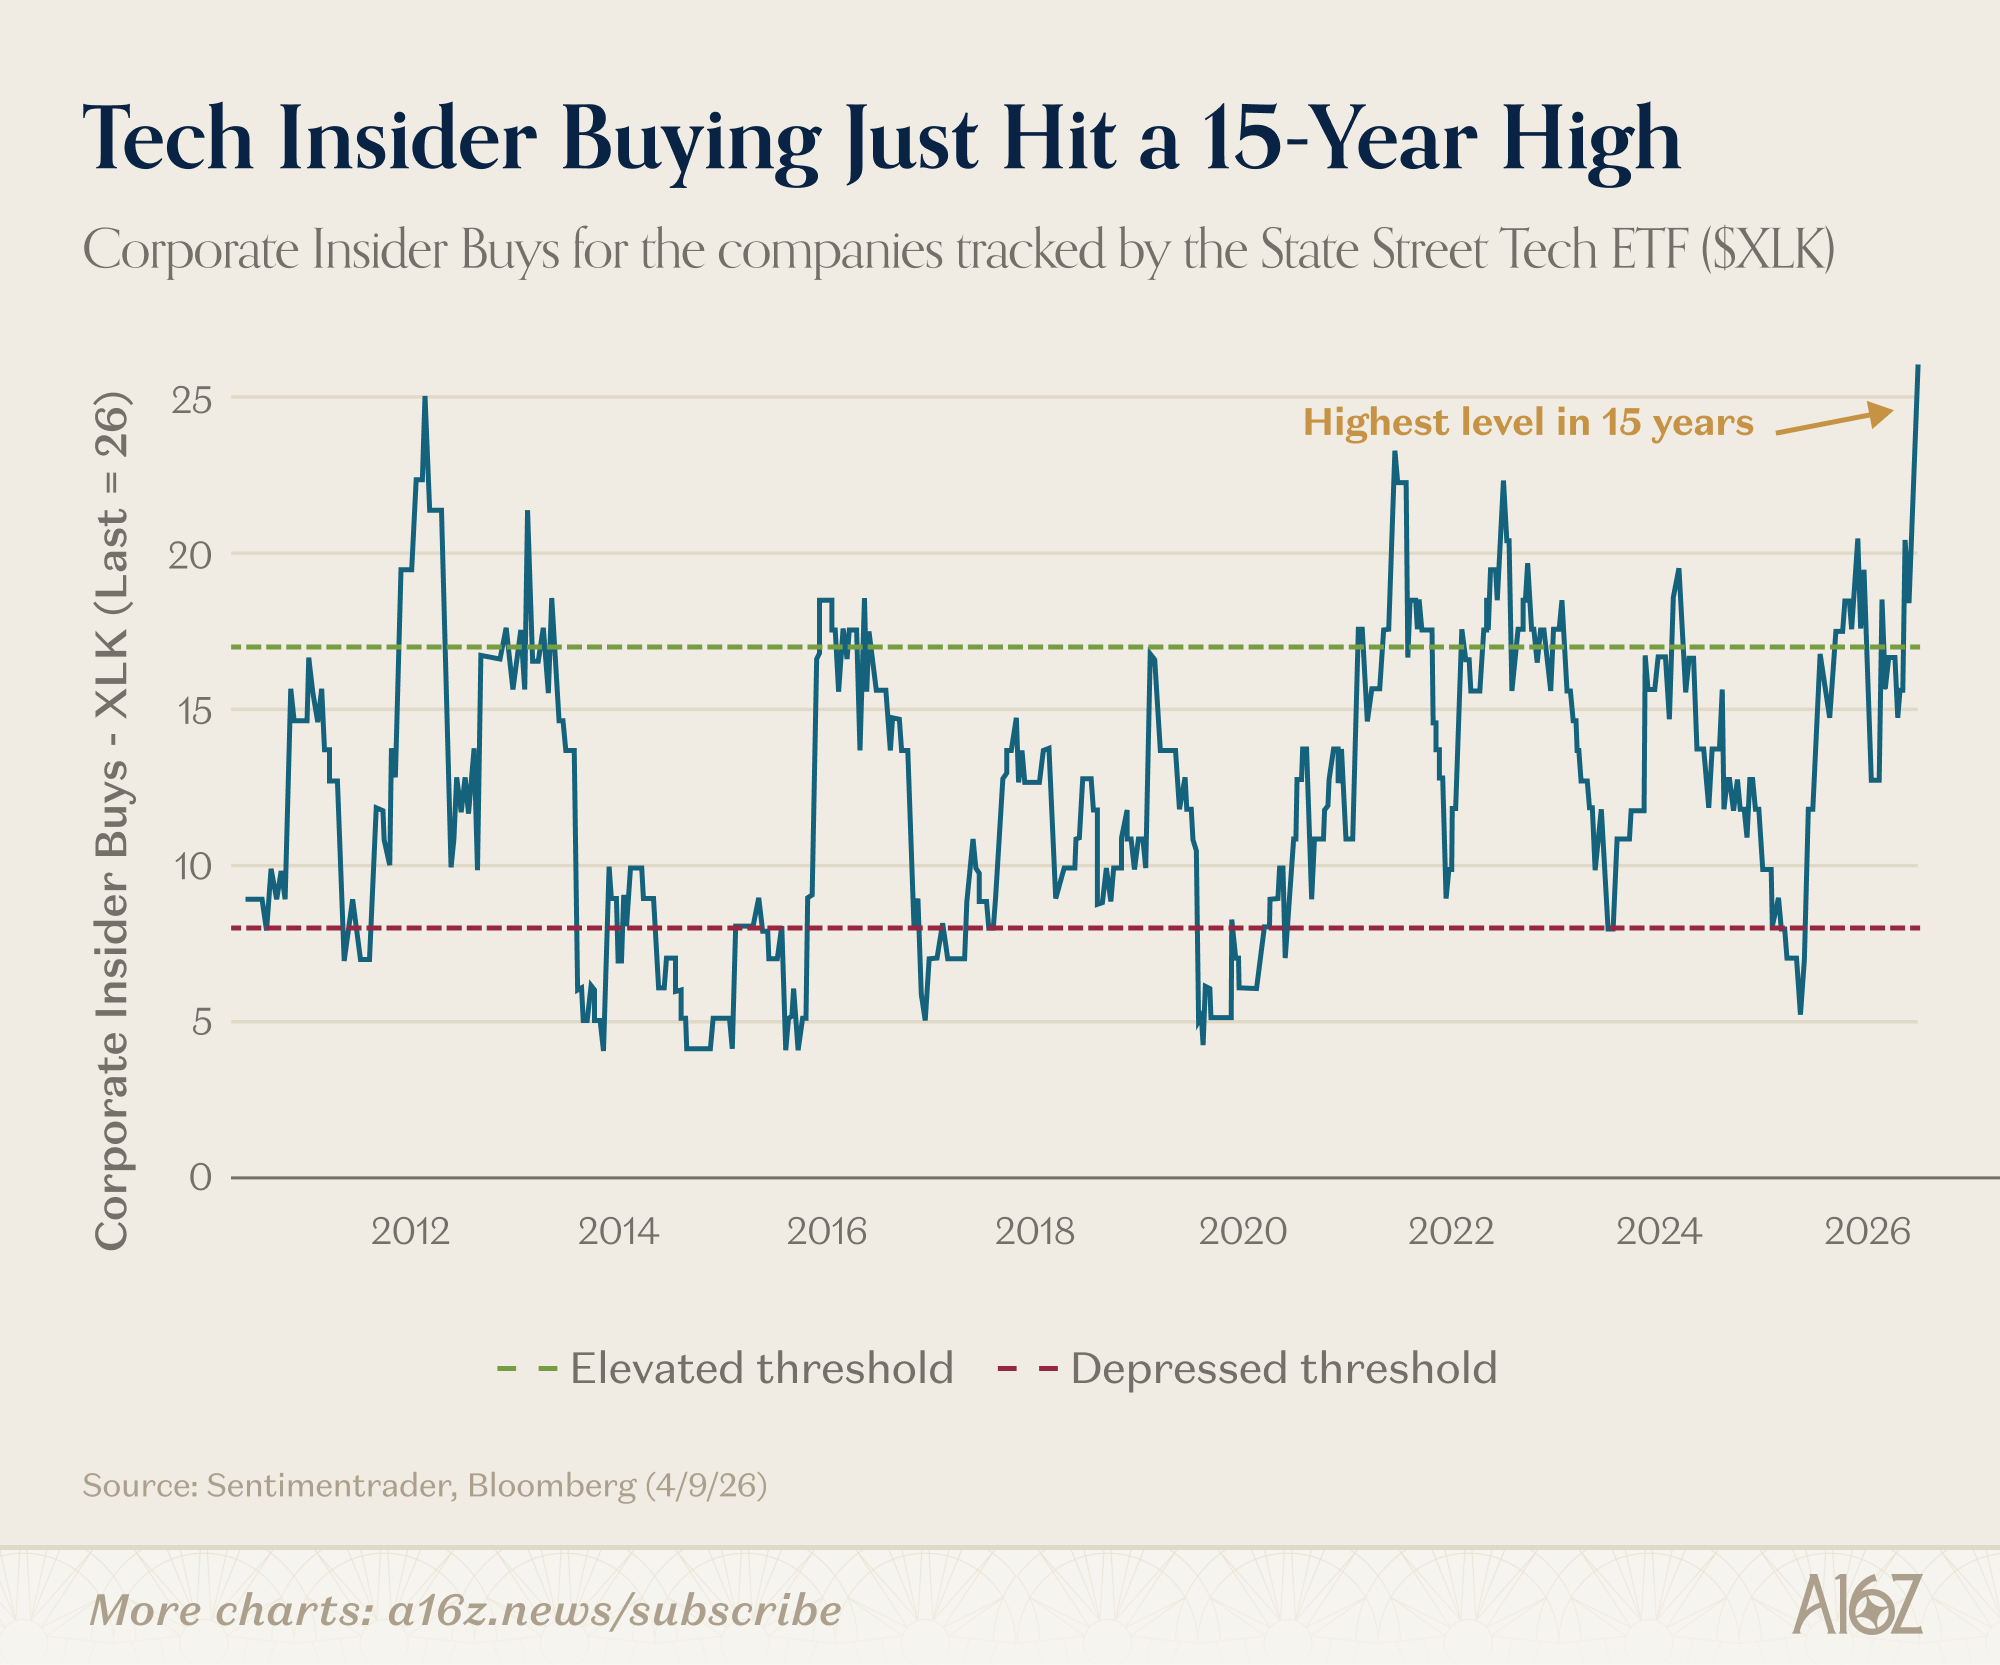
According to one analysis, corporate insider buying for the companies tracked by the State Street Tech ETF ($XLK) reached its highest level in 15 years.
As the saying goes, “there are lots of reasons to sell, but really only one reason to buy,” and if anyone is up-close-and-personal with the terminal value of techcos, it’s their management teams.
Now, to be fair, regardless of how the saying goes, only those insiders actually know whether insider-buying reflects genuine conviction or just a show-of-strength. We’re only here to make the observation that tech insiders appear to be putting their money where their mouths are.


AI Favors the Activists (the other kind)
Kekst CNC (a corporate comms firm) ran an interesting AI experiment on the big money conflict between corporate management and shareholder activists.
They asked four frontier AI models to weigh-in on ~50 recent proxy fights, and compared the AI recommendations to the advice of the two leading proxy advisories (ISS and Glass Lewis), and actual outcomes:
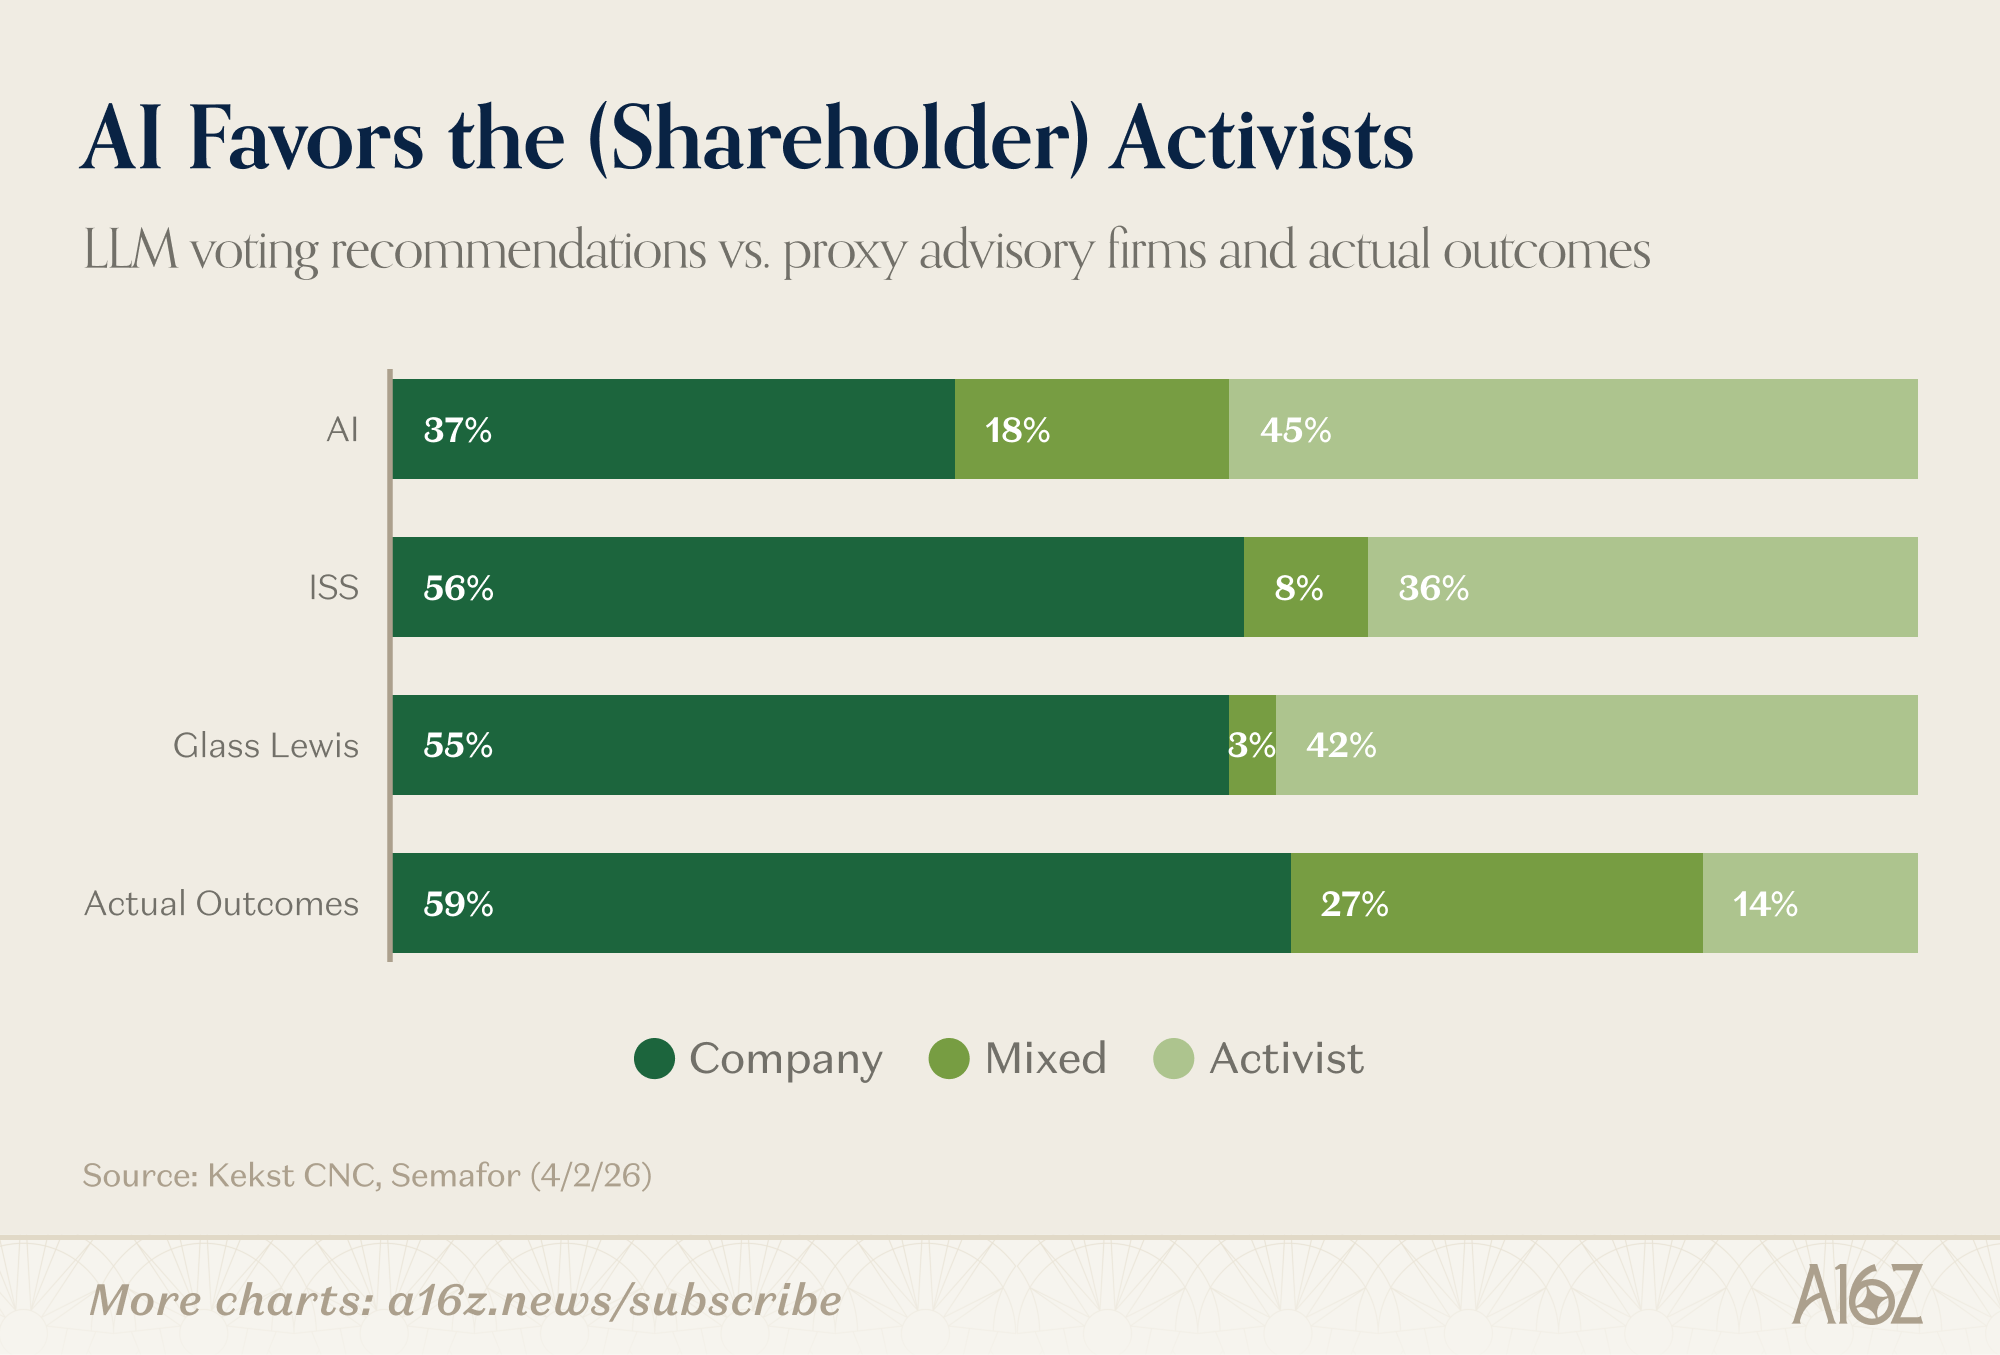
AI favored the activists ~45% of the time (compared with 36% and 42%, respectively), and favored the Company only 37% of the time, while the big two advisers took the Company’s side more than half of the time.
It turns out that Skynet is long Elliott Management.
That’s interesting so far as it goes, but here’s the more interesting part: it’s true that AI is somewhat more supportive of activists than the advisers are, and far less supportive of management . . . but, both advisers and AI are way more pro-activist than the shareholders themselves.
Actual shareholder votes go the companies’ way 59% of the time, and only favor activists a bare 14% (or about 1/3rd of what LLMs or Advisers would recommend).
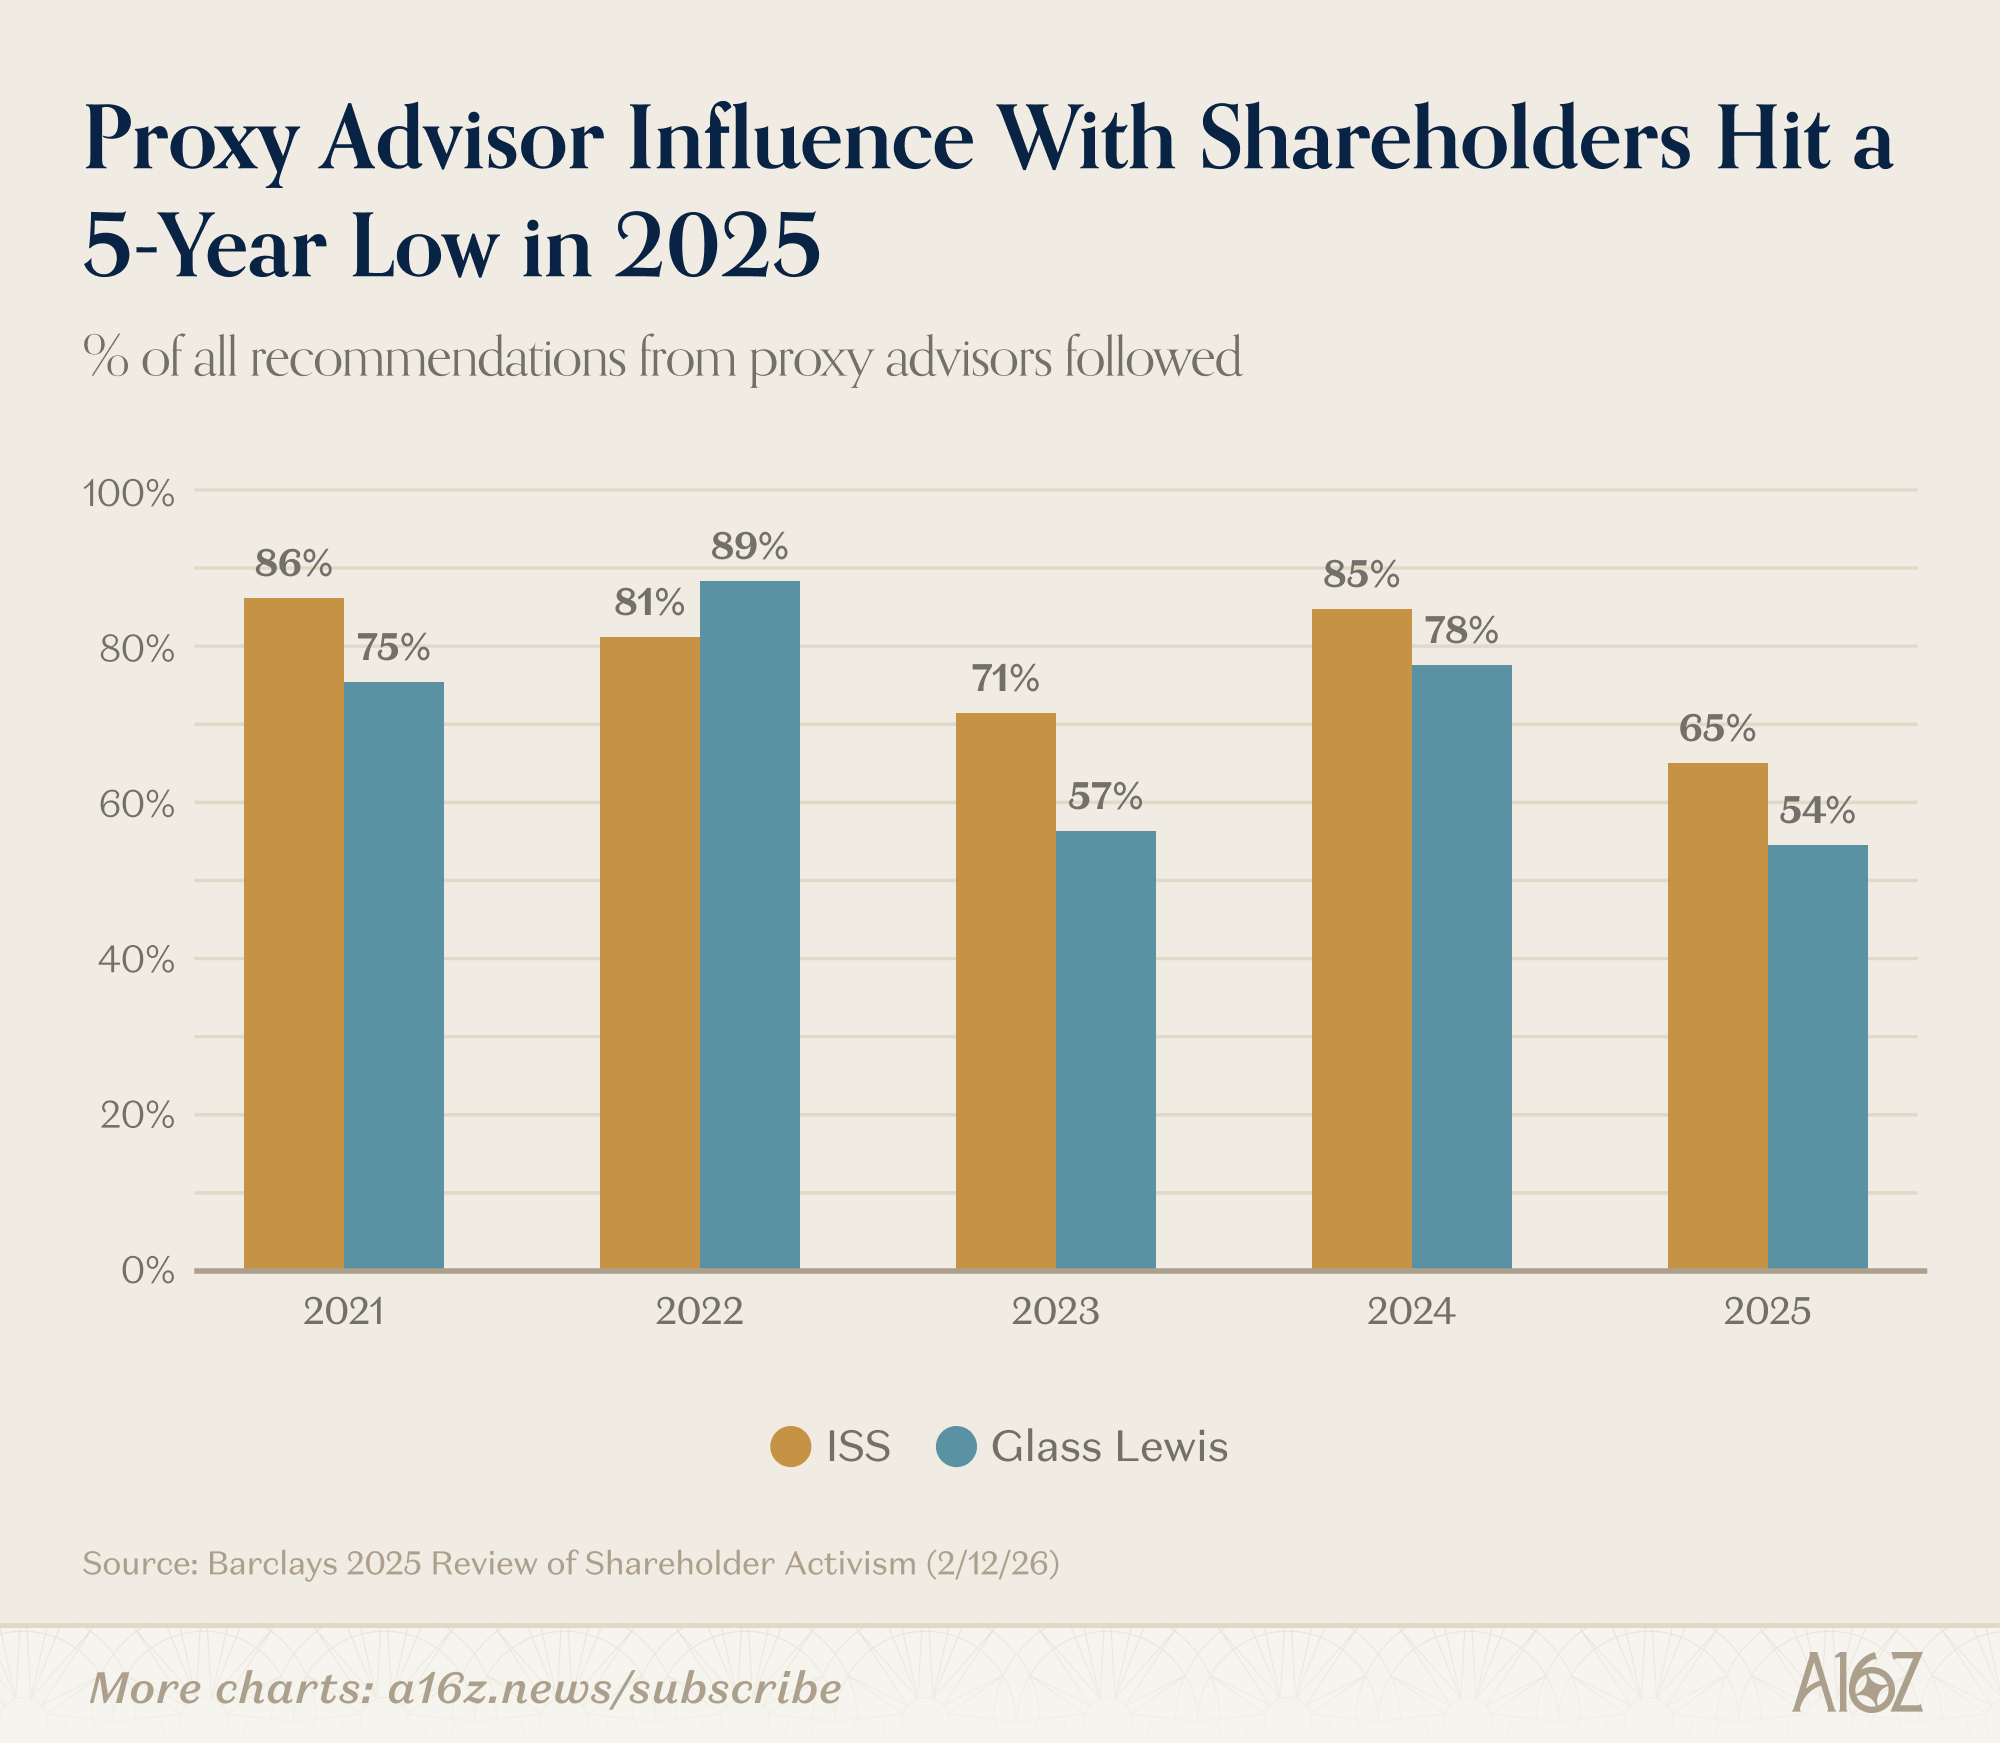
In fact, even as advisers have become more pro-activist recently, the only real impact is that their recommendations are “followed” less-and-less (to the extent that anyone was paying attention to them, at all).
As Barclays put it in a 2025 review of shareholder activism, “ISS and Glass Lewis were significantly more likely to back dissident nominees in 2025 but their support was relatively less meaningful in determining outcomes.”
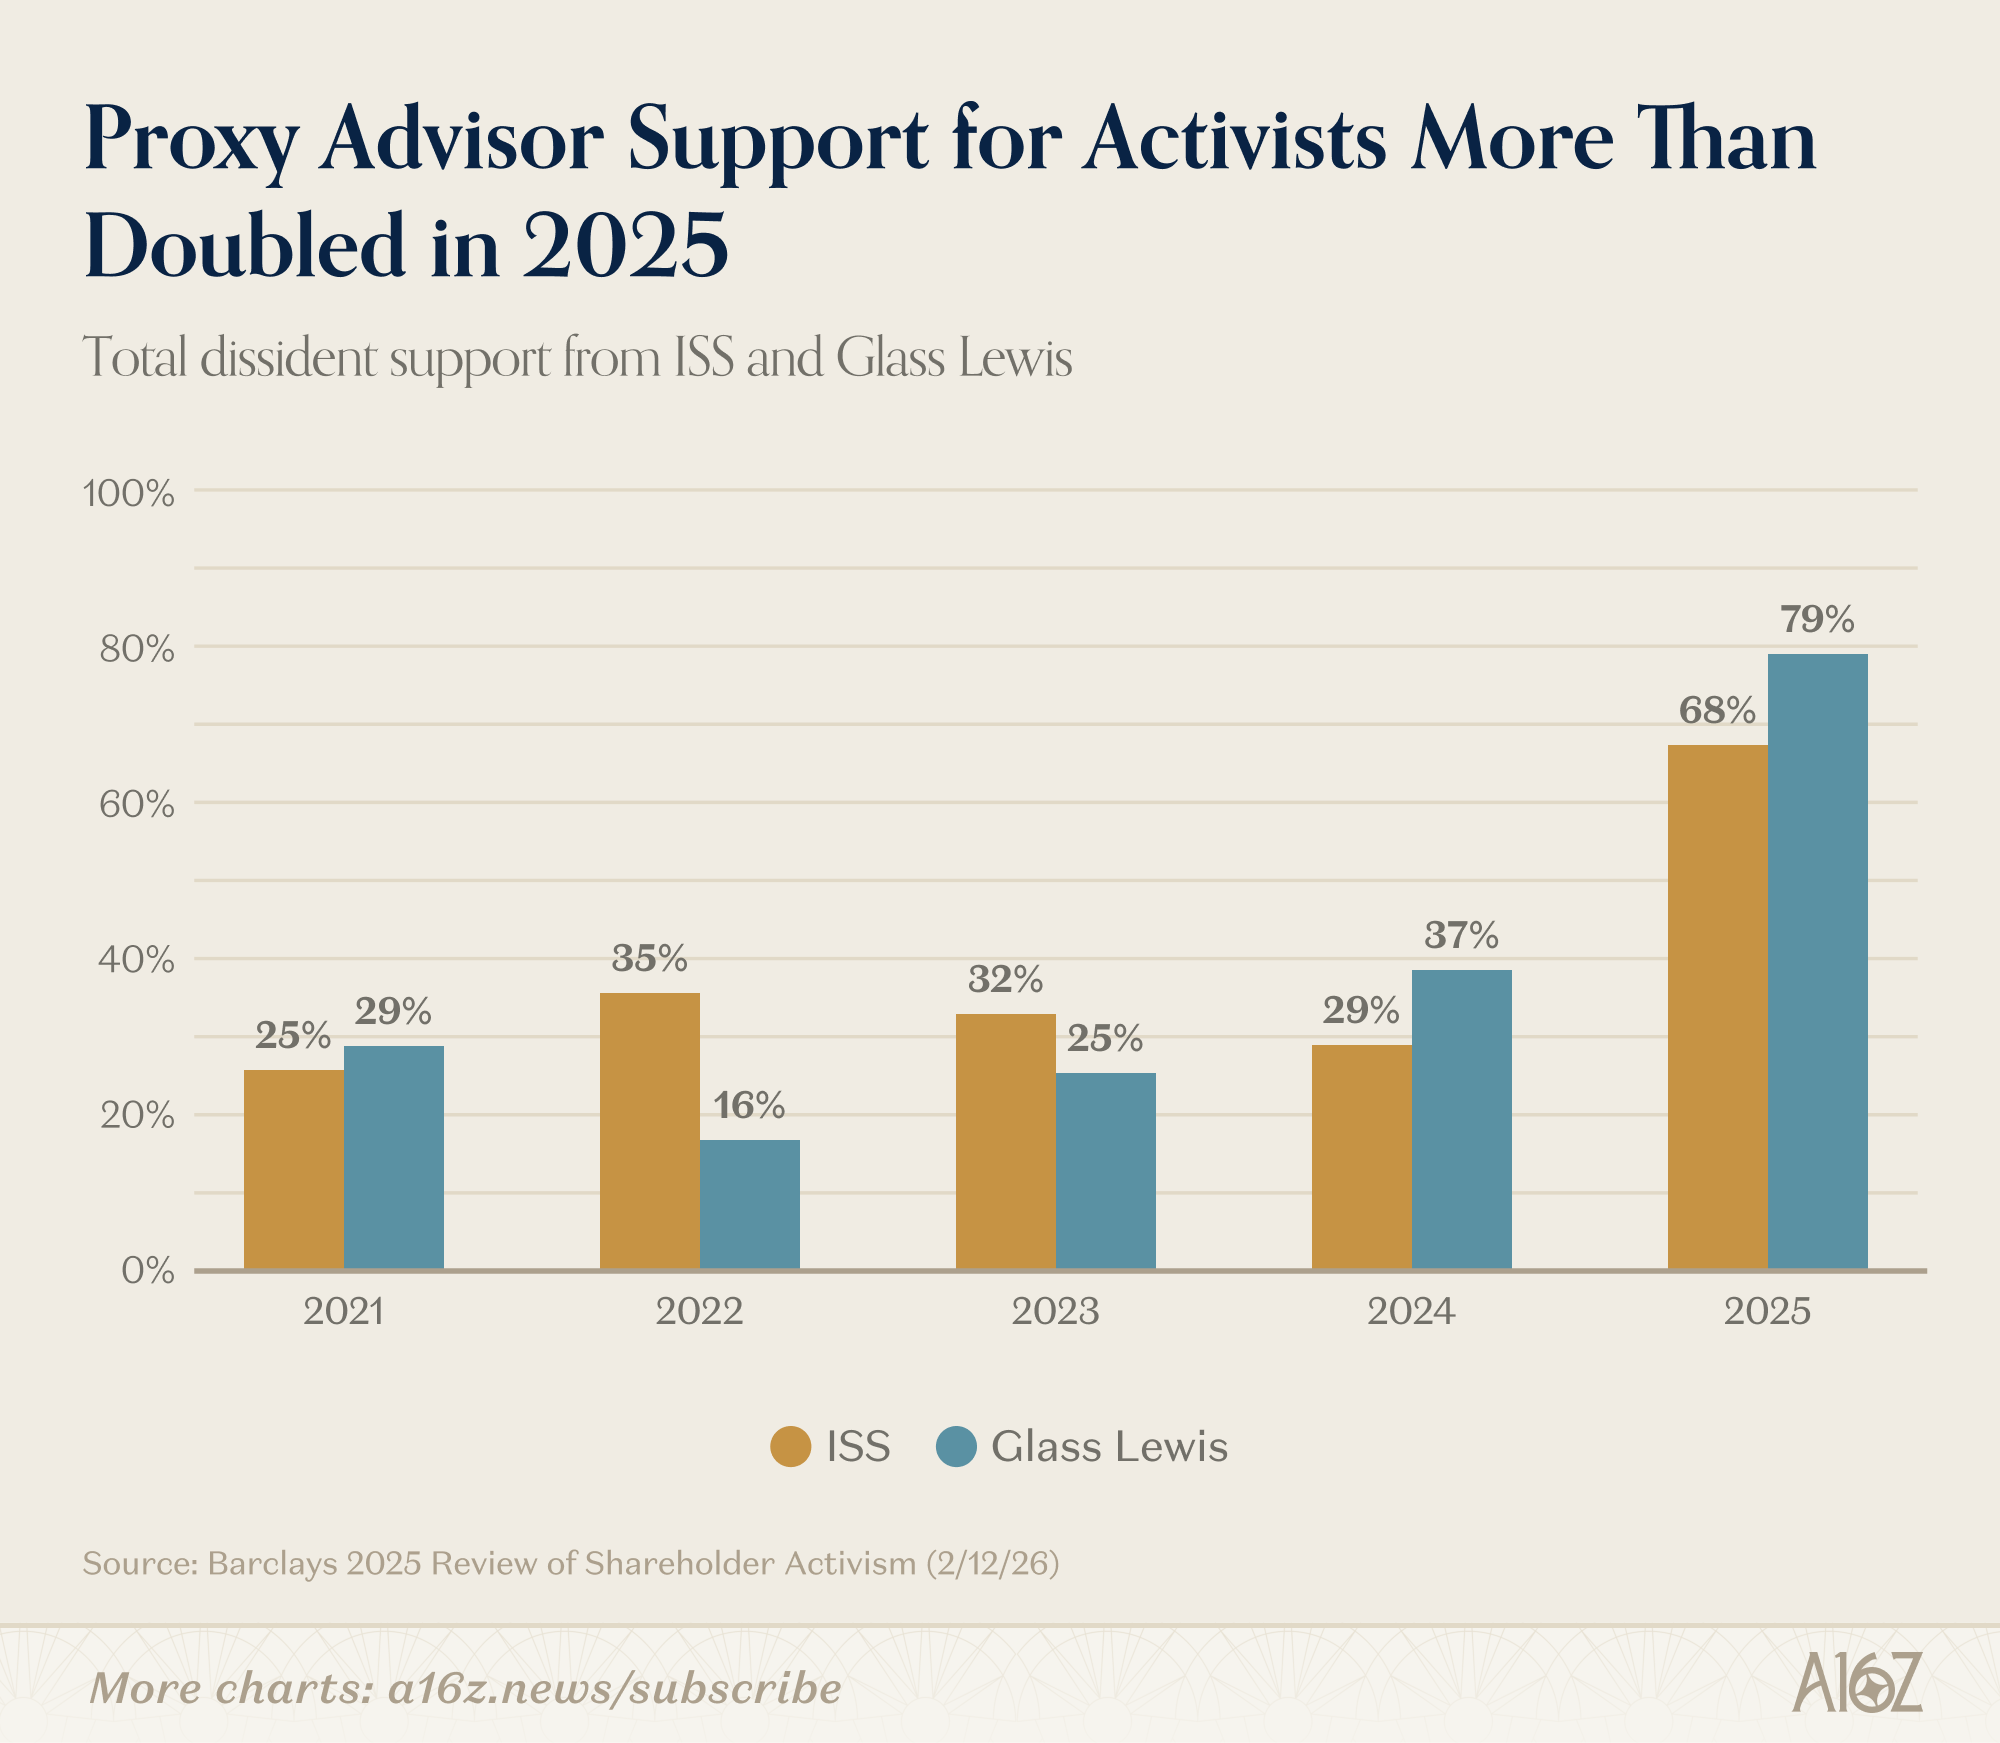
Advisers increased their “dissident” support by ~2.5X, and their success rate dropped by about a third.
Which raises a reasonable question: why do investors seem to vote pro-management, regardless of what the proxy advisors have to say, one way or another?
A good chunk of the answer is here, i.e. when we say “investors,” who are we referring to?
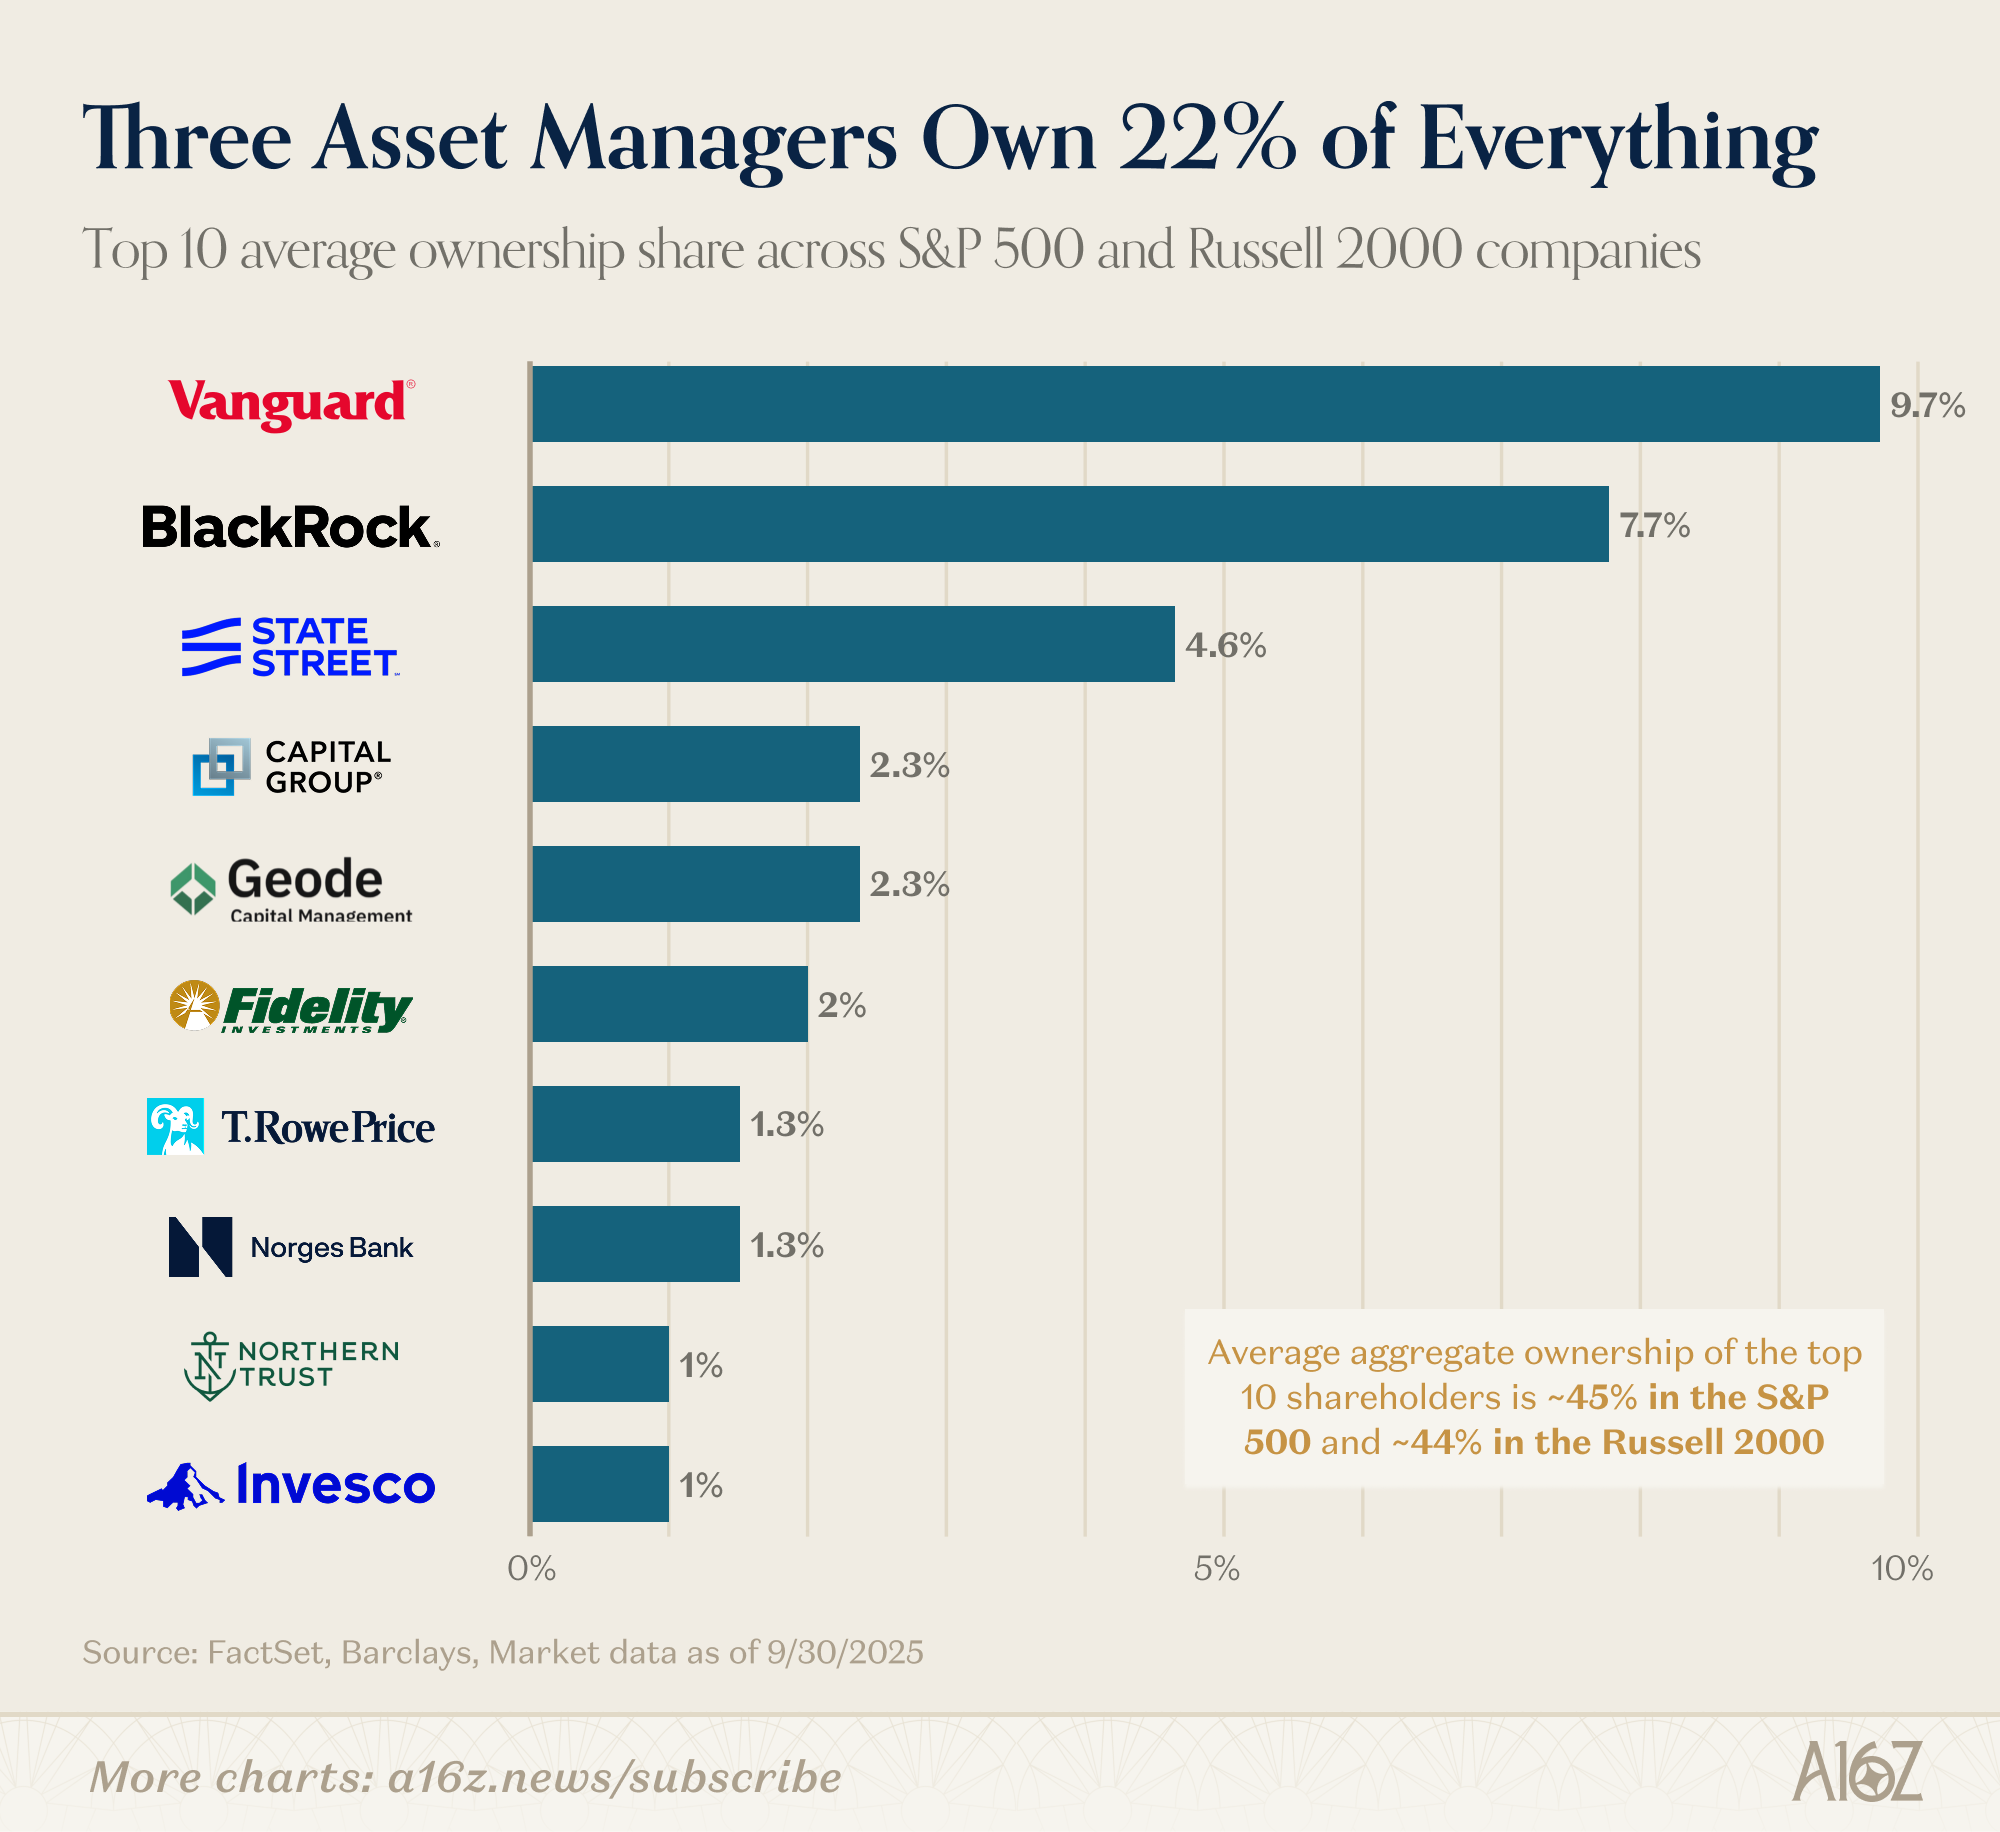
BlackRock, Vanguard, and State Street (the “Big Three”) together own ~22% of the average S&P 500 company, and the top 10 shareholders own ~45%. These firms have large stewardship teams and their own in-house voting policies.
When ISS recommends for an activist, and the vote goes for management, it’s often because the Big Three voted with management despite the recommendation. To answer the question, “why do investors ignore the advisers?” it’s because there are relatively few investors who actually matter, and they’ve got their own advisers.
So, will AI-driven proxy recommendations move the needle, then?
Earlier this year, JPMorgan Asset Management cut ties with ISS and Glass Lewis and rolled out an in-house AI platform, Proxy IQ, to handle voting across 3,000+ shareholder meetings. This wasn’t a quiet operational decision – Jamie Dimon has spent the last year publicly calling the two advisory firms “incompetent” and saying they “should be gone and dead.” Glass Lewis, separately, announced it will retire its uniform house recommendations in 2027.
Of course, that’s JPMAM, and that doesn’t mean the Big Three are about to follow suit.
But, in all events, the equilibrium that kept management largely safe from activists (regardless of what the shareholder proxies recommended) looks less stable than it used to.
Meanwhile, 2025 set a record for activist campaign activity:
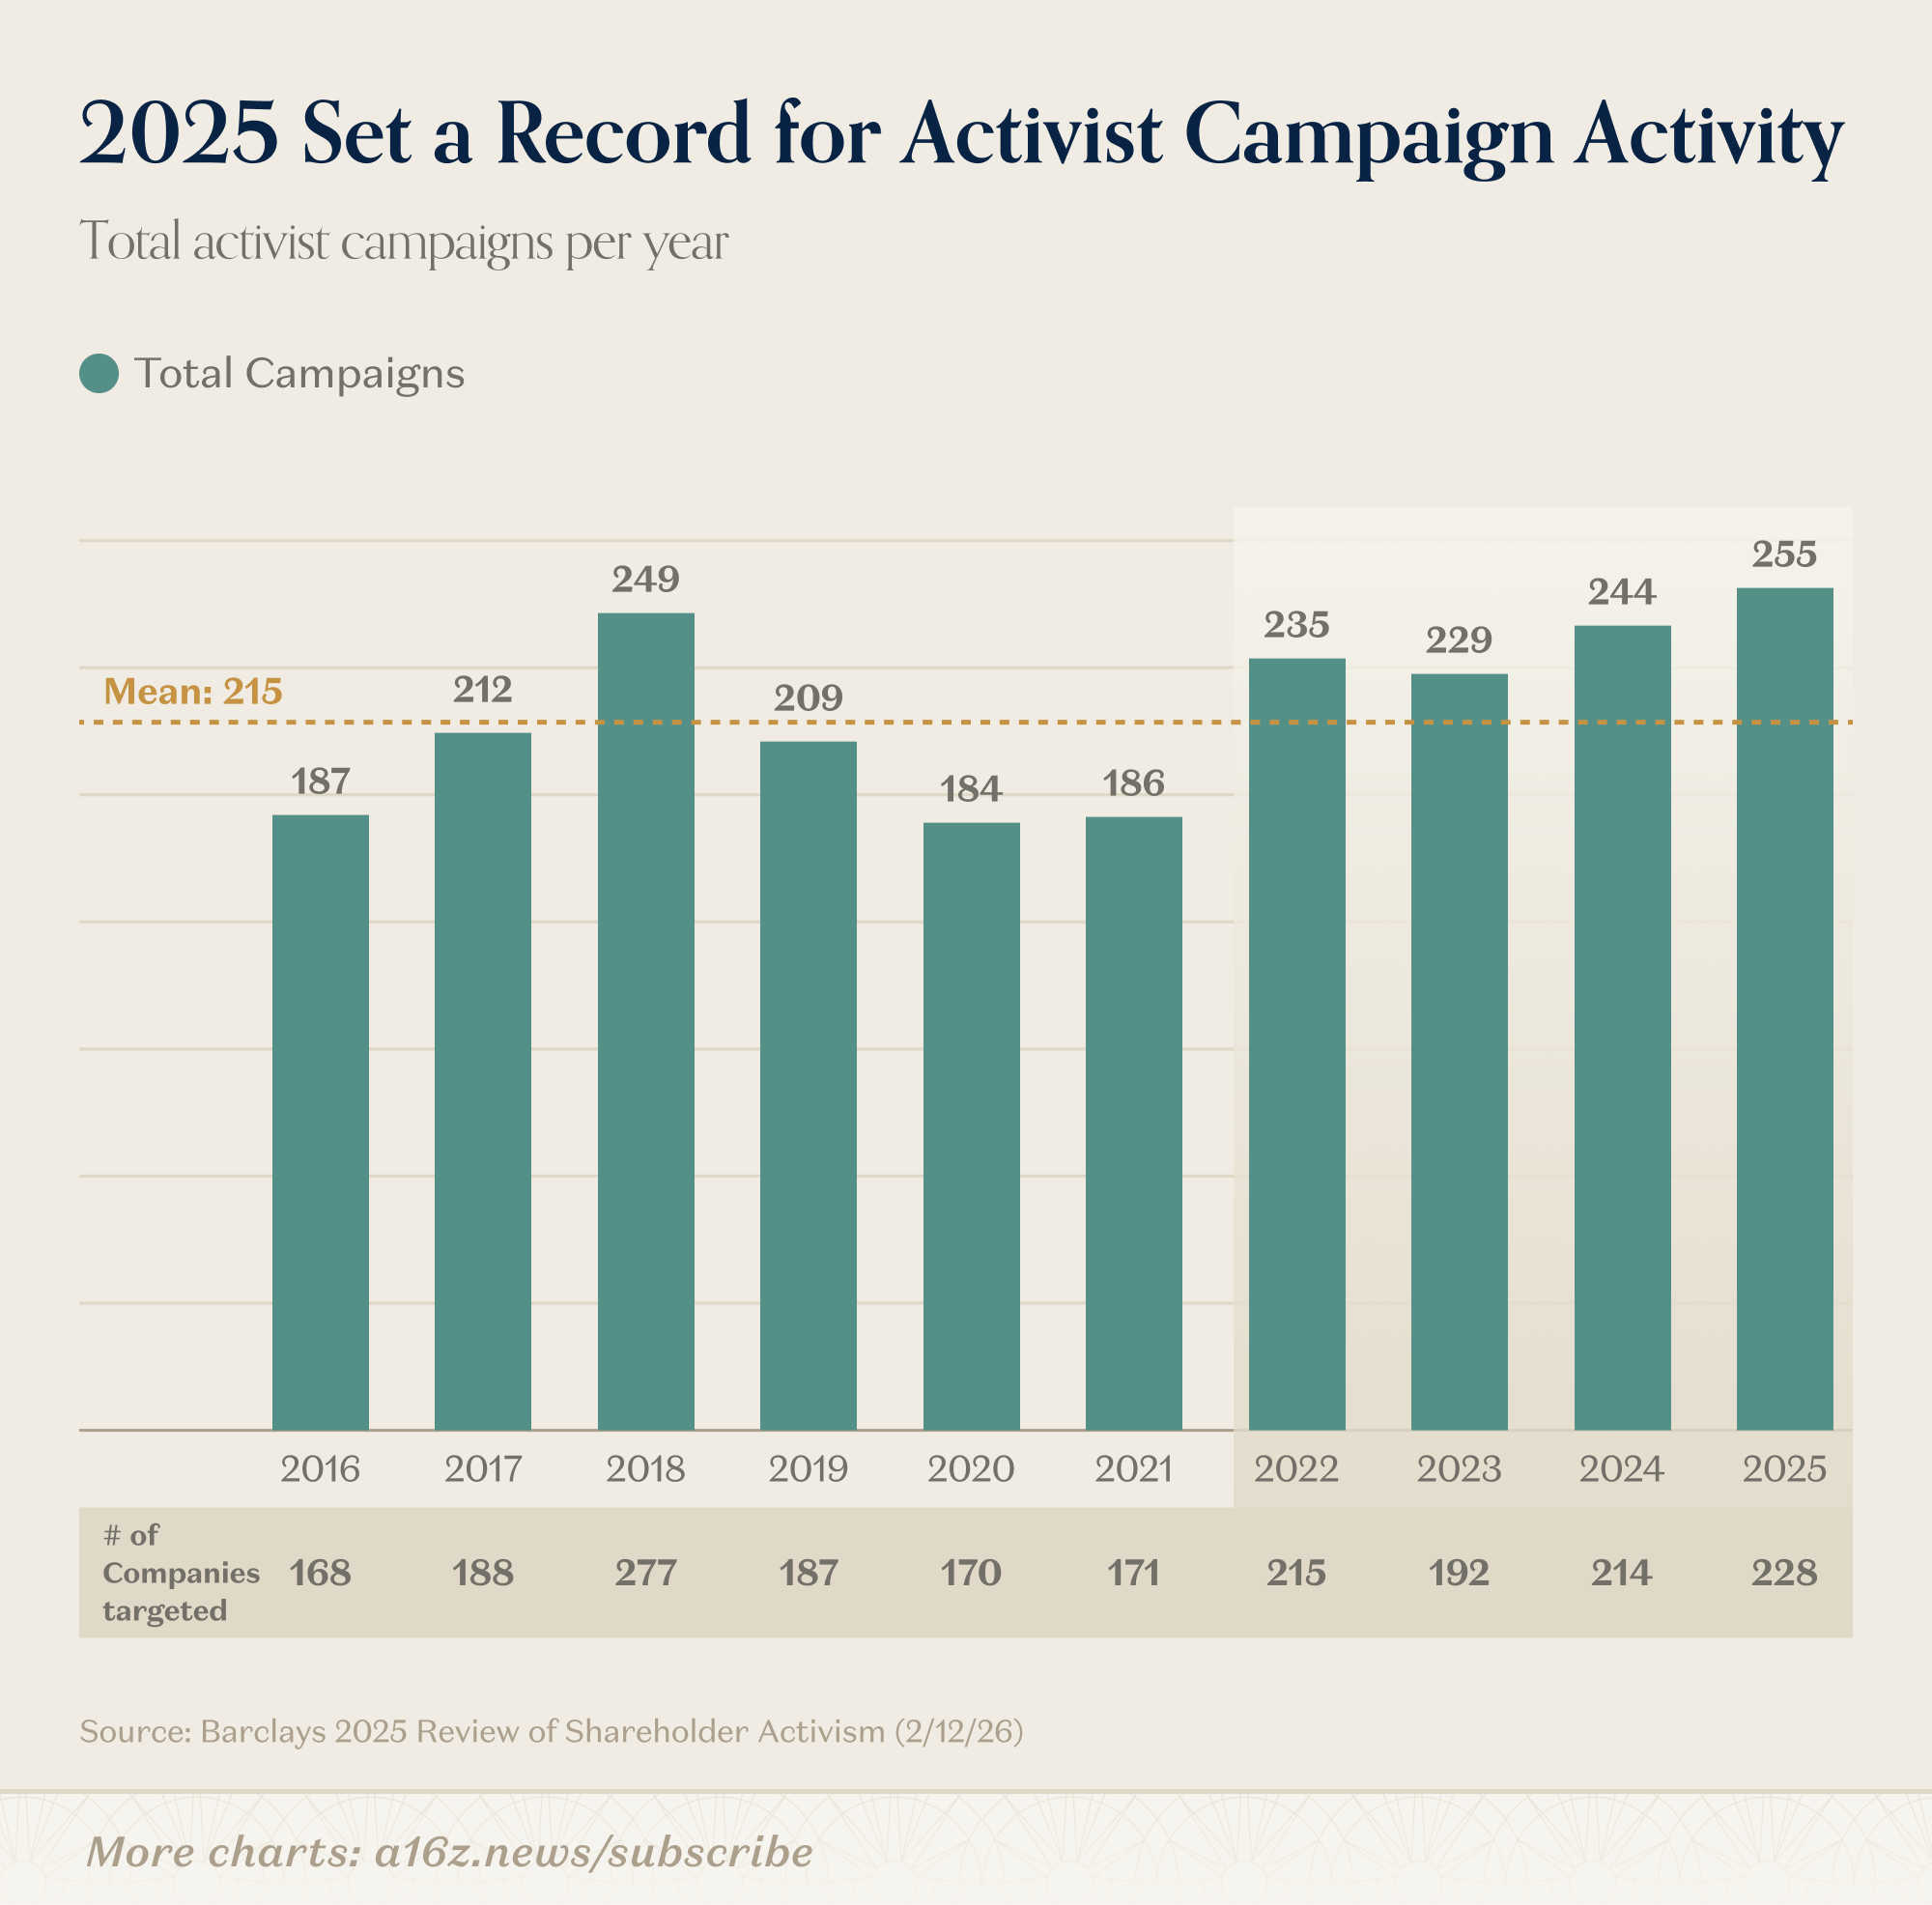
Activists are on the march, and they’ve got the LLMs (and, recently, the advisers) on their side.
Boardrooms may start to get a bit spicier for the foreseeable future.
Quantifiable AI Benefits Rising
It’s easy to measure all the money being spent on AI, but it’s not nearly as easy to measure the impact.
There is plenty of survey data, which is squishy by nature, including this survey from Morgan Stanley, which asks for “quantifiable” AI impacts, which is still squishy, but at least somewhat less so.
In any event, survey says that quantifiable AI benefits are indeed rising:
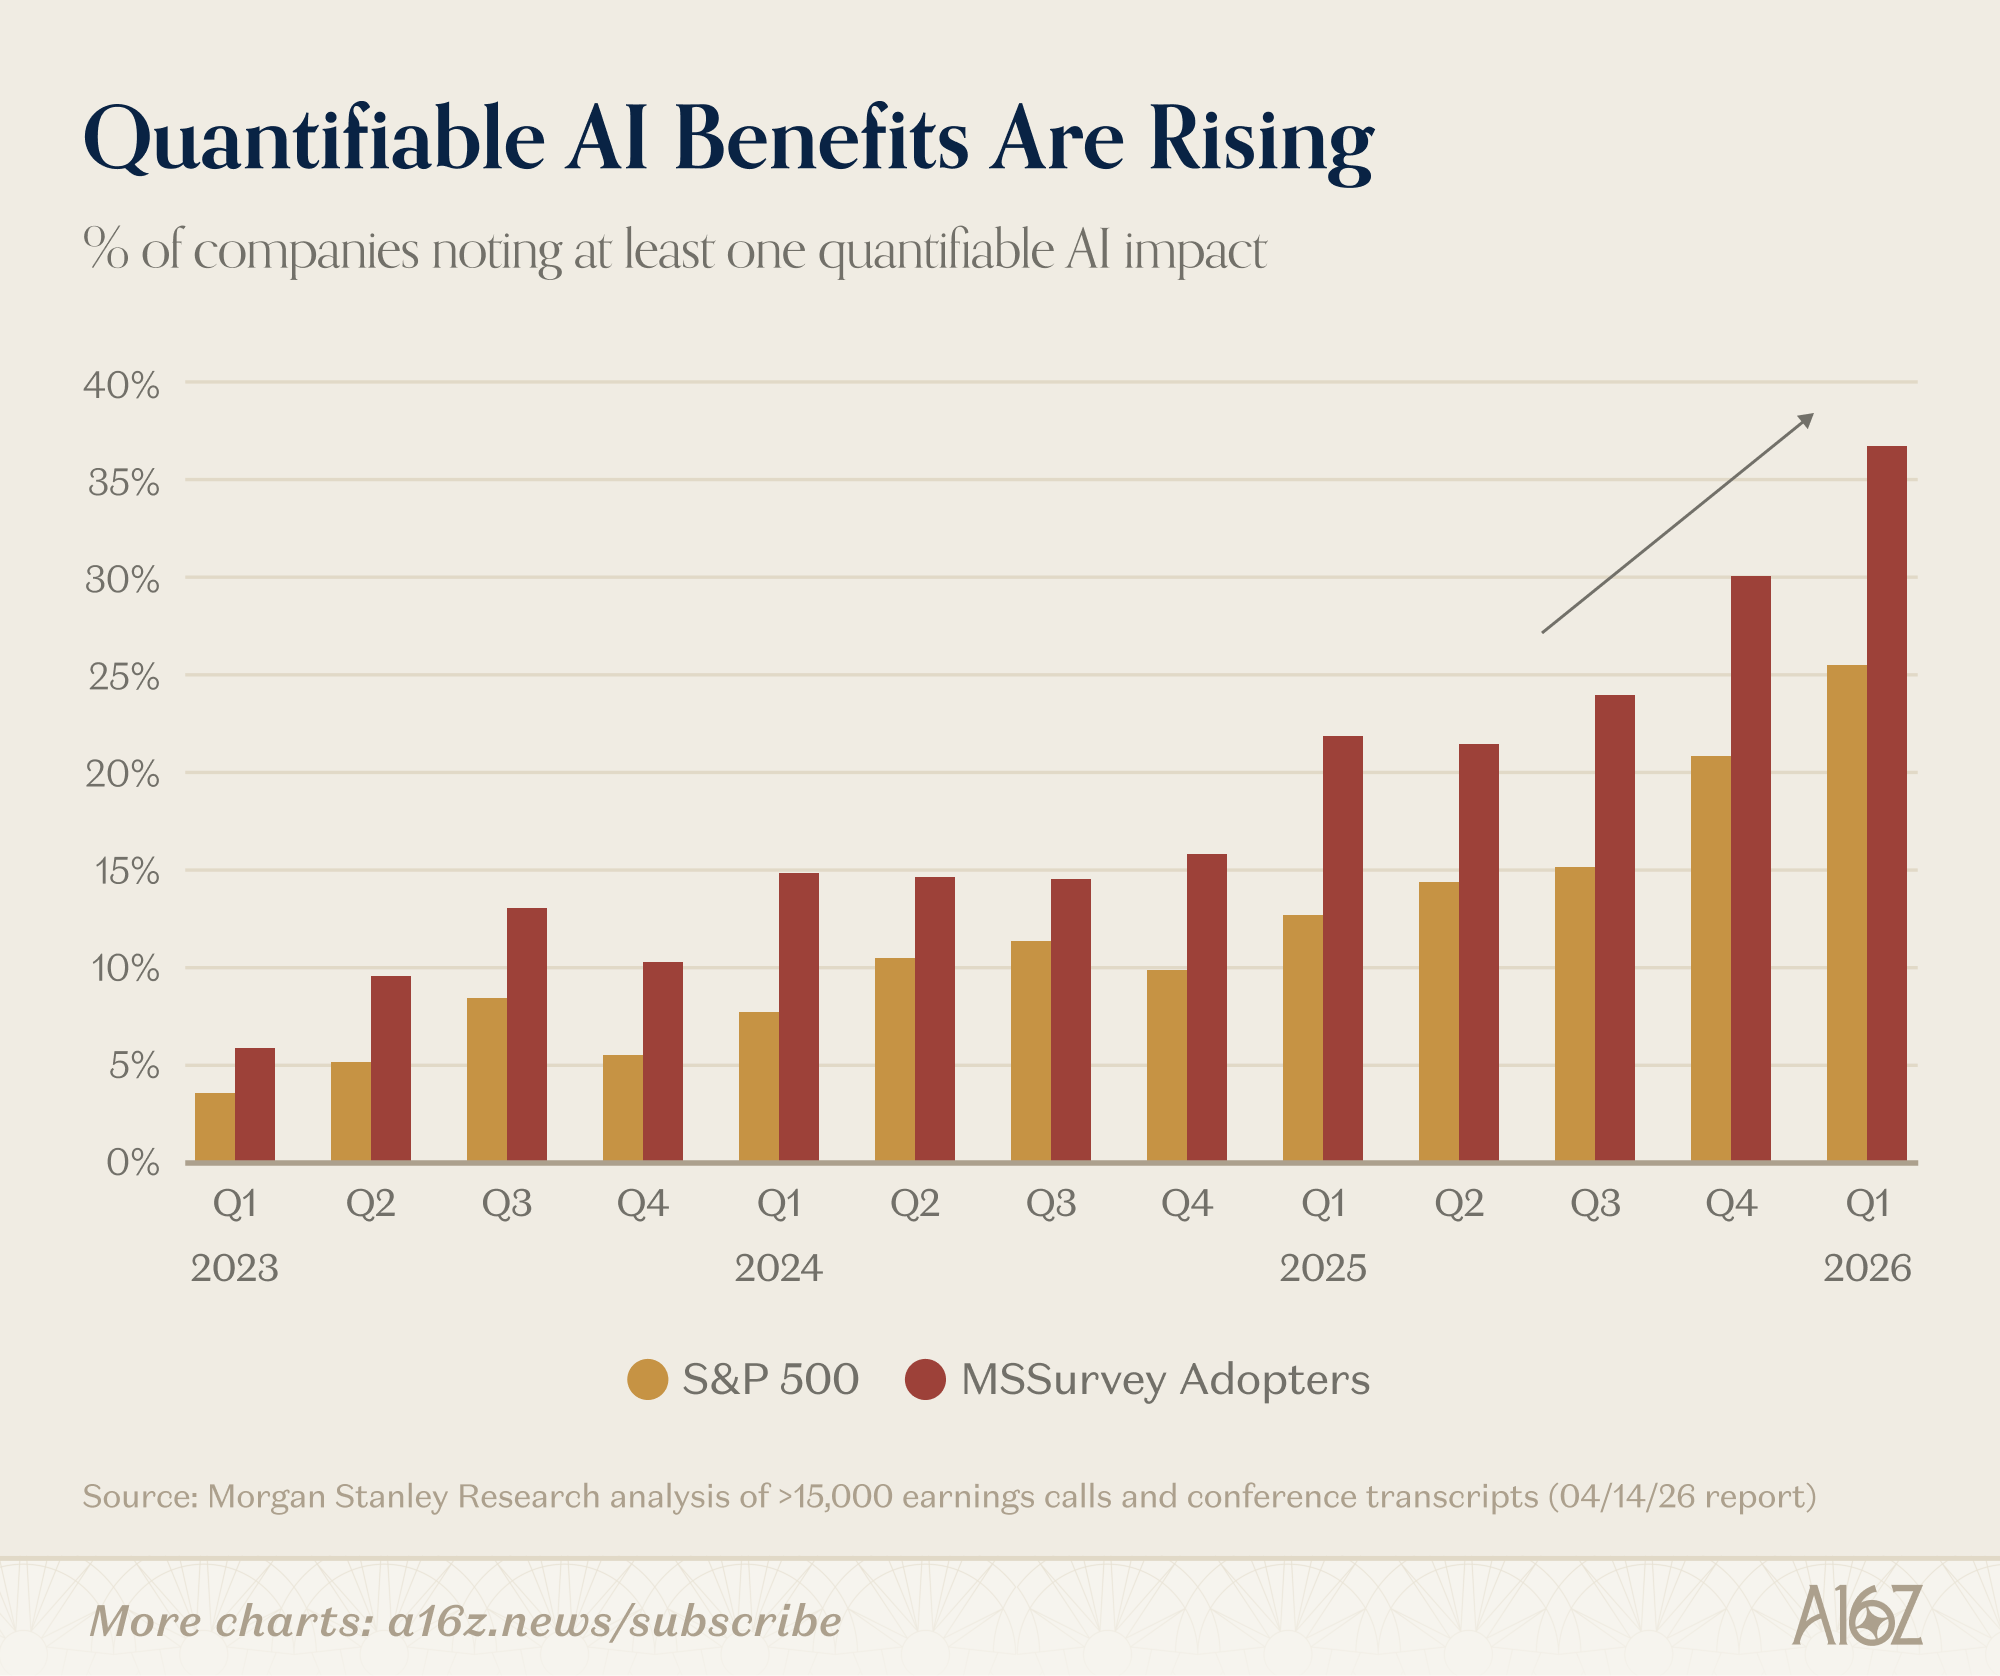
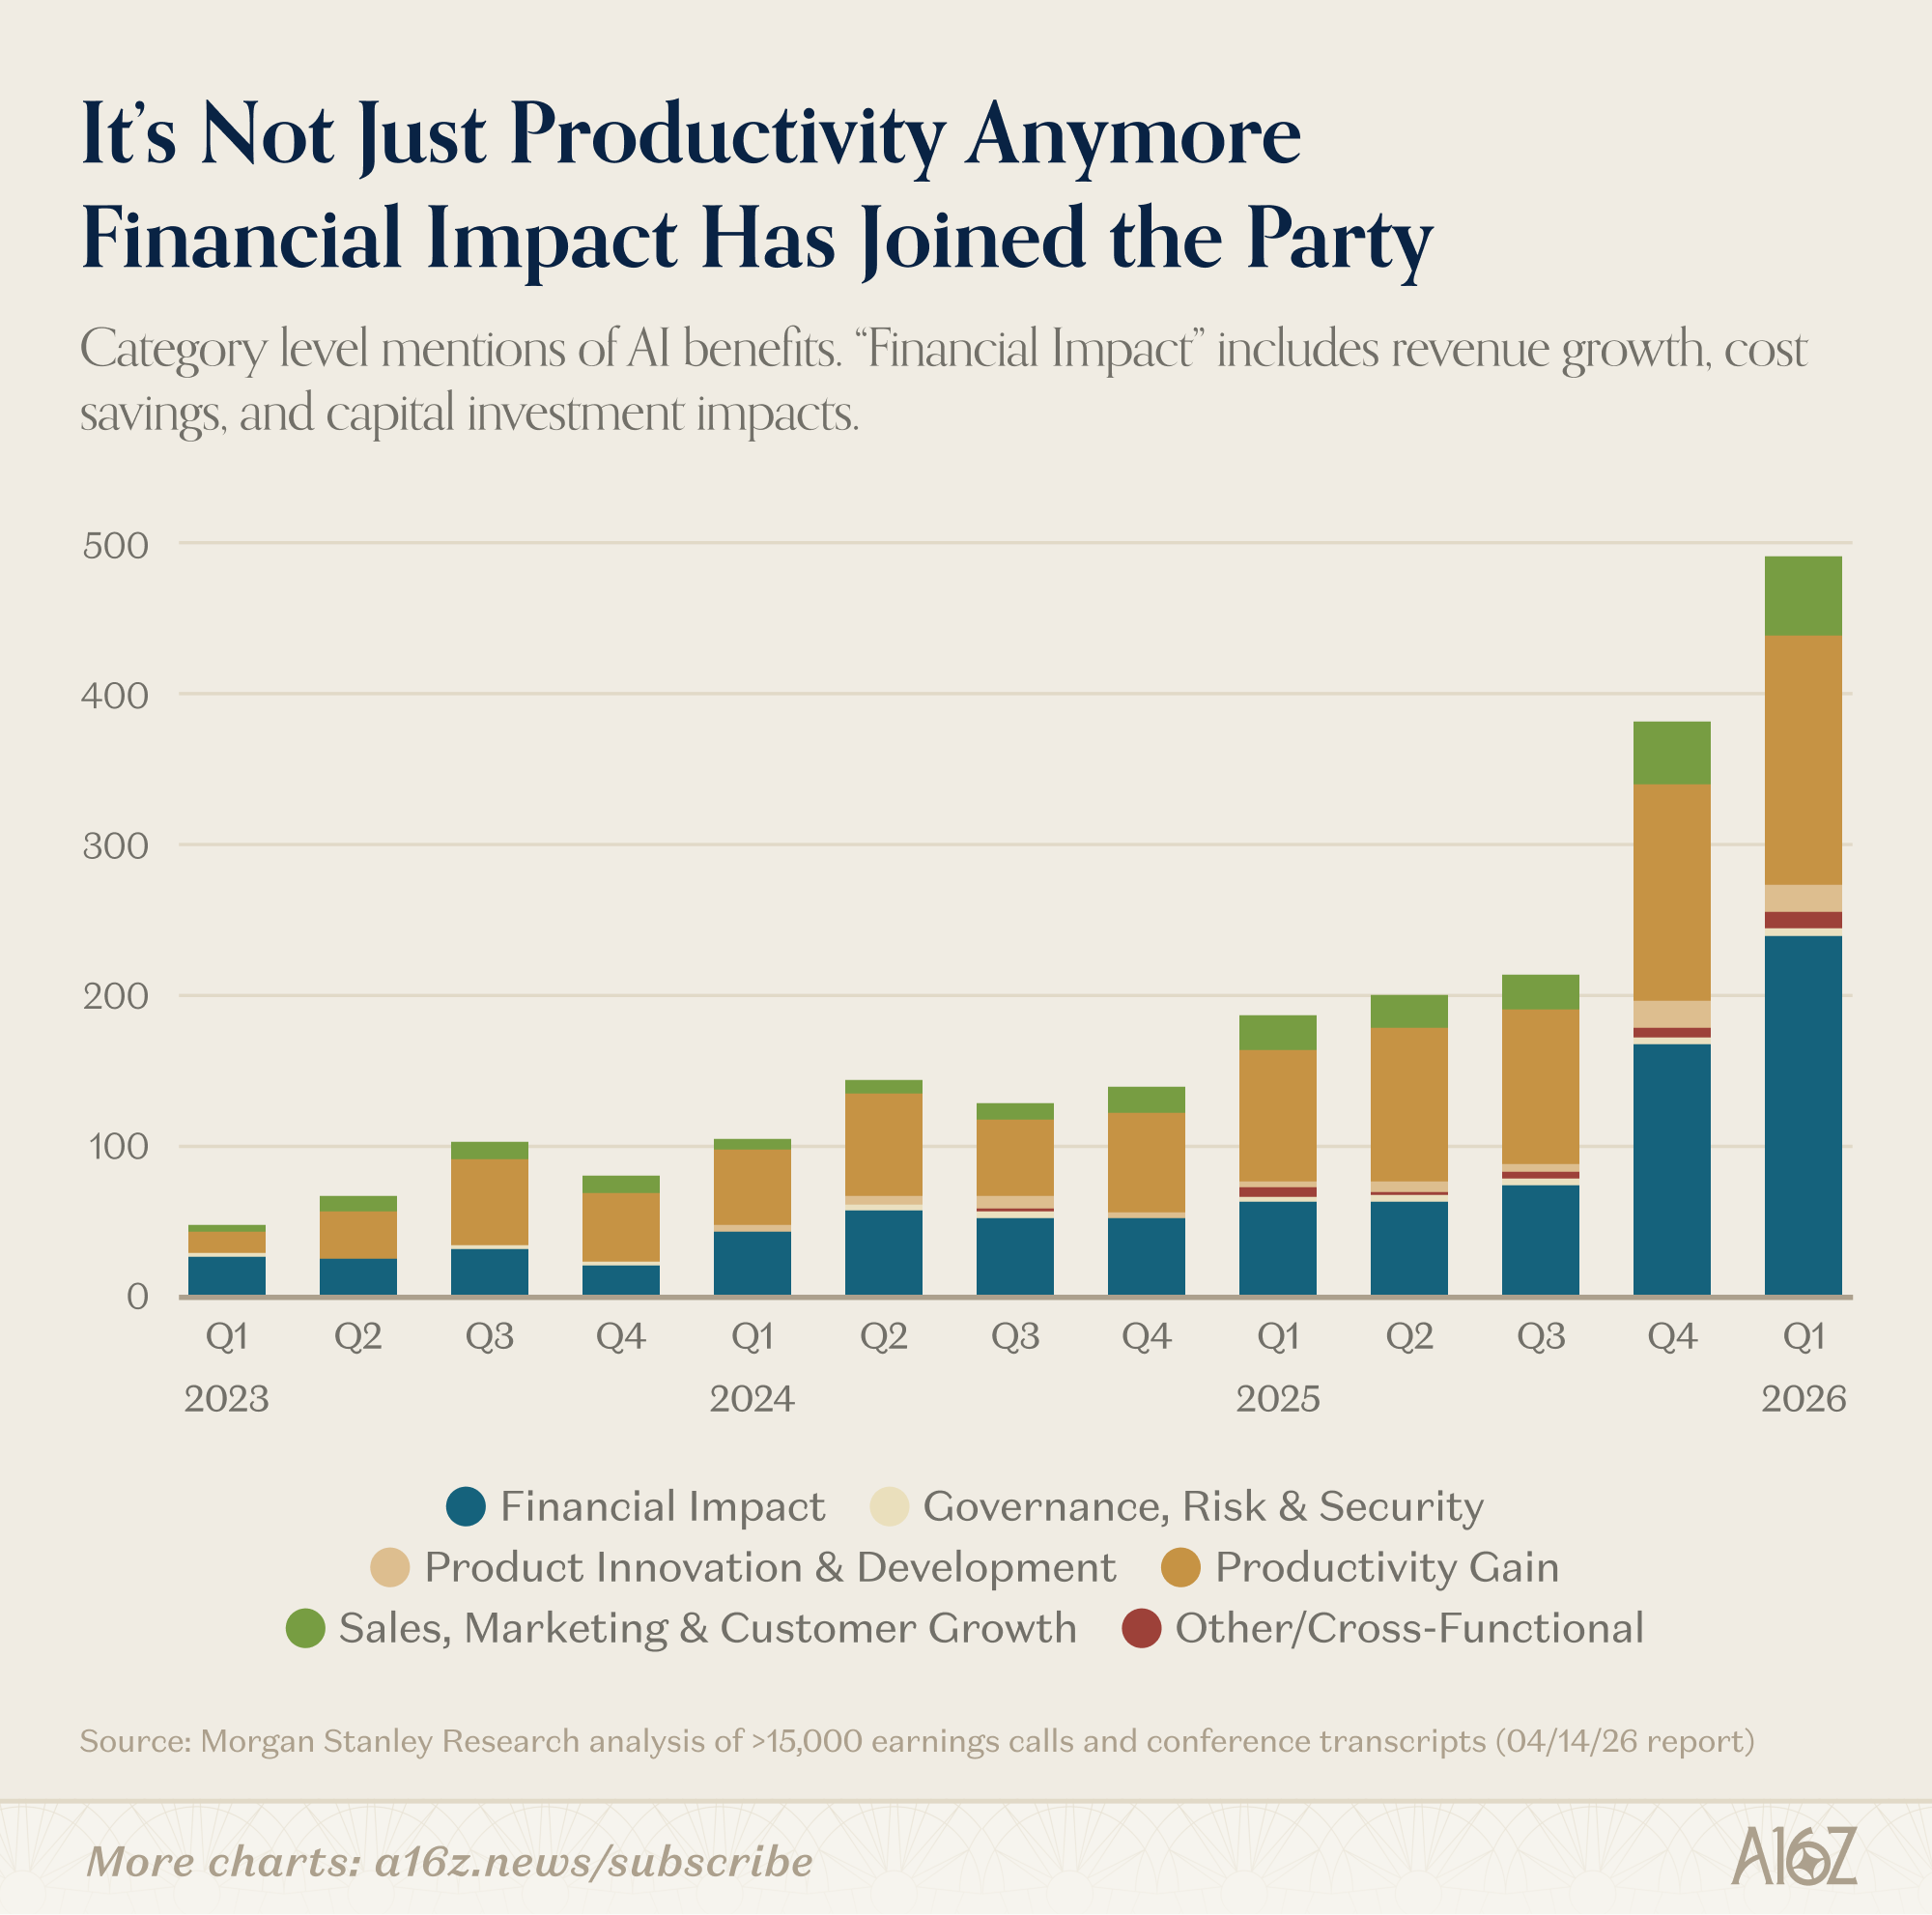
~37% of respondents reported quantifiable AI benefits (a ~23% increase from last quarter), with both “productivity gains,” and perhaps more importantly, “financial impact,” leading the way.
With all the money being spent on AI, one would expect that, sooner or later, management will require some quantifiable financial ROI, and it appears that ROI is increasingly in the offing.
In terms of who picked up the pace on realizing quantifiable AI benefits, there’s data on that too:
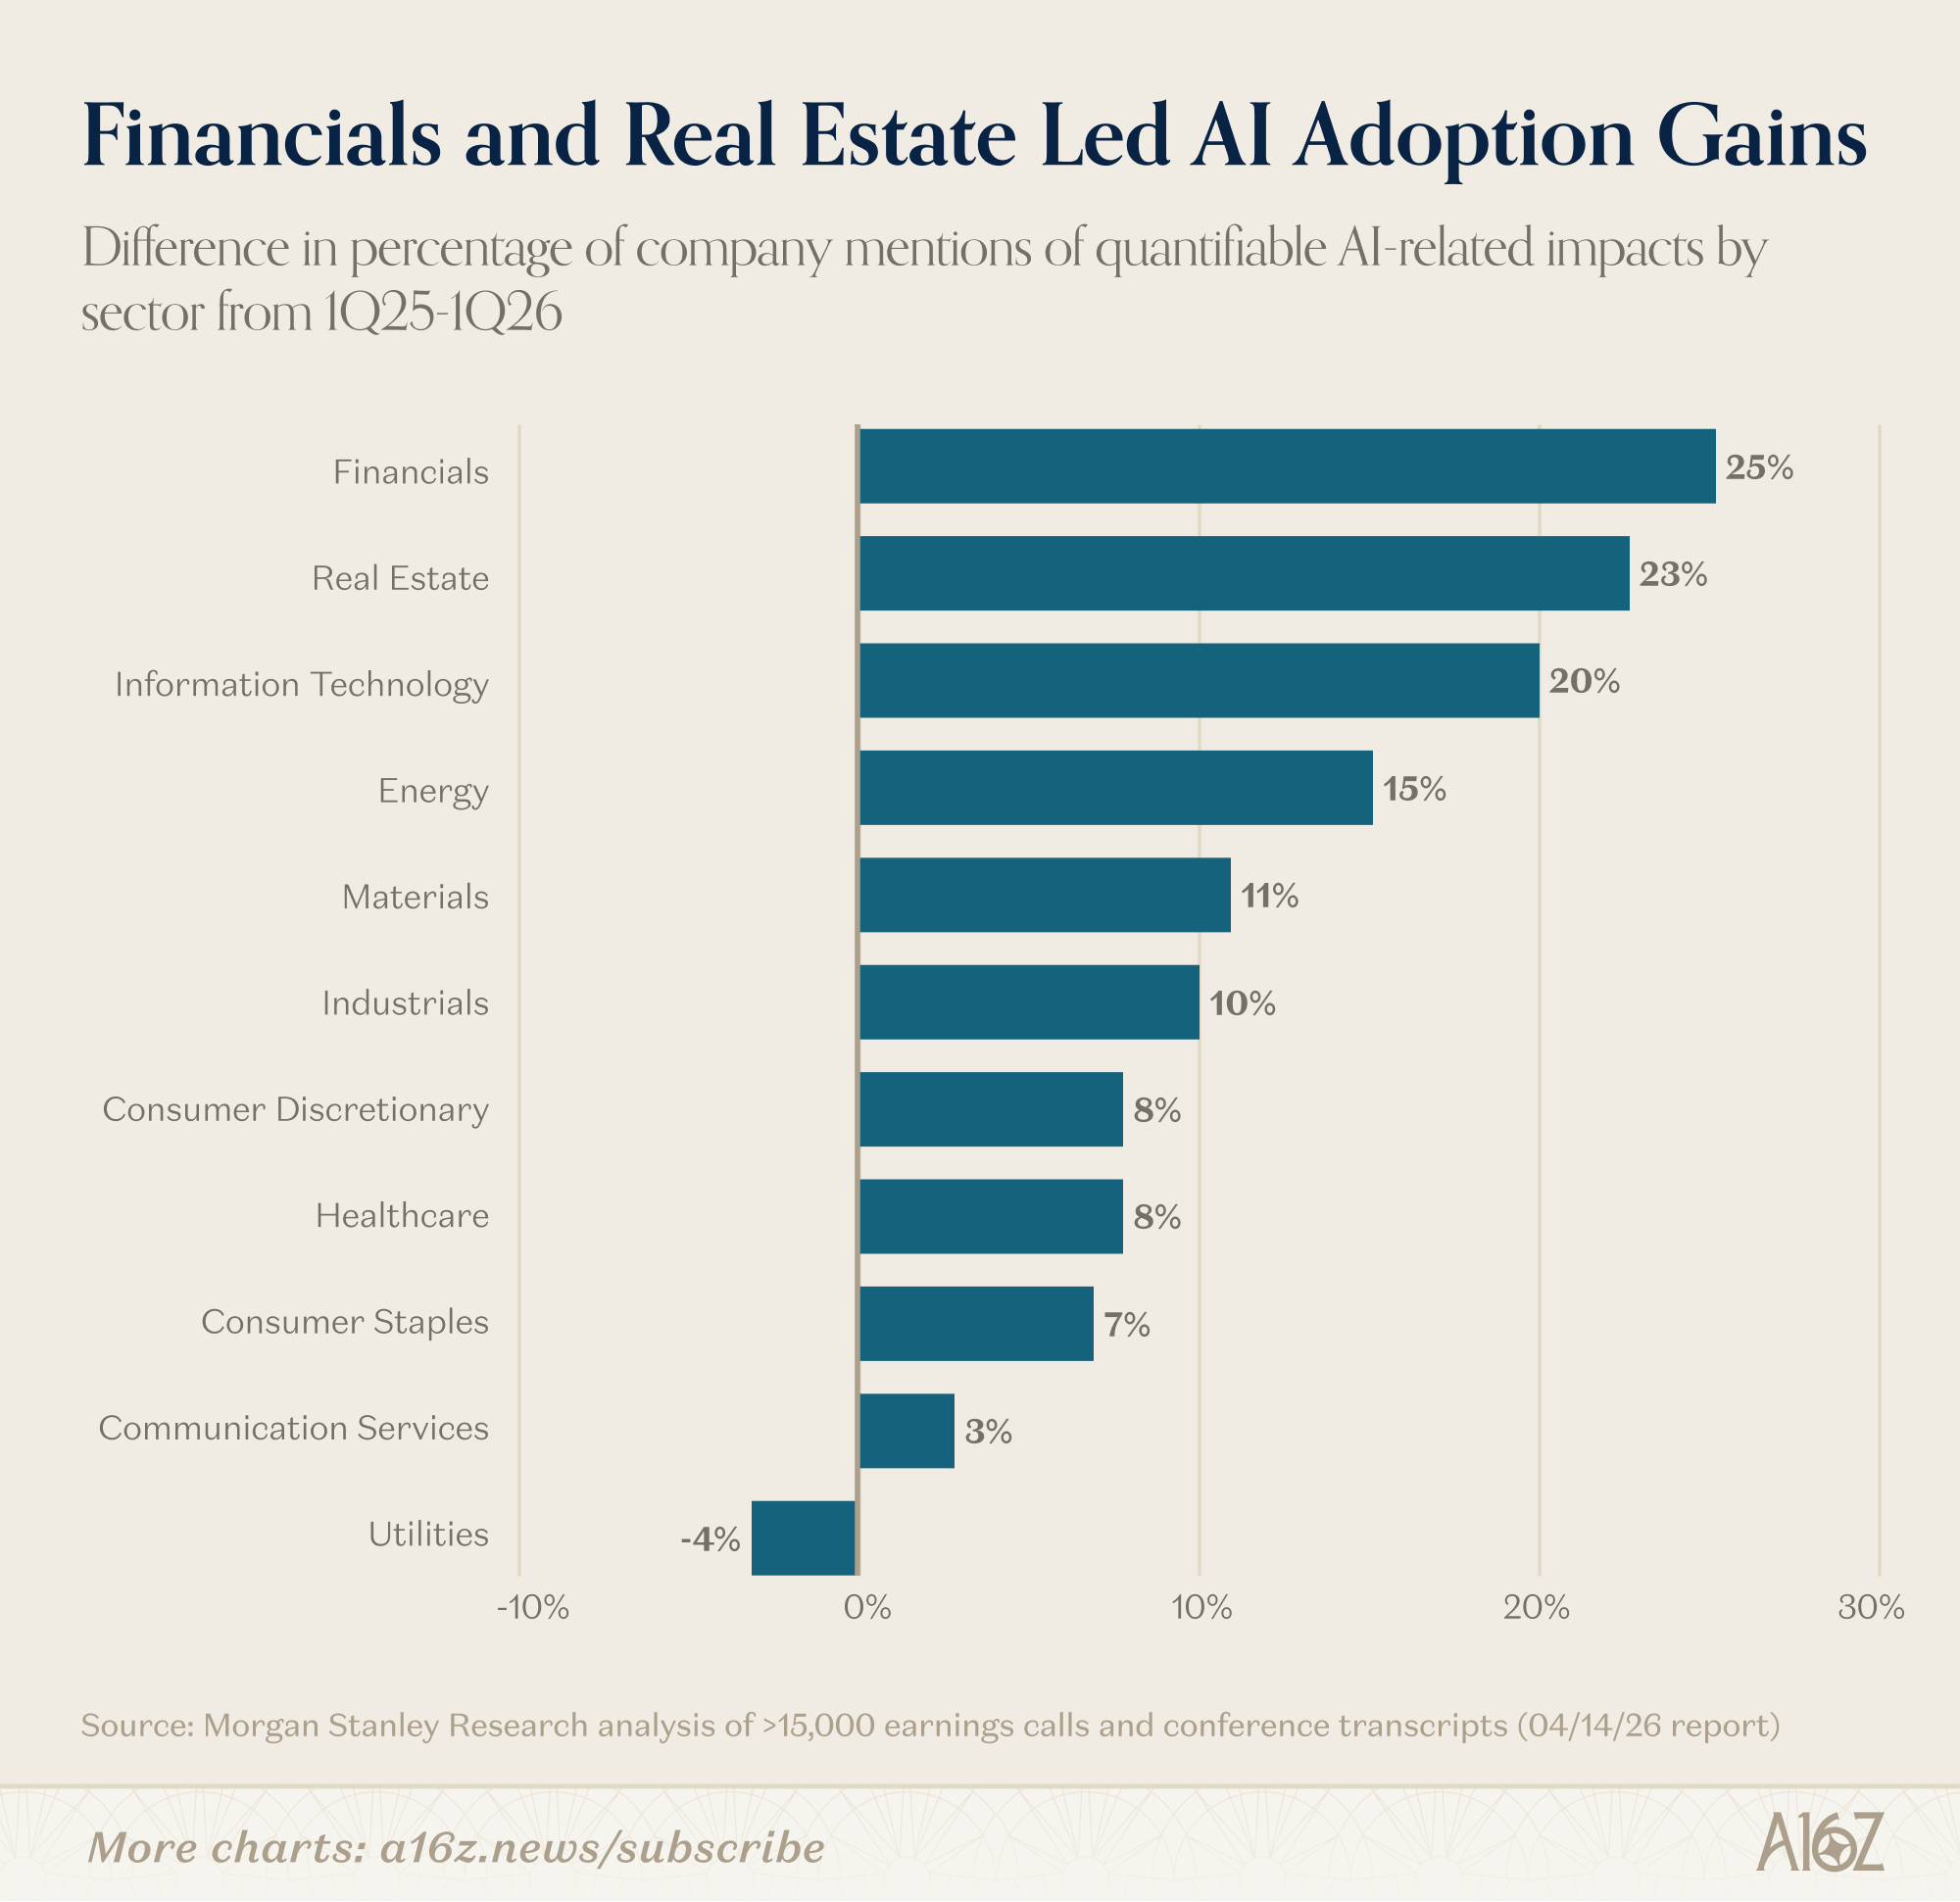
Financials and Real Estate (and IT) were the big relative movers QoQ, with those sectors increasing their mentions of quantifiable benefits by more than 20%.
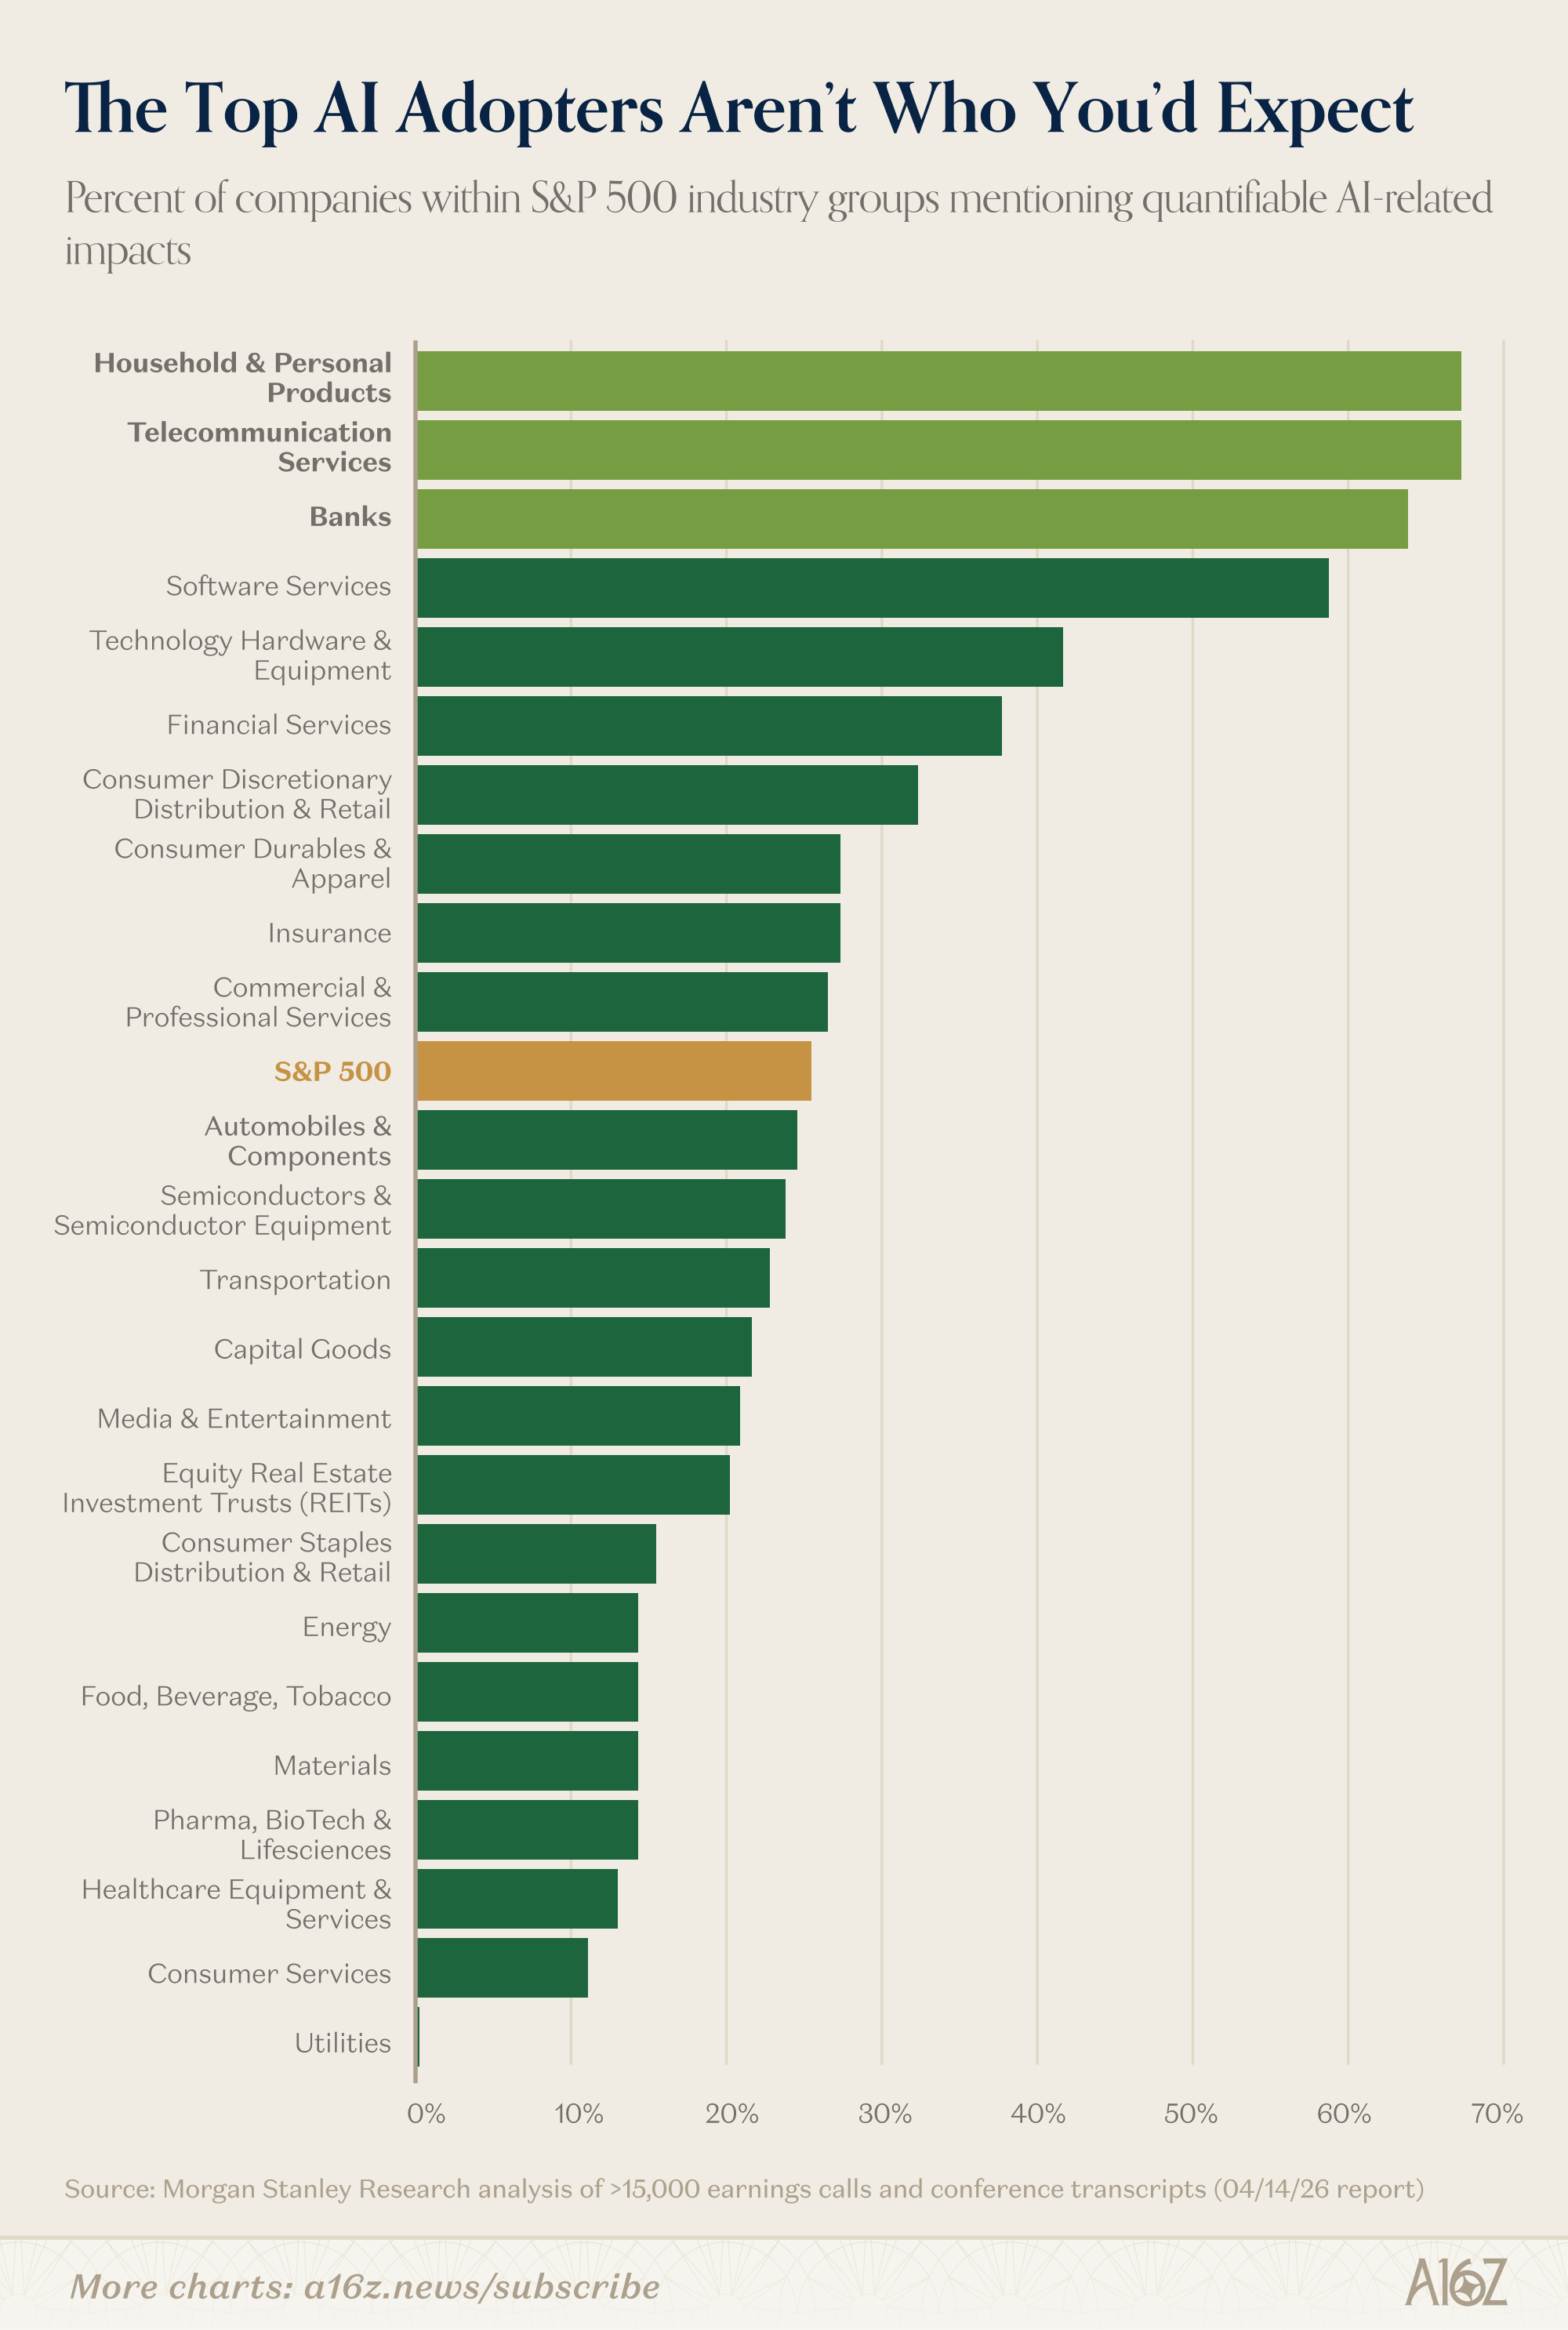
Within industry groups, the largest share of reported beneficiaries are Household & Personal Products (i.e. shopping related), Telecom, and Banks.
The financial sector has a reputation for being a slow-moving technology adopter, but at least when it comes to AI, that does not appear to be the case.
Oil matters less than it used to
Here’s a chart that, in normal times, would be making a triumphalist point about the energy transition.
Consider the decline in “oil intensity” of the global economy:
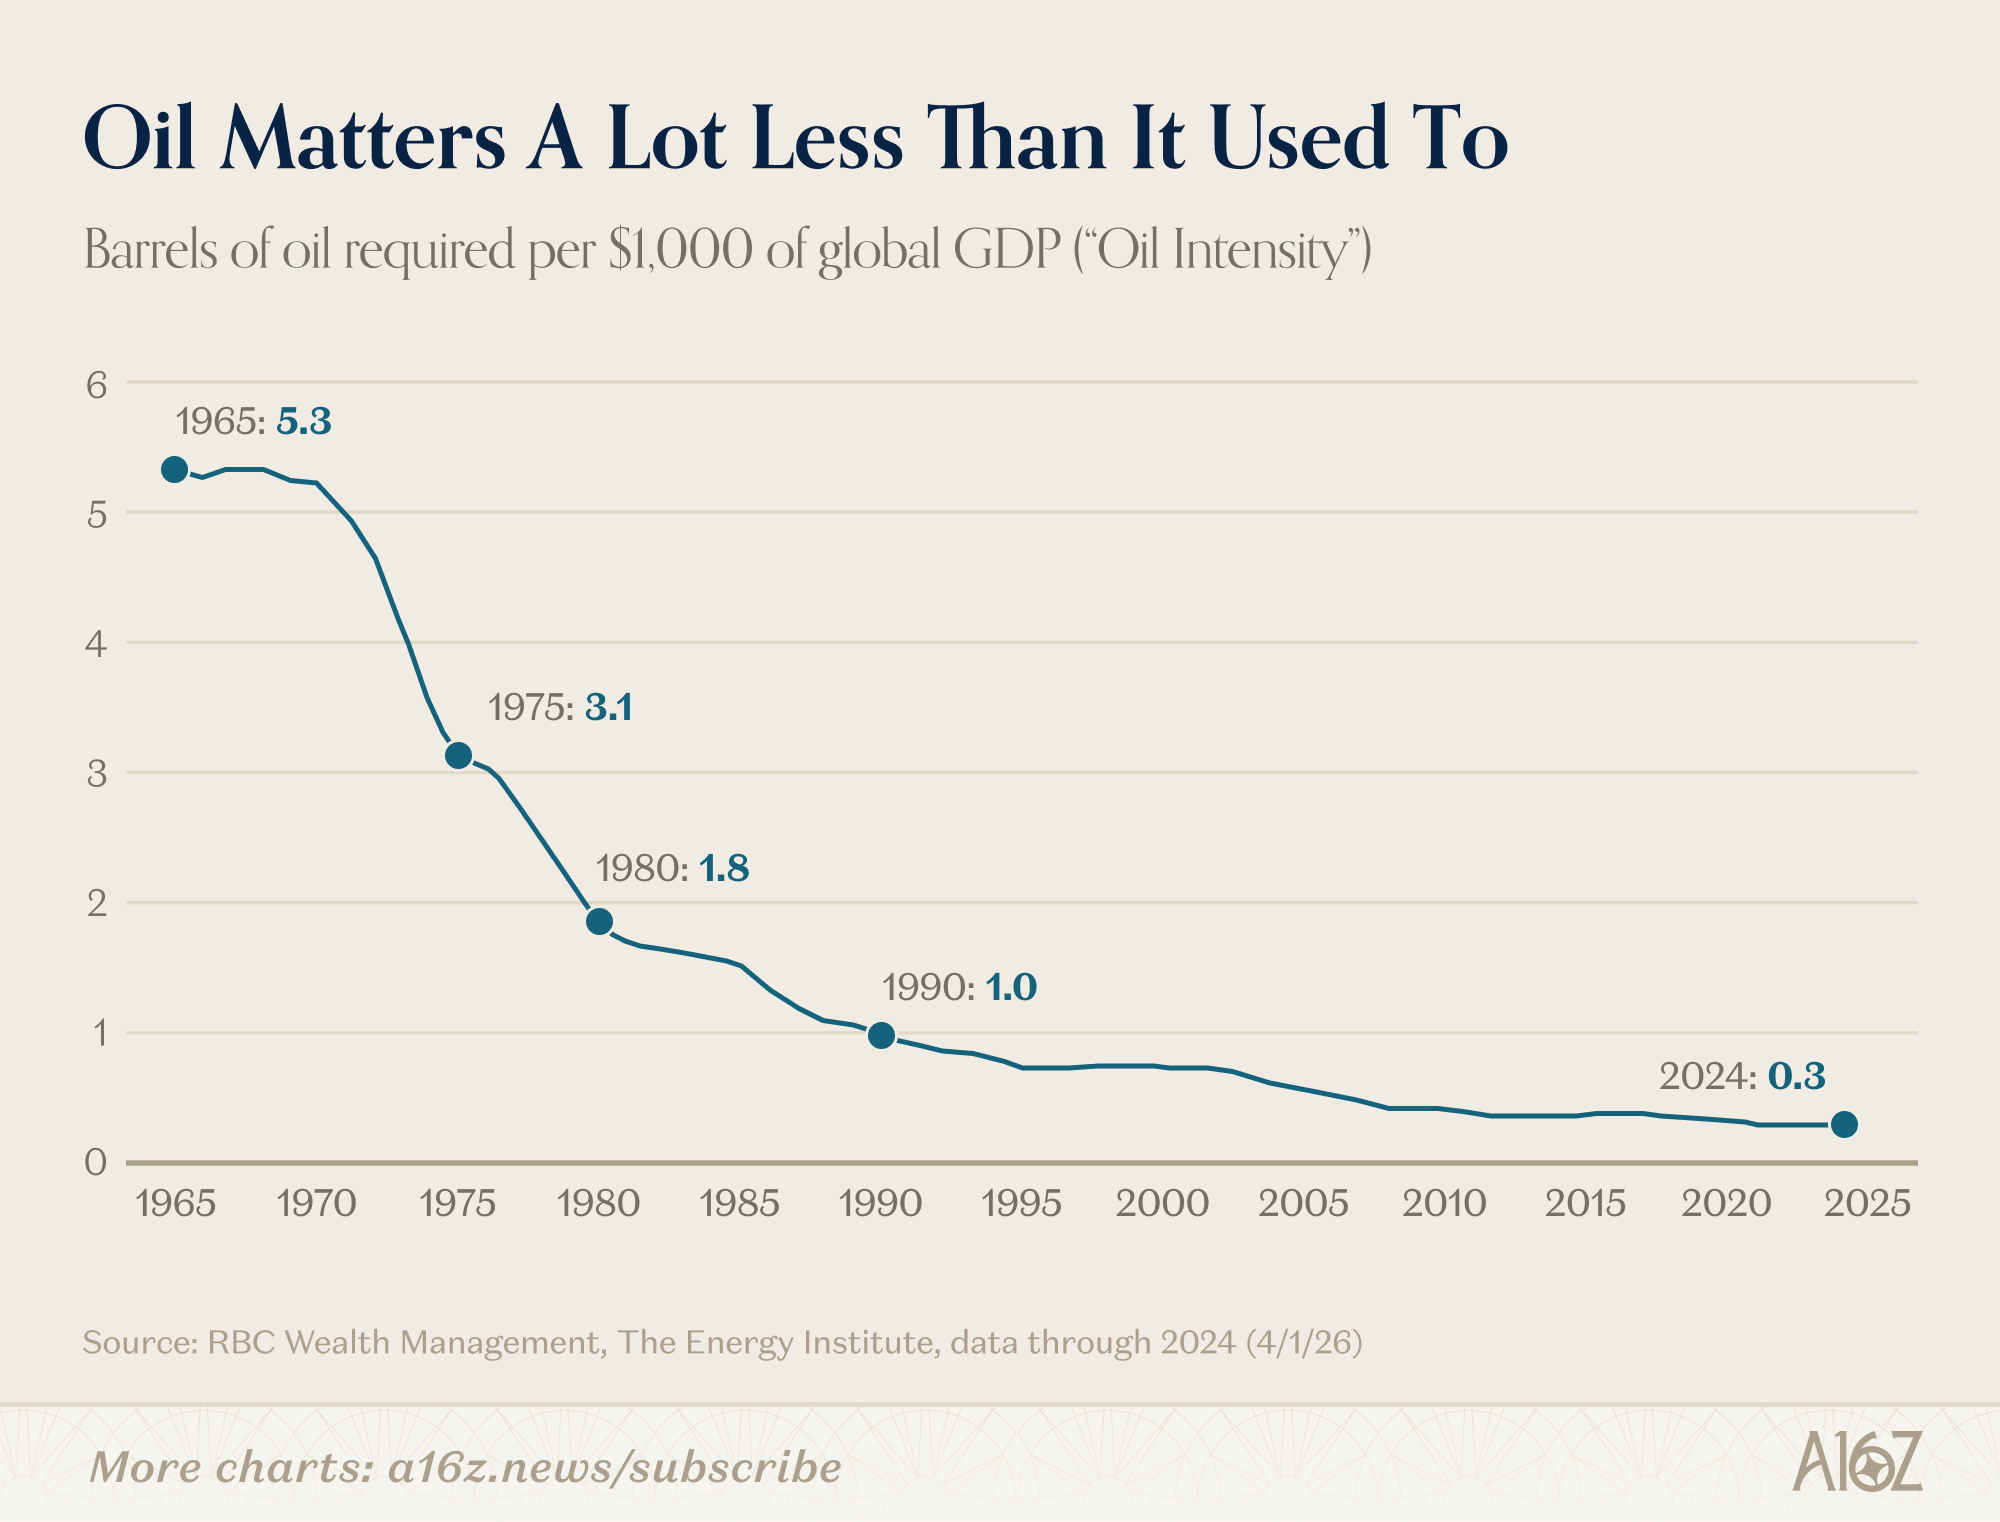
The number of Barrels of oil needed to produce $1,000 of global GDP (“Oil Intensity”) have fallen from 5.3 in 1965 to 0.3 in 2024.
That’s a 94% decline in the importance of oil to global GDP. Hooray for cleaner air!
How did this happen? There are plenty of reasons: lots and lots of efficiency gains, especially with cars. Services (and tech) replaced manufacturing in the GDP mix. Solar, Natural Gas, and in some parts of the world, Nuclear, have carried a bigger share of the energy load.
Put it all together, and the world has emphatically figured out how to create growth without relying on oil nearly as much as it used to.
That isn’t to say the conflict in the Middle East is without consequence.
According to the EIA, Iran’s closure of the Strait of Hormuz has precipitated one of the largest supply disruptions in modern oil market history:
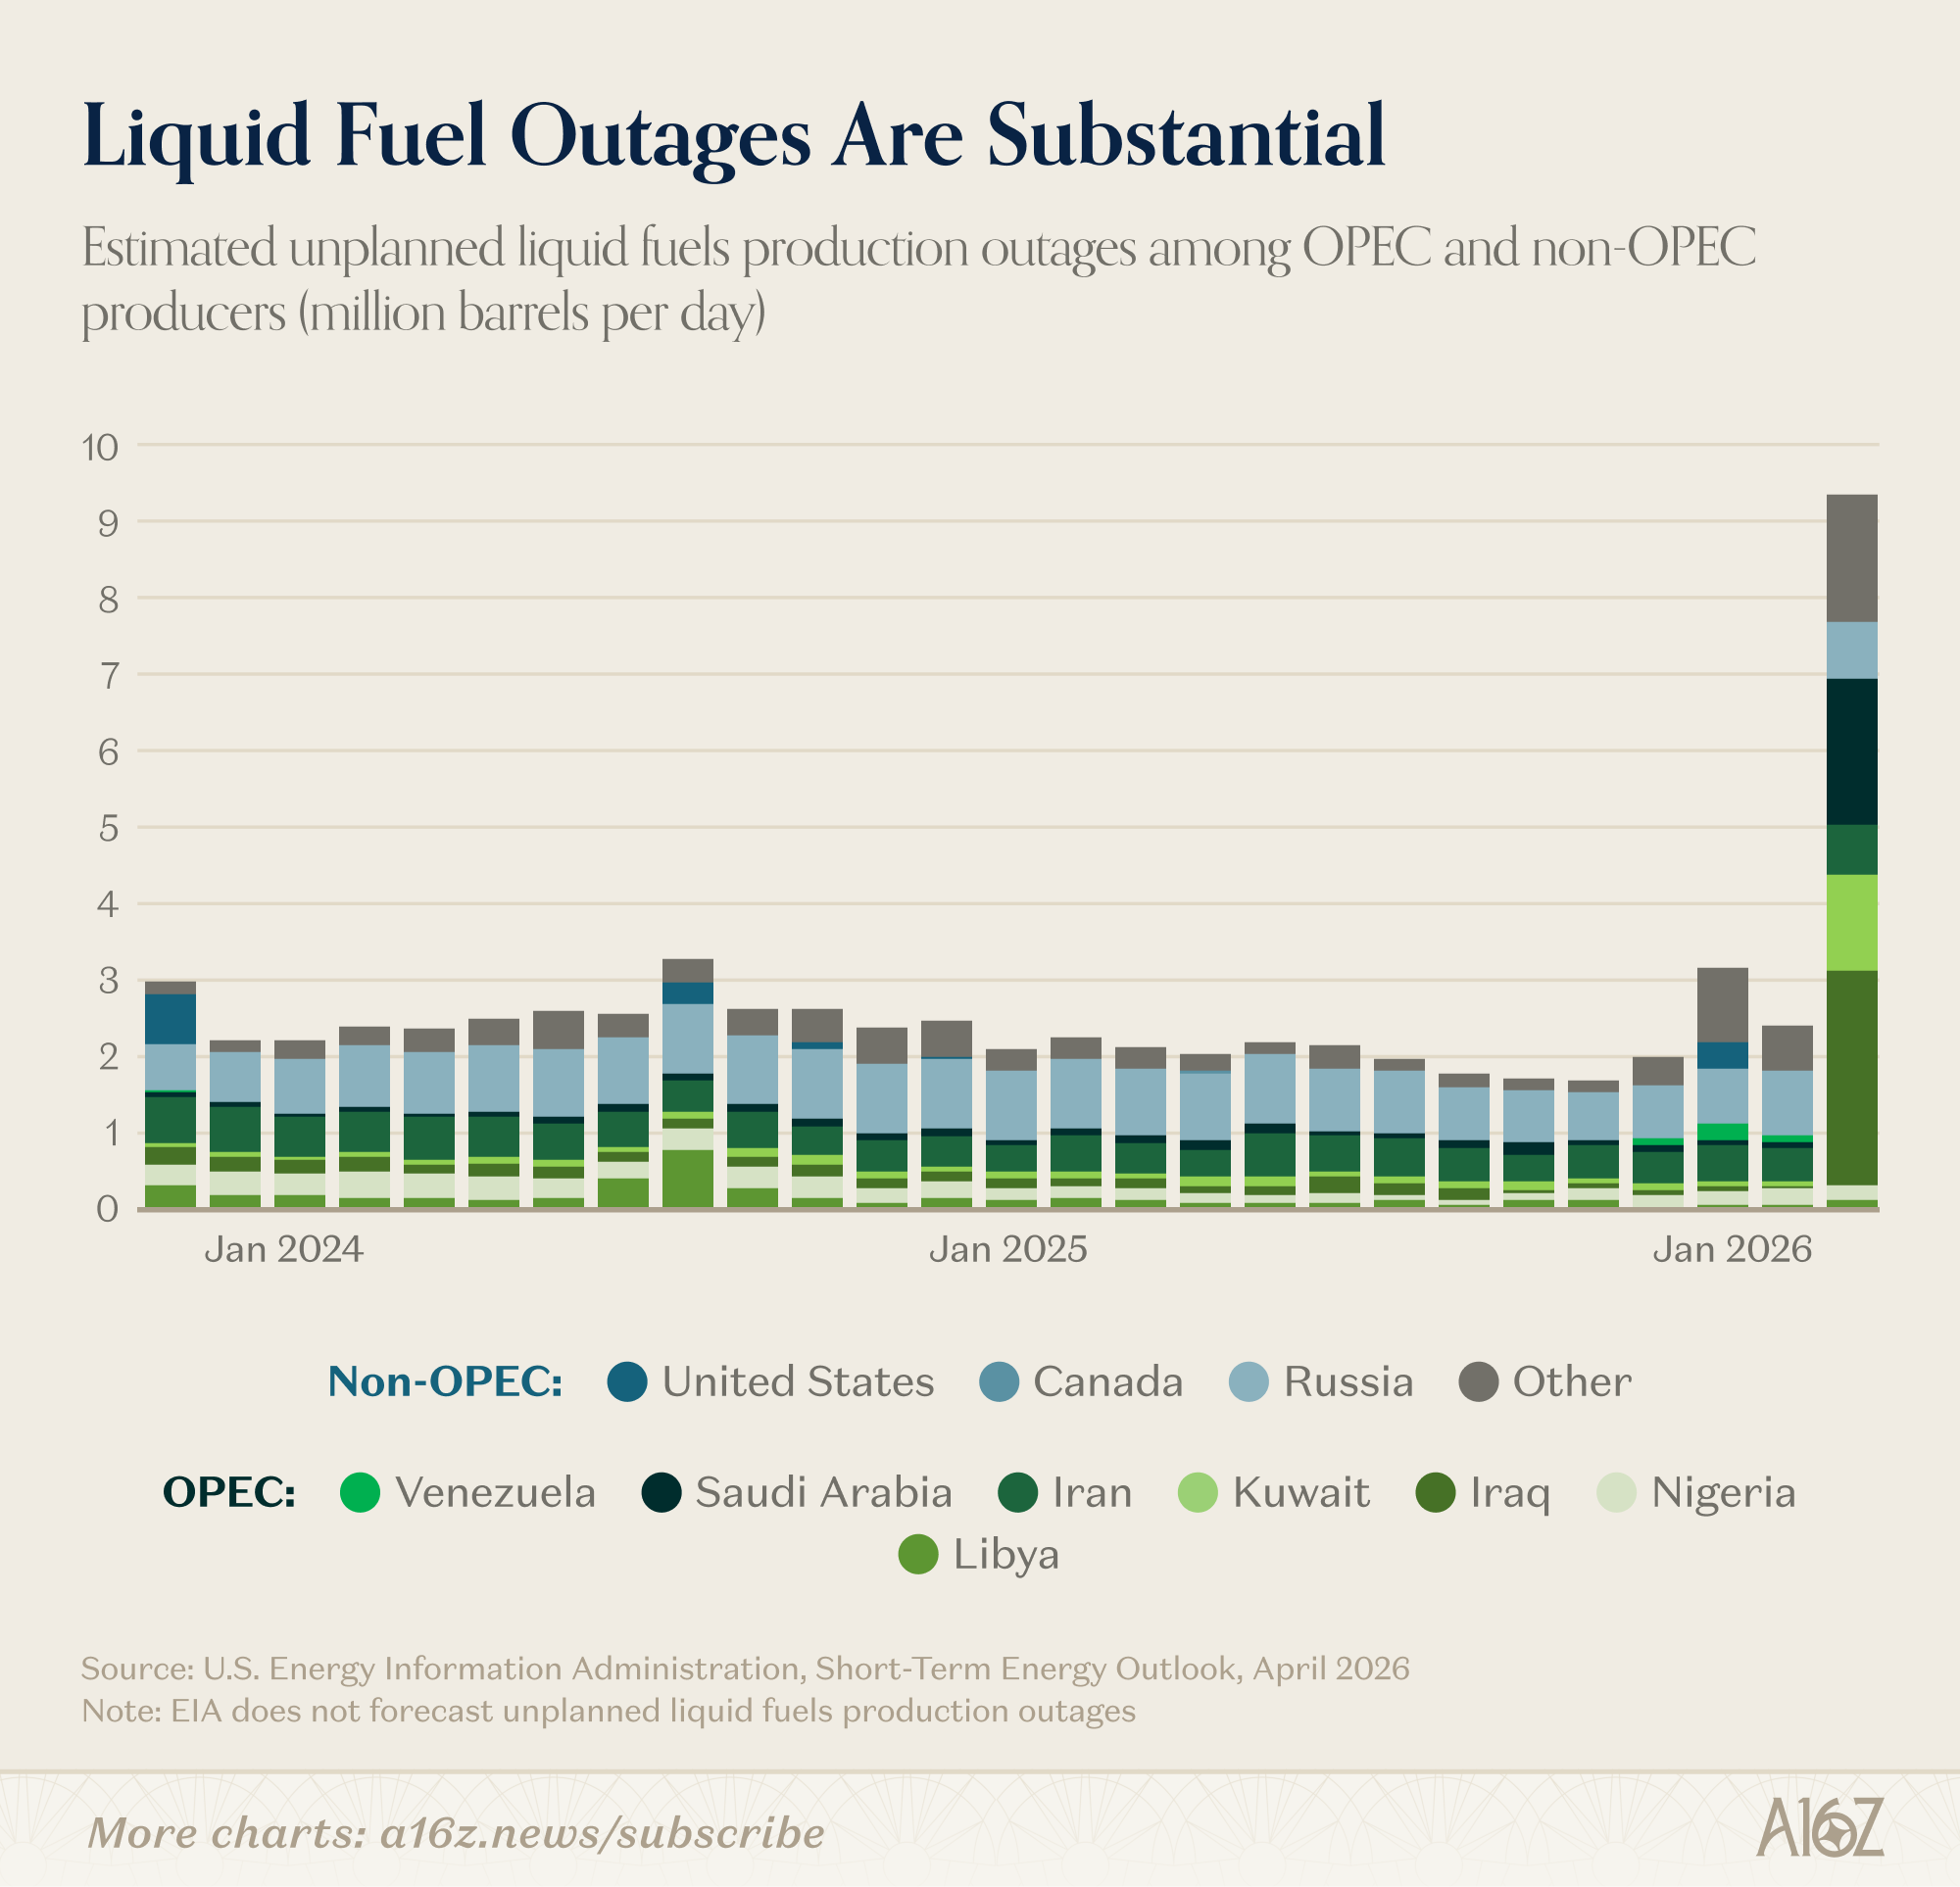
Unplanned production outages of liquid fuels are ~4.5X larger than the typical month.
That’s a lot of liquid fuel to go missing from global supply chains.
A world that uses 0.3 barrels per $1,000 of GDP is still a world that buys roughly 37 billion barrels of oil a year – or ~$3 trillion at today’s prices. It’s true that the global economy now extracts 16 times more output from each barrel than it did in 1965, but the barrels themselves are still moving through the system in enormous quantities. And a disruption to that flow still presents a major potential shock.
We are in a world where oil matters less and less every decade, but we’re not in a world where oil doesn’t matter.
And here’s the more interesting observation.
Take a look back at the RBC chart for a second. The biggest drop in oil intensity in the entire 60-year series happened between 1973 and 1985 – from above 5 to below 1.8 barrels per $1,000. That window includes the OPEC embargo, the Iranian revolution, and the policy and investment response to both.
In other words, necessity is the mother of invention. The oil shocks of yore certainly hurt, but they also taught the world to depend less oil. CAFE standards, the strategic petroleum reserve, the shift to gas, first-gen efficient cars—almost everything that drove oil intensity down—was a response to the realization that Gulf oil dependency had some drawbacks.
They don’t call energy a commodity for nothing, and when you’re talking about trillions of dollars worth of flow, every shock is a free advertisement for substitution. It’s never a good idea to bet against the Invisible Hand.
The most expensive affordable grocery store ever
New York City’s socialist Mayor is making good on his campaign promise to bring government-run grocery stores to the Big Apple.
Hizzoner recently made the first location-reveal: the ~9,000 sqft East Harlem La Marqueta, expected to open in 2029, at a $30M cost to taxpayers.
Fortunately, grocery is a well-solved problem, with plenty of data on what it typically costs to open a new grocery store. In case you were wondering, $30M is indeed a bit rich. Consider the following napkin-math of how much grocery $30M might otherwise buy:1
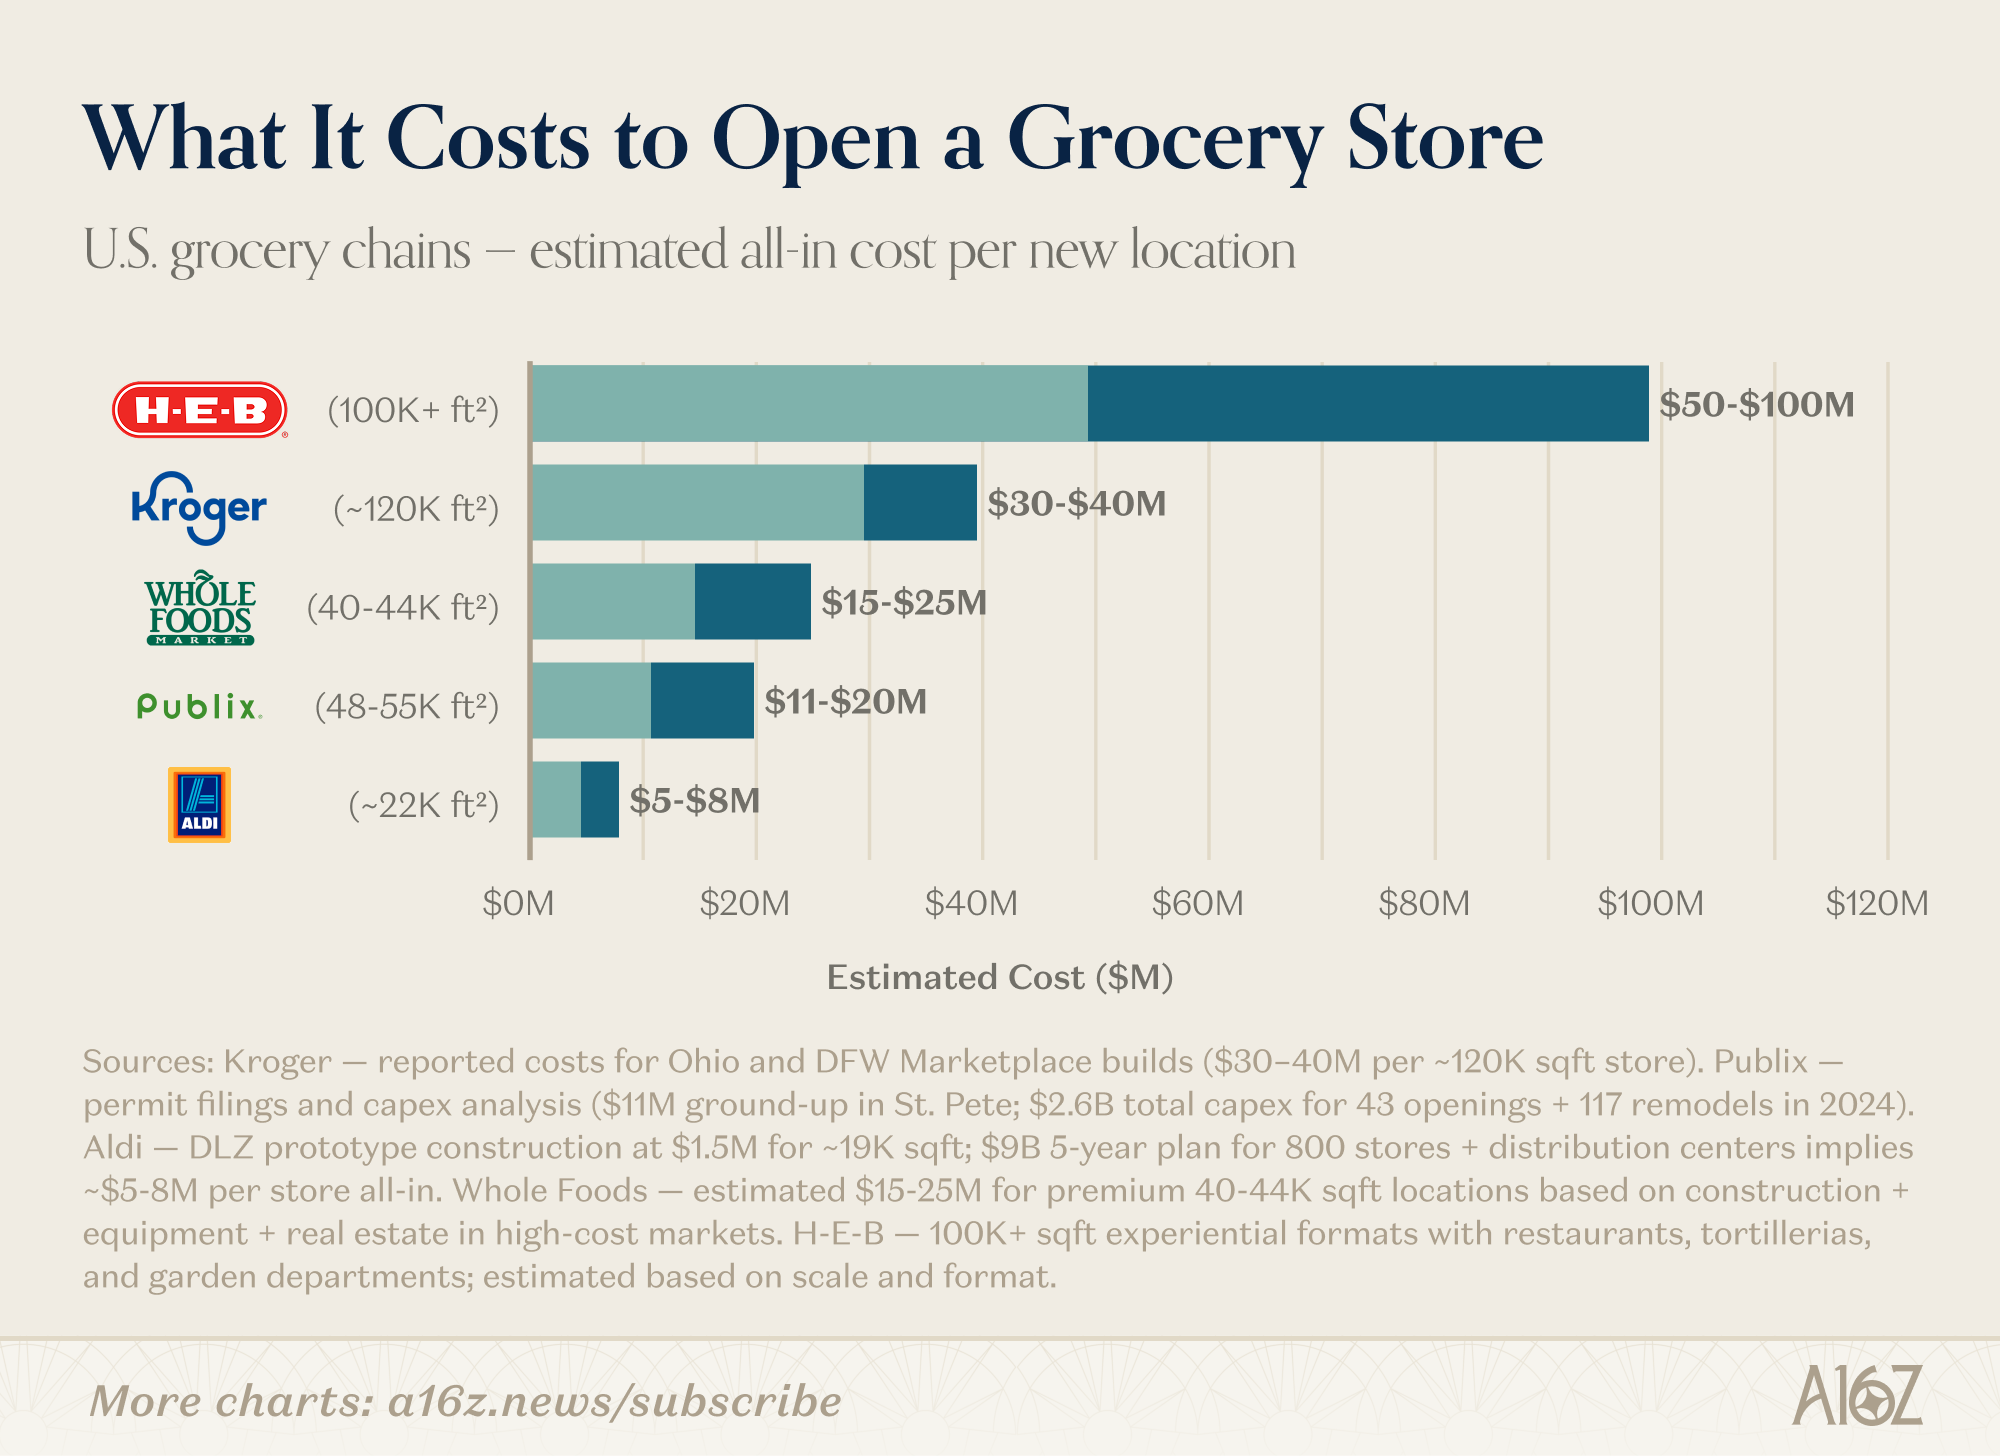
For $30M, you could get:
~5 Aldis (and 10x the grocery square footage)
1 Kroger (which is, again, ~12x larger than Mamdani’s collectivist venture); or
either of a Whole Foods or a Publix (both 4x larger), with ~$10M in take home money to spare.
And while H-E-Bs might look expensive, not only are they relatively massive, they also typically include things like a Garden Center, Restaurants and BBQ, and other capital-intensive sundries that La Marqueta is unlikely to offer.
On a per square foot basis, Mamdani’s (taxpayer-funded) largesse is even more striking:
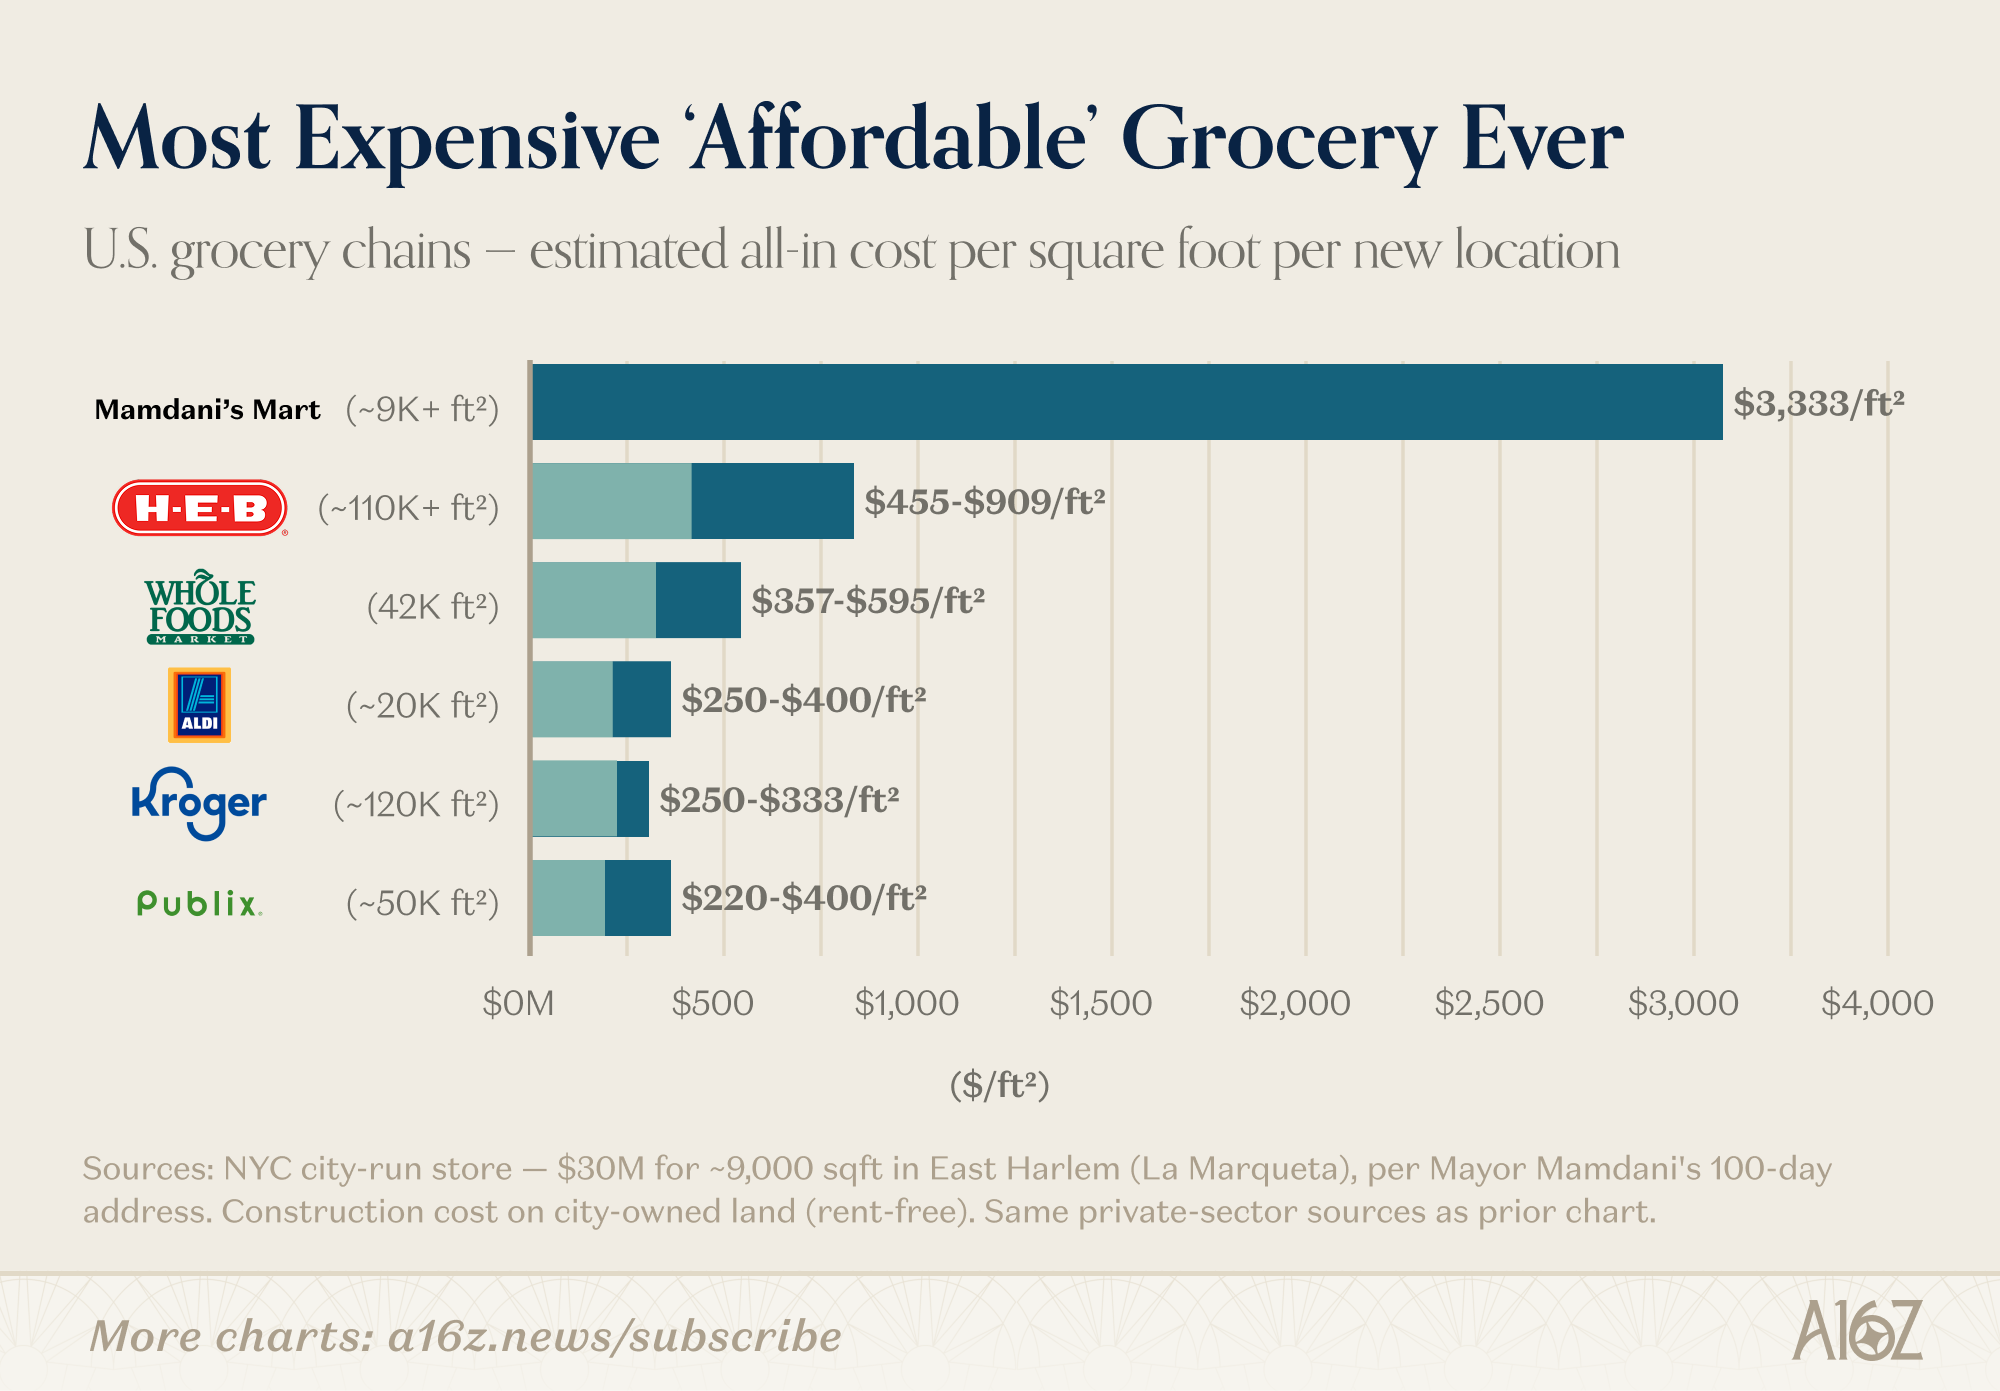
At ~$3,333/sqft, the warm embrace of collectivism is promising the most luxurious grocery store by a factor of ~10.
It sure seems like “affordable, high-quality groceries” is an area where we’ve made a lot of progress. But if not, it’s hard to see how (an already cash-strapped city) building perhaps the most expensive “affordable” grocery ever improves the situation all that much.


This newsletter is provided for informational purposes only, and should not be relied upon as legal, business, investment, or tax advice. Furthermore, this content is not investment advice, nor is it intended for use by any investors or prospective investors in any a16z funds. This newsletter may link to other websites or contain other information obtained from third-party sources - a16z has not independently verified nor makes any representations about the current or enduring accuracy of such information. If this content includes third-party advertisements, a16z has not reviewed such advertisements and does not endorse any advertising content or related companies contained therein. Any investments or portfolio companies mentioned, referred to, or described are not representative of all investments in vehicles managed by a16z; visit https://a16z.com/investment-list/ for a full list of investments. Other important information can be found at a16z.com/disclosures. You’re receiving this newsletter since you opted in earlier; if you would like to opt out of future newsletters you may unsubscribe immediately.
Yes, we used to AI to do this calculation. No, it’s not a rigorous analysis of the actual per sqft cost of opening a grocery store in NYC. It’s for illustrative purposes only, and if the robot made a mistake, hopefully that doesn’t ruin anyone’s weekend.
Great article, as usual. That said, I think the grocery store analysis is a bit misleading - New York is one of the most expensive cities in the world, so of course it’ll cost more to build a grocery store there than OH/FL or across the nation as an average. Understandably, we probably don’t have the public data from other grocers to compare NY build costs, but I think there’s too much variance in a nationwide sample for it to be a helpful comparison.
FWIW, I’m also skeptical the stores will be successful, but I don’t think it’s helpful to write them off already based on this analysis.
The "quantifiable AI benefits rising" frame is the quiet tell here. Most AI ROI debates have been stuck on unmeasurable productivity gains, which is why pricing defaulted to tokens — vendors billed for effort because nobody could agree on outcome. The moment benefits become quantifiable is the moment pricing flips to outcome-based, and that's where the category separates winners from the rest.