

Charts of the Week: Venture's $300B Quarter
Construction’s Productivity Problem; Summer Travel Is Getting More Expensive; The Inference Buildout; Strait of Hormuz Disruptions Threaten Global Fertilizer Supply


America | Tech | Opinion | Culture | Charts

$300 Billion Quarter
Q1 2026 was, by a wide margin, the largest quarter for venture investment ever recorded. Crunchbase data shows $300 billion poured into roughly 6,000 startups globally, up 150%+ both quarter over quarter and year over year.
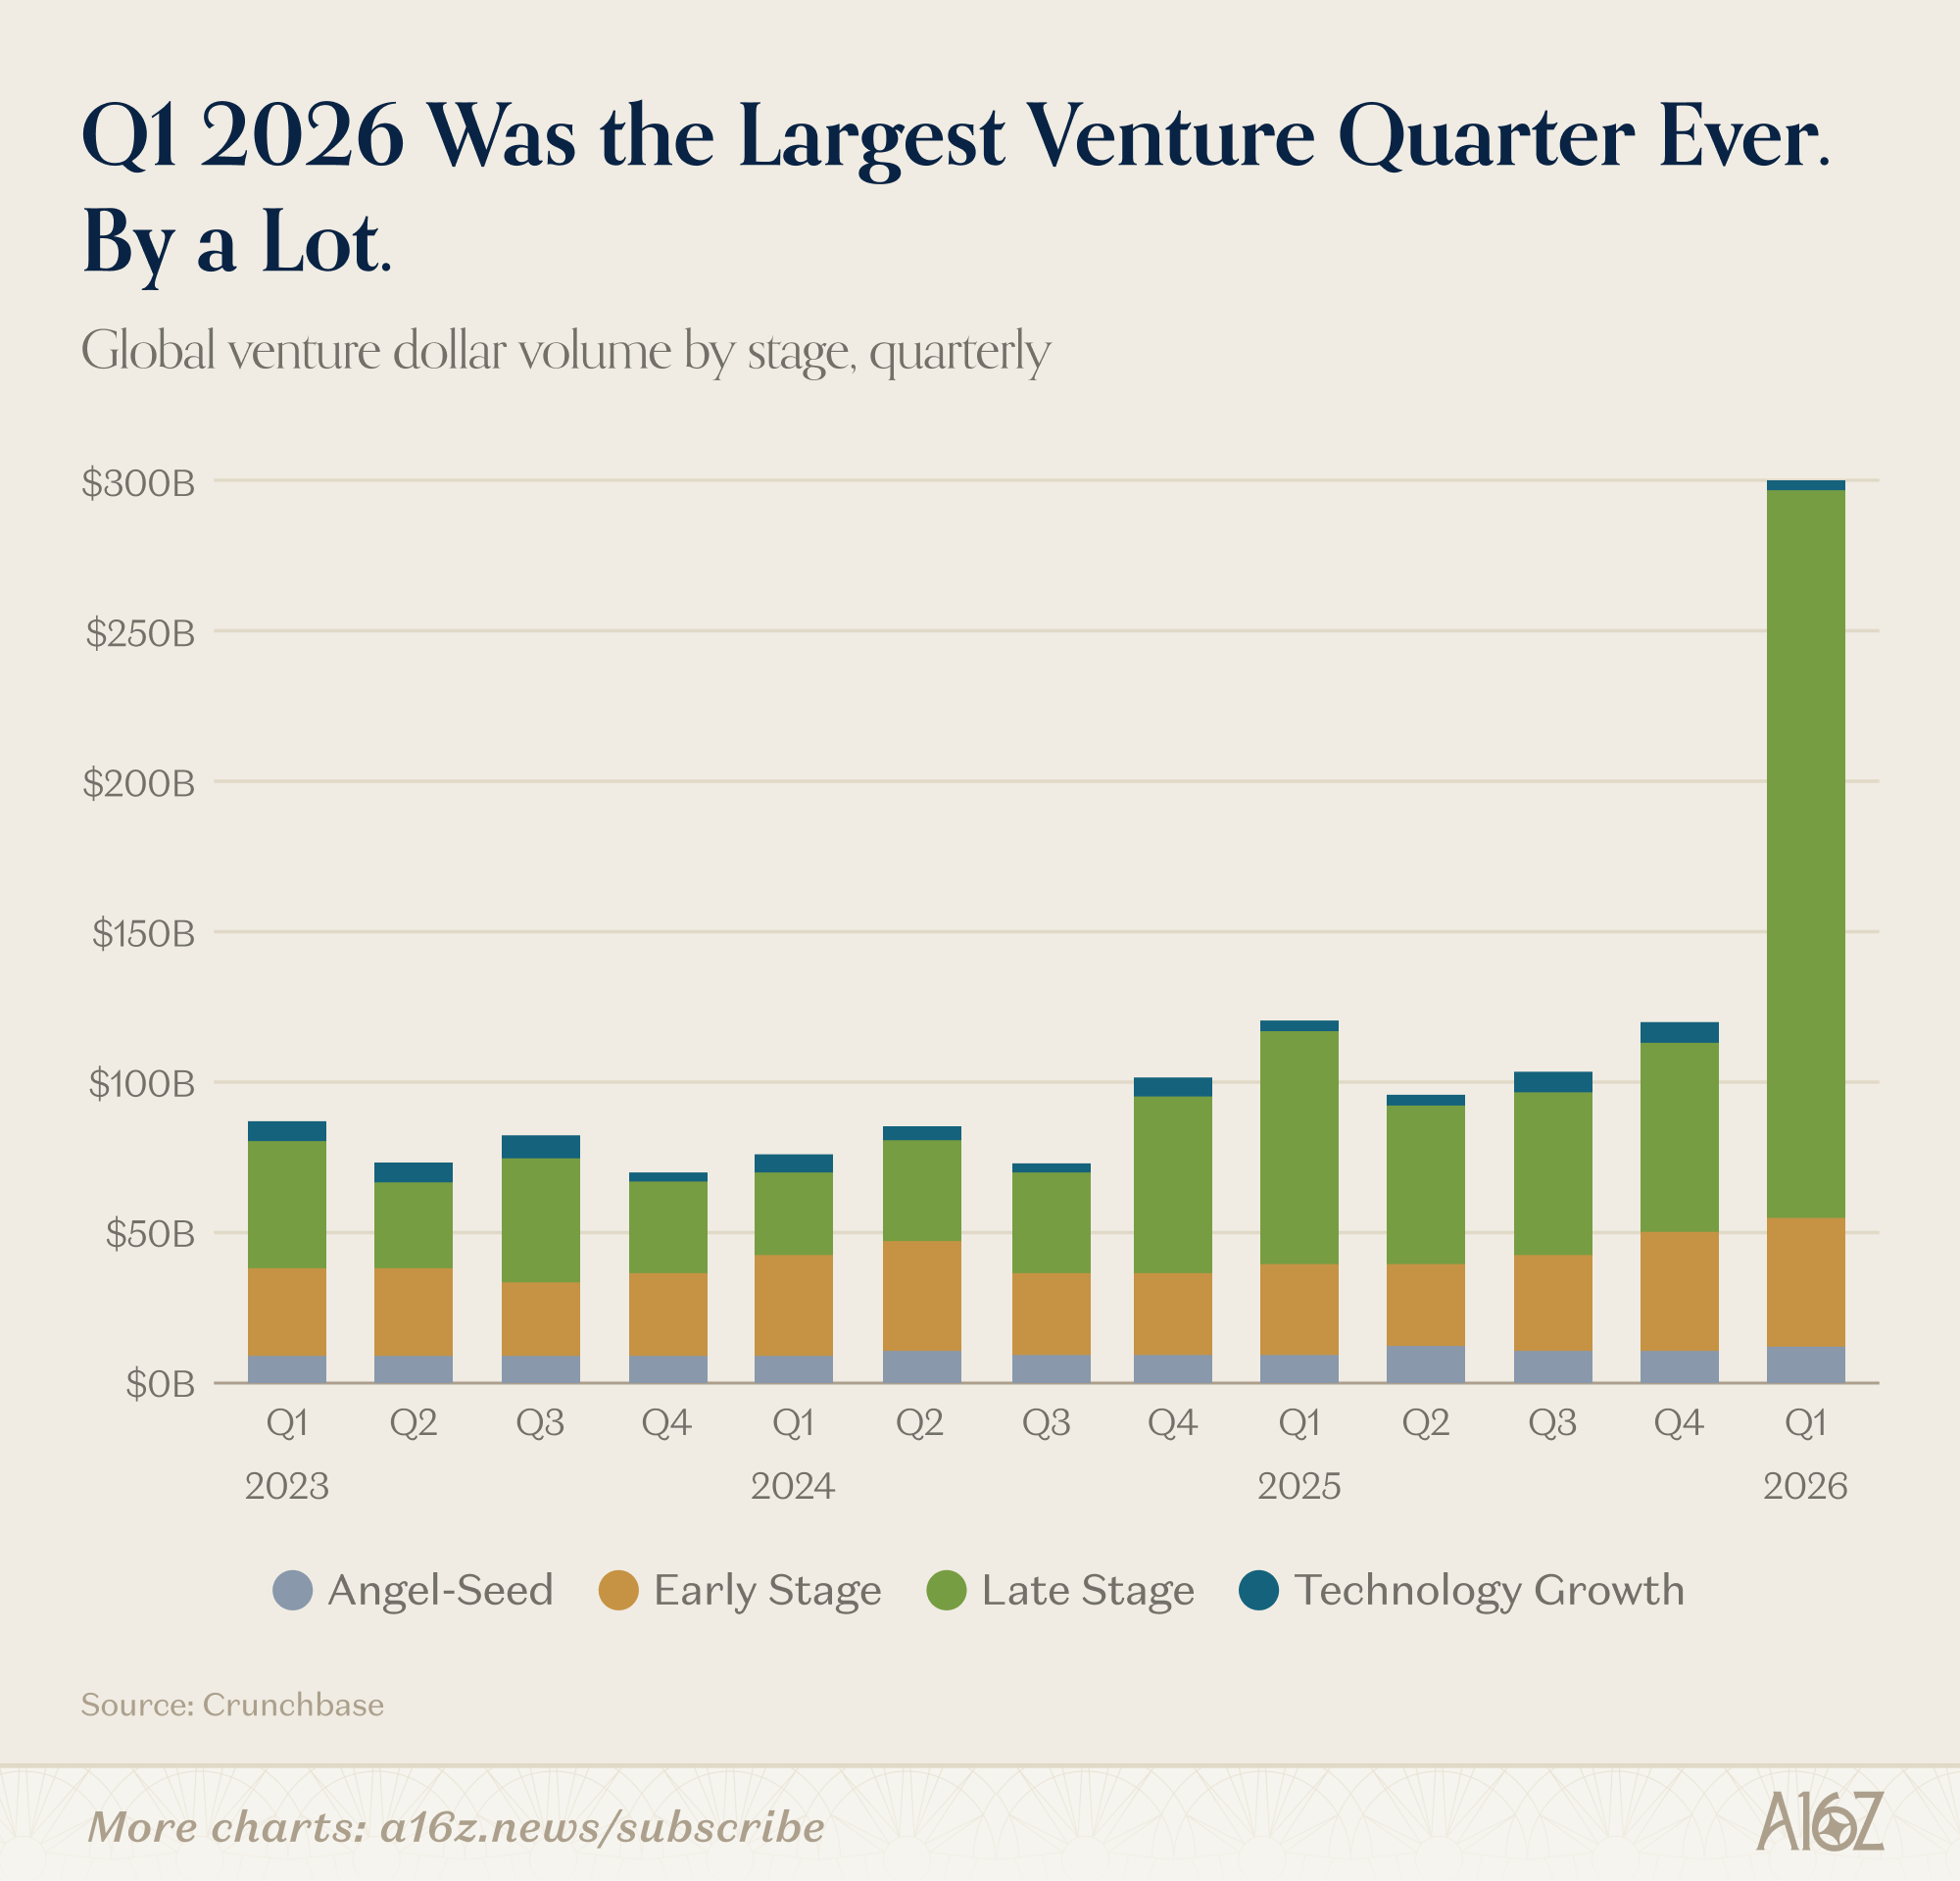
The obvious reaction is “well, that’s just four mega-deals.” And yes, OpenAI, Anthropic, xAI, and Waymo combined for $188 billion, roughly 65% of the total.
But even if you strip those out, you’re looking at a ~$112 billion quarter, which would still be a record in most prior years.
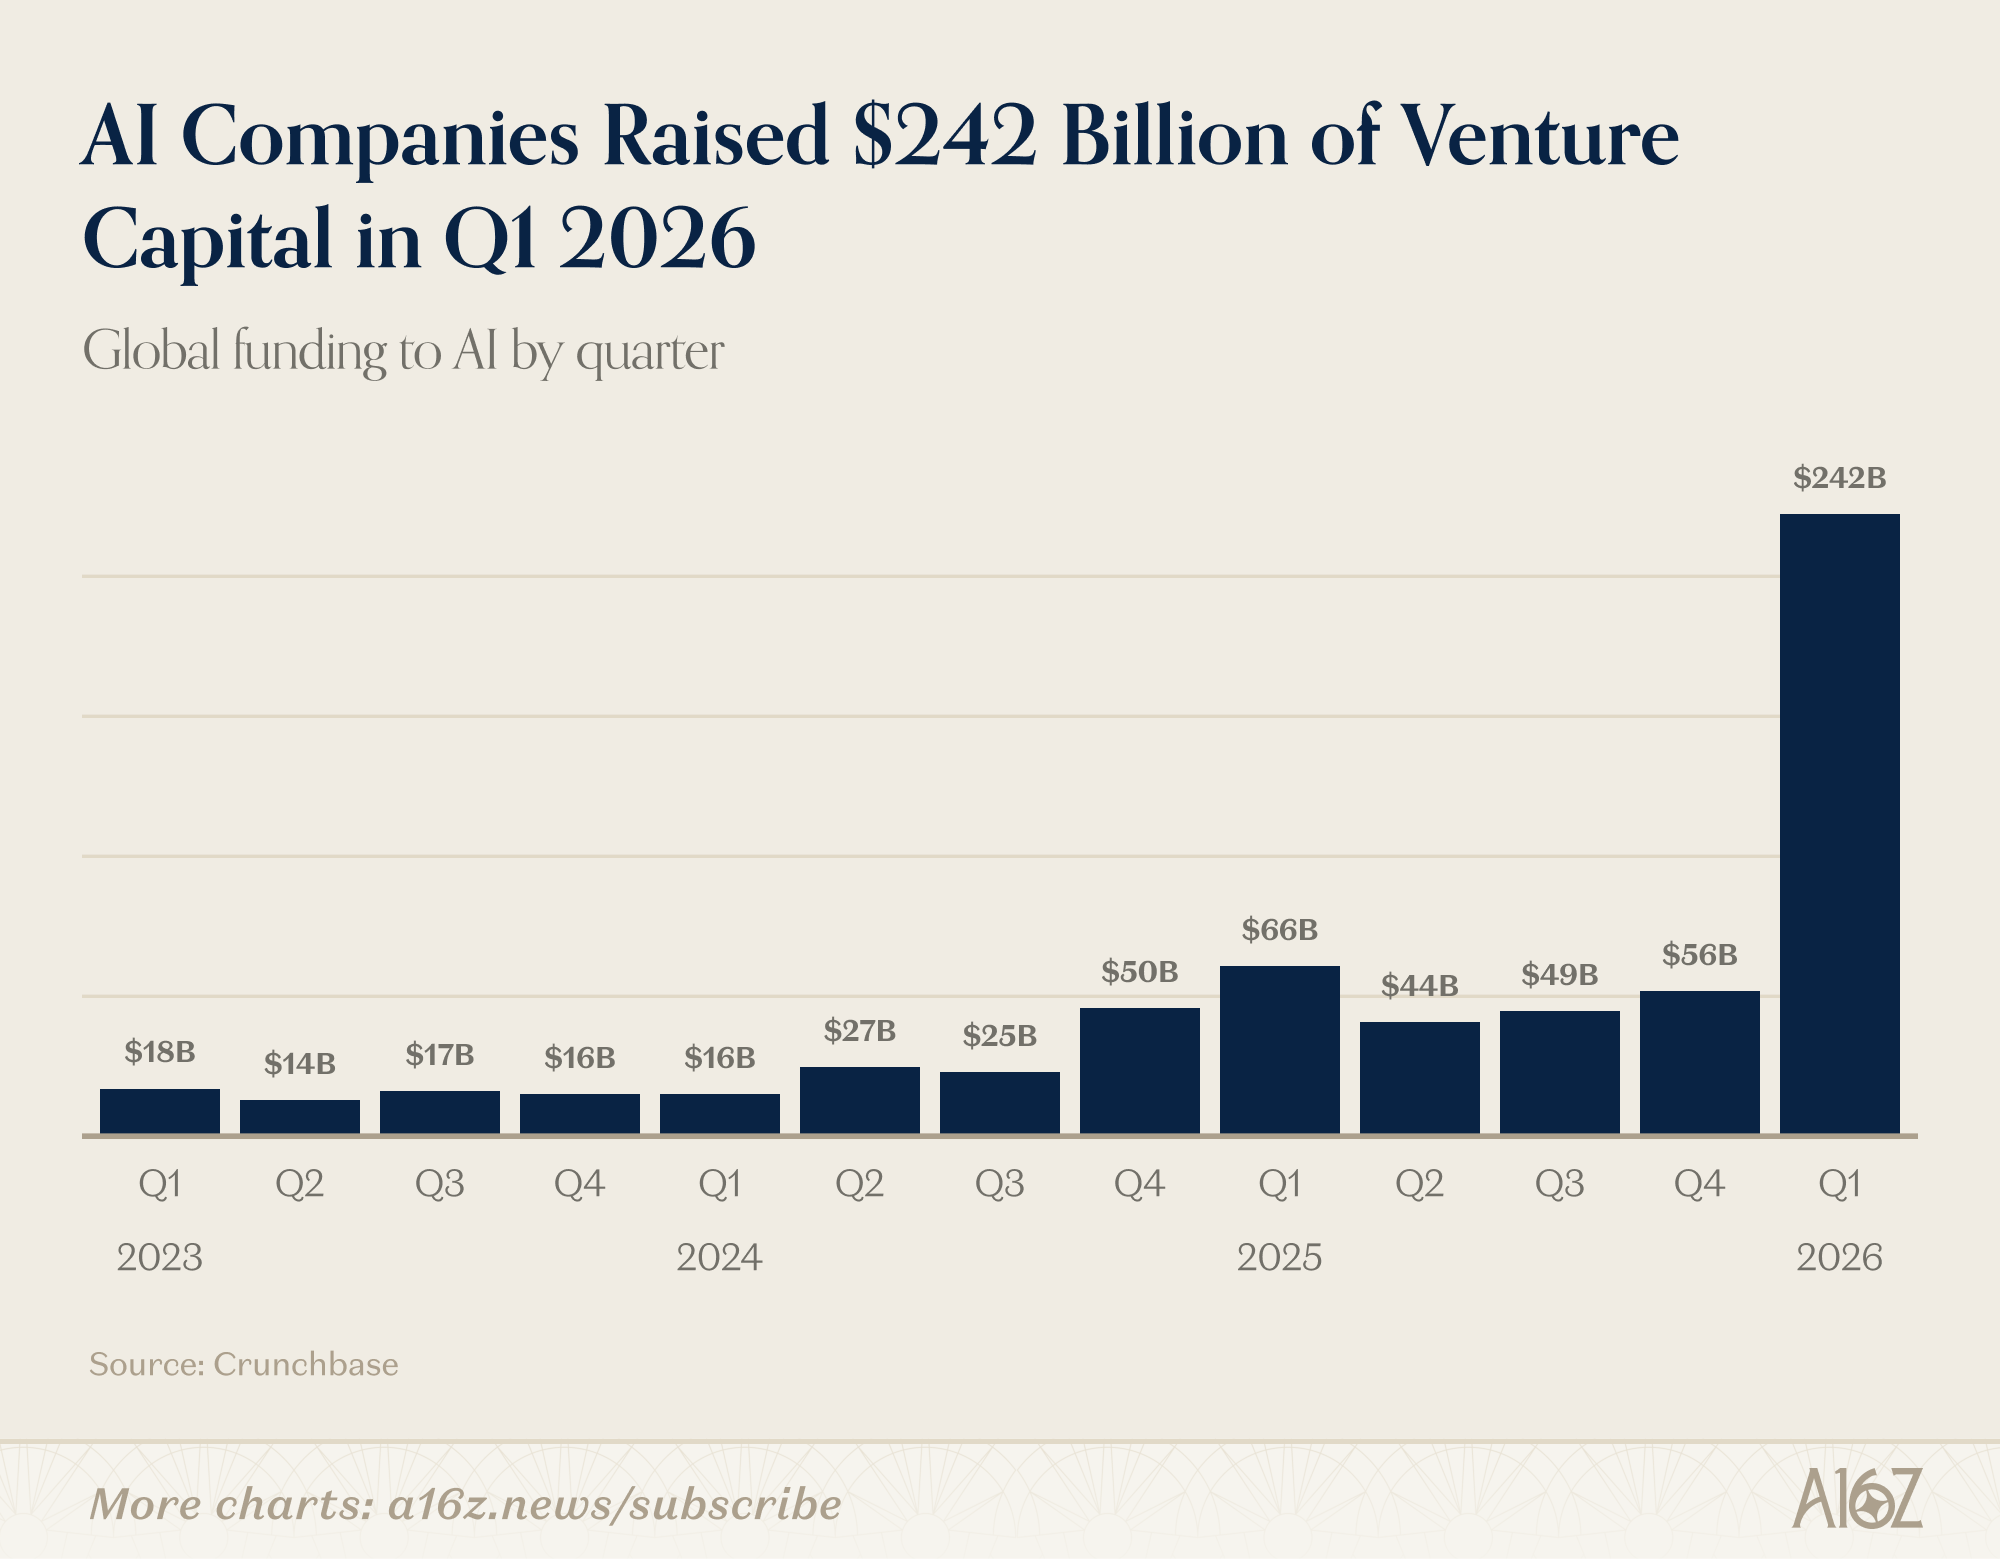
Roughly 80% of the $300 billion went to AI companies, up from 55% a year ago.
What’s easy to miss in the megaround discourse is that the rest of the market grew too. Early-stage funding was up 41% year over year, and seed was up 31% in dollar terms.
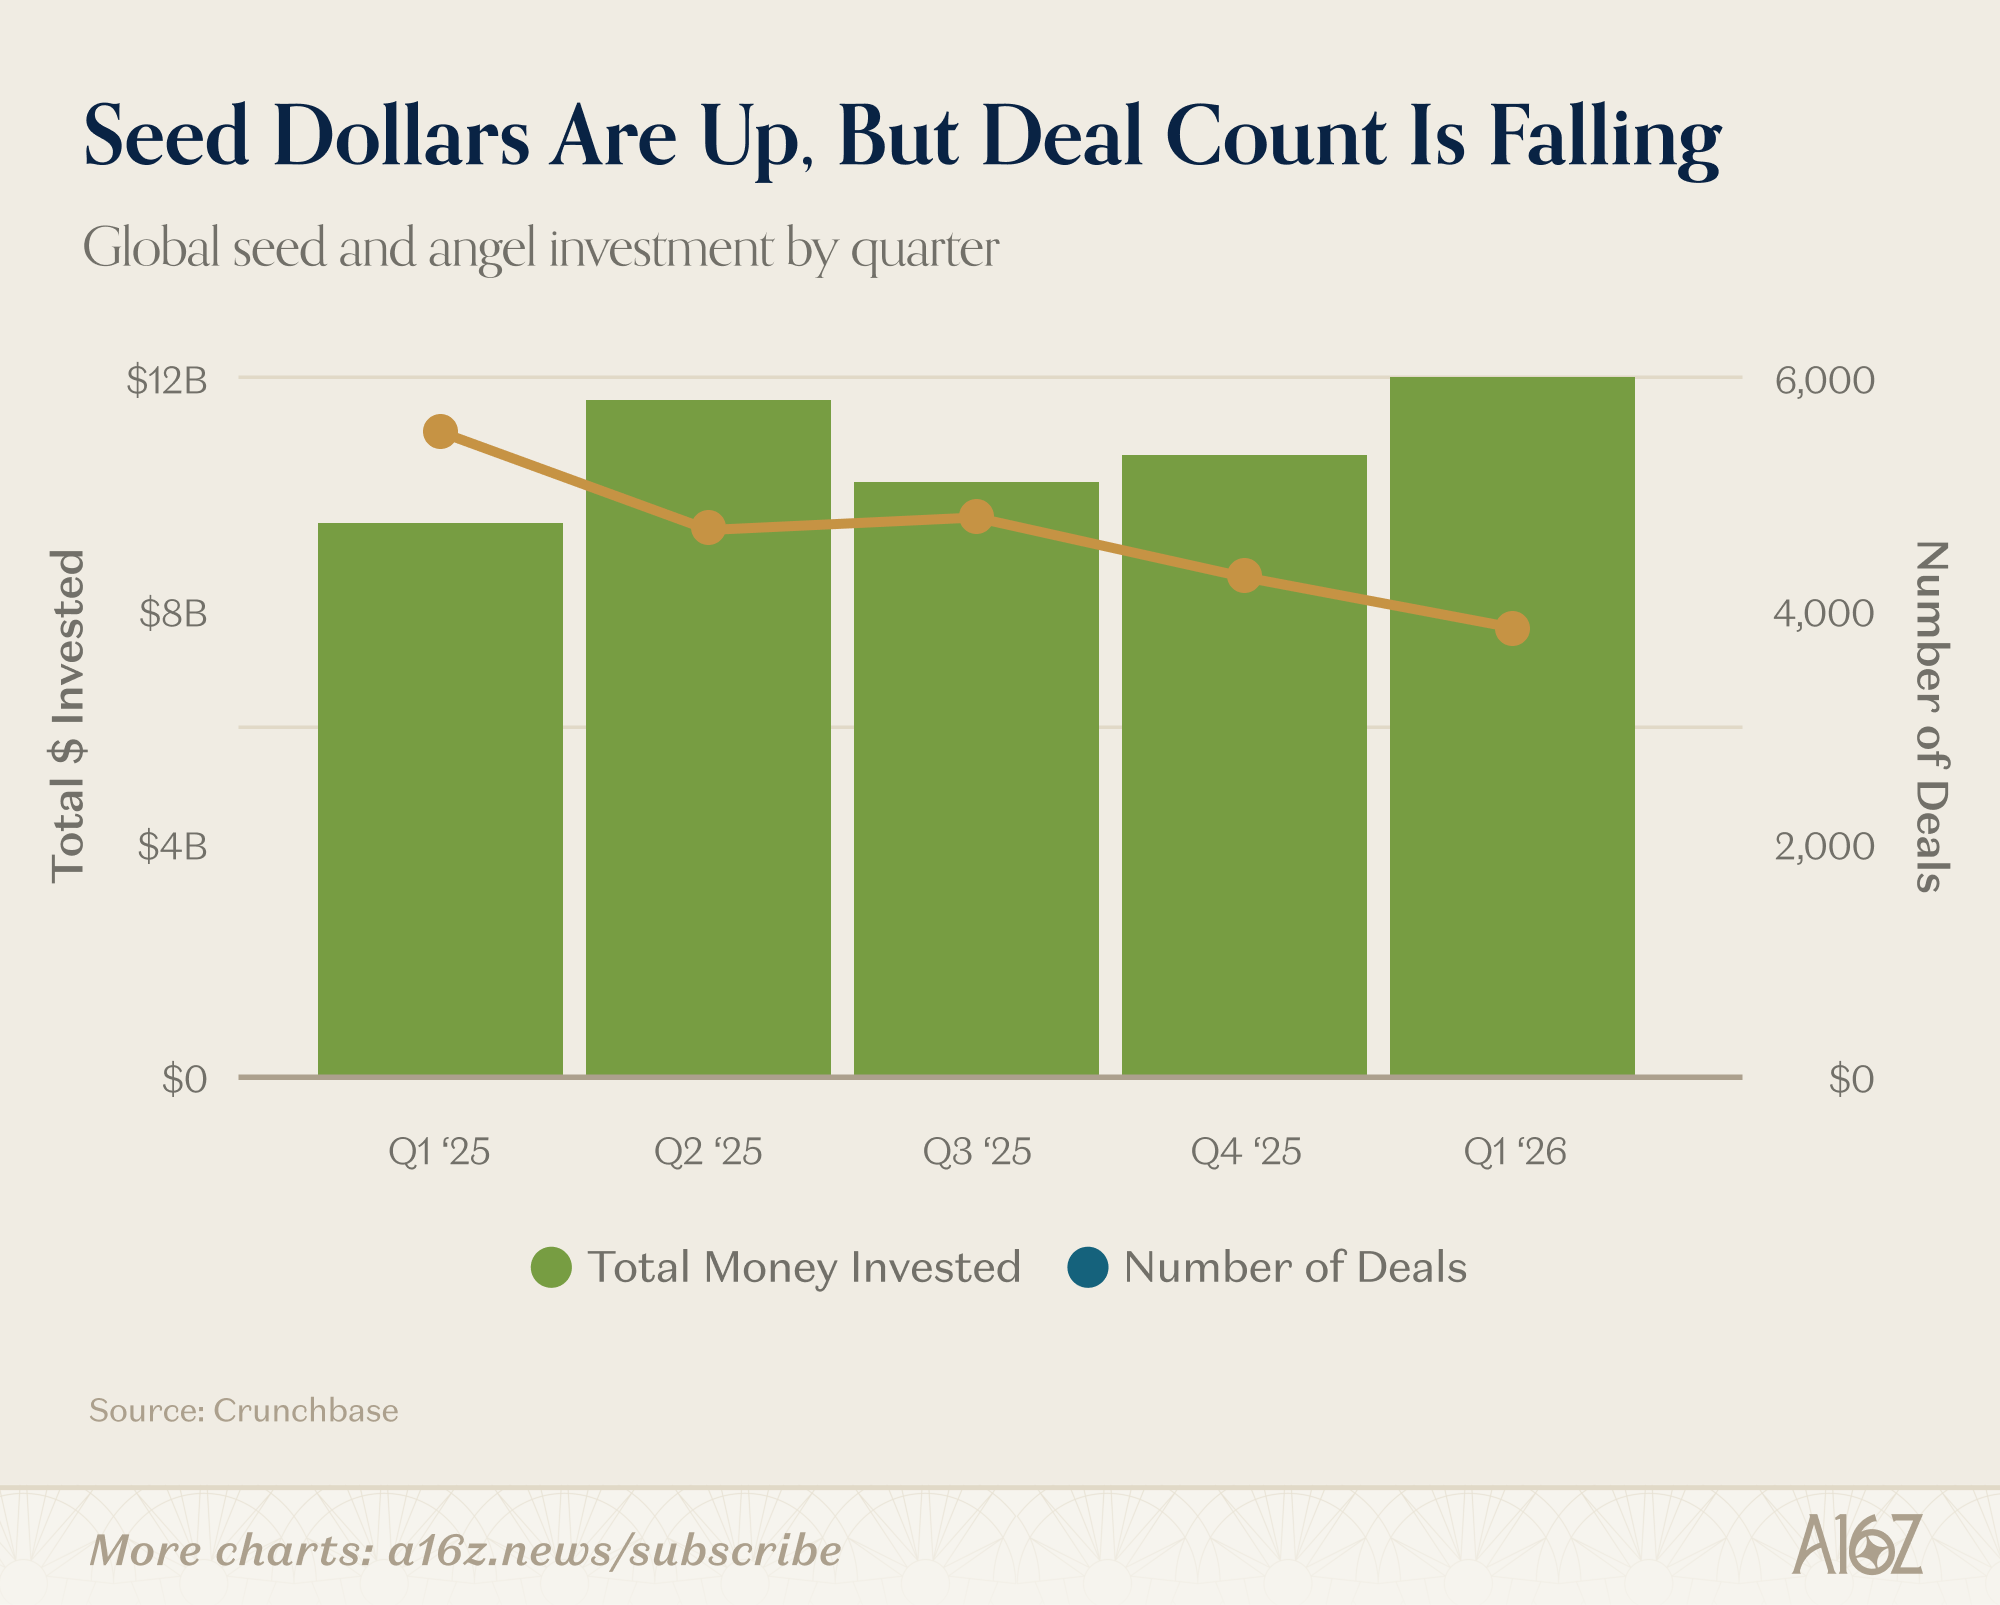
The seed data has an interesting tension though. While total dollar investment was up, deal count was down 30% from Q1 last year. We’re seeing fewer bets, with bigger checks.
One more thing worth flagging.
Beyond OpenAI, Anthropic, xAI, and Waymo, the billion-dollar cohort included companies building chips (Cerebras, Rapidus), robots (Skild AI), self-driving systems (Wayve), and defense platforms (Shield AI). That’s a meaningfully different shape than the last two tech cycles – cloud and mobile were built almost entirely in software.
This AI cycle has a physical layer that requires factories, fabs, and fleets – part of the broader rotation from bits to atoms that we’ve been tracking.
Construction’s Productivity Problem
Here’s a chart that should bother you. Since 1950, labor productivity across the US economy has roughly tripled. However, labor productivity in US construction has gone nowhere – it’s actually slightly below where it was 75 years ago.
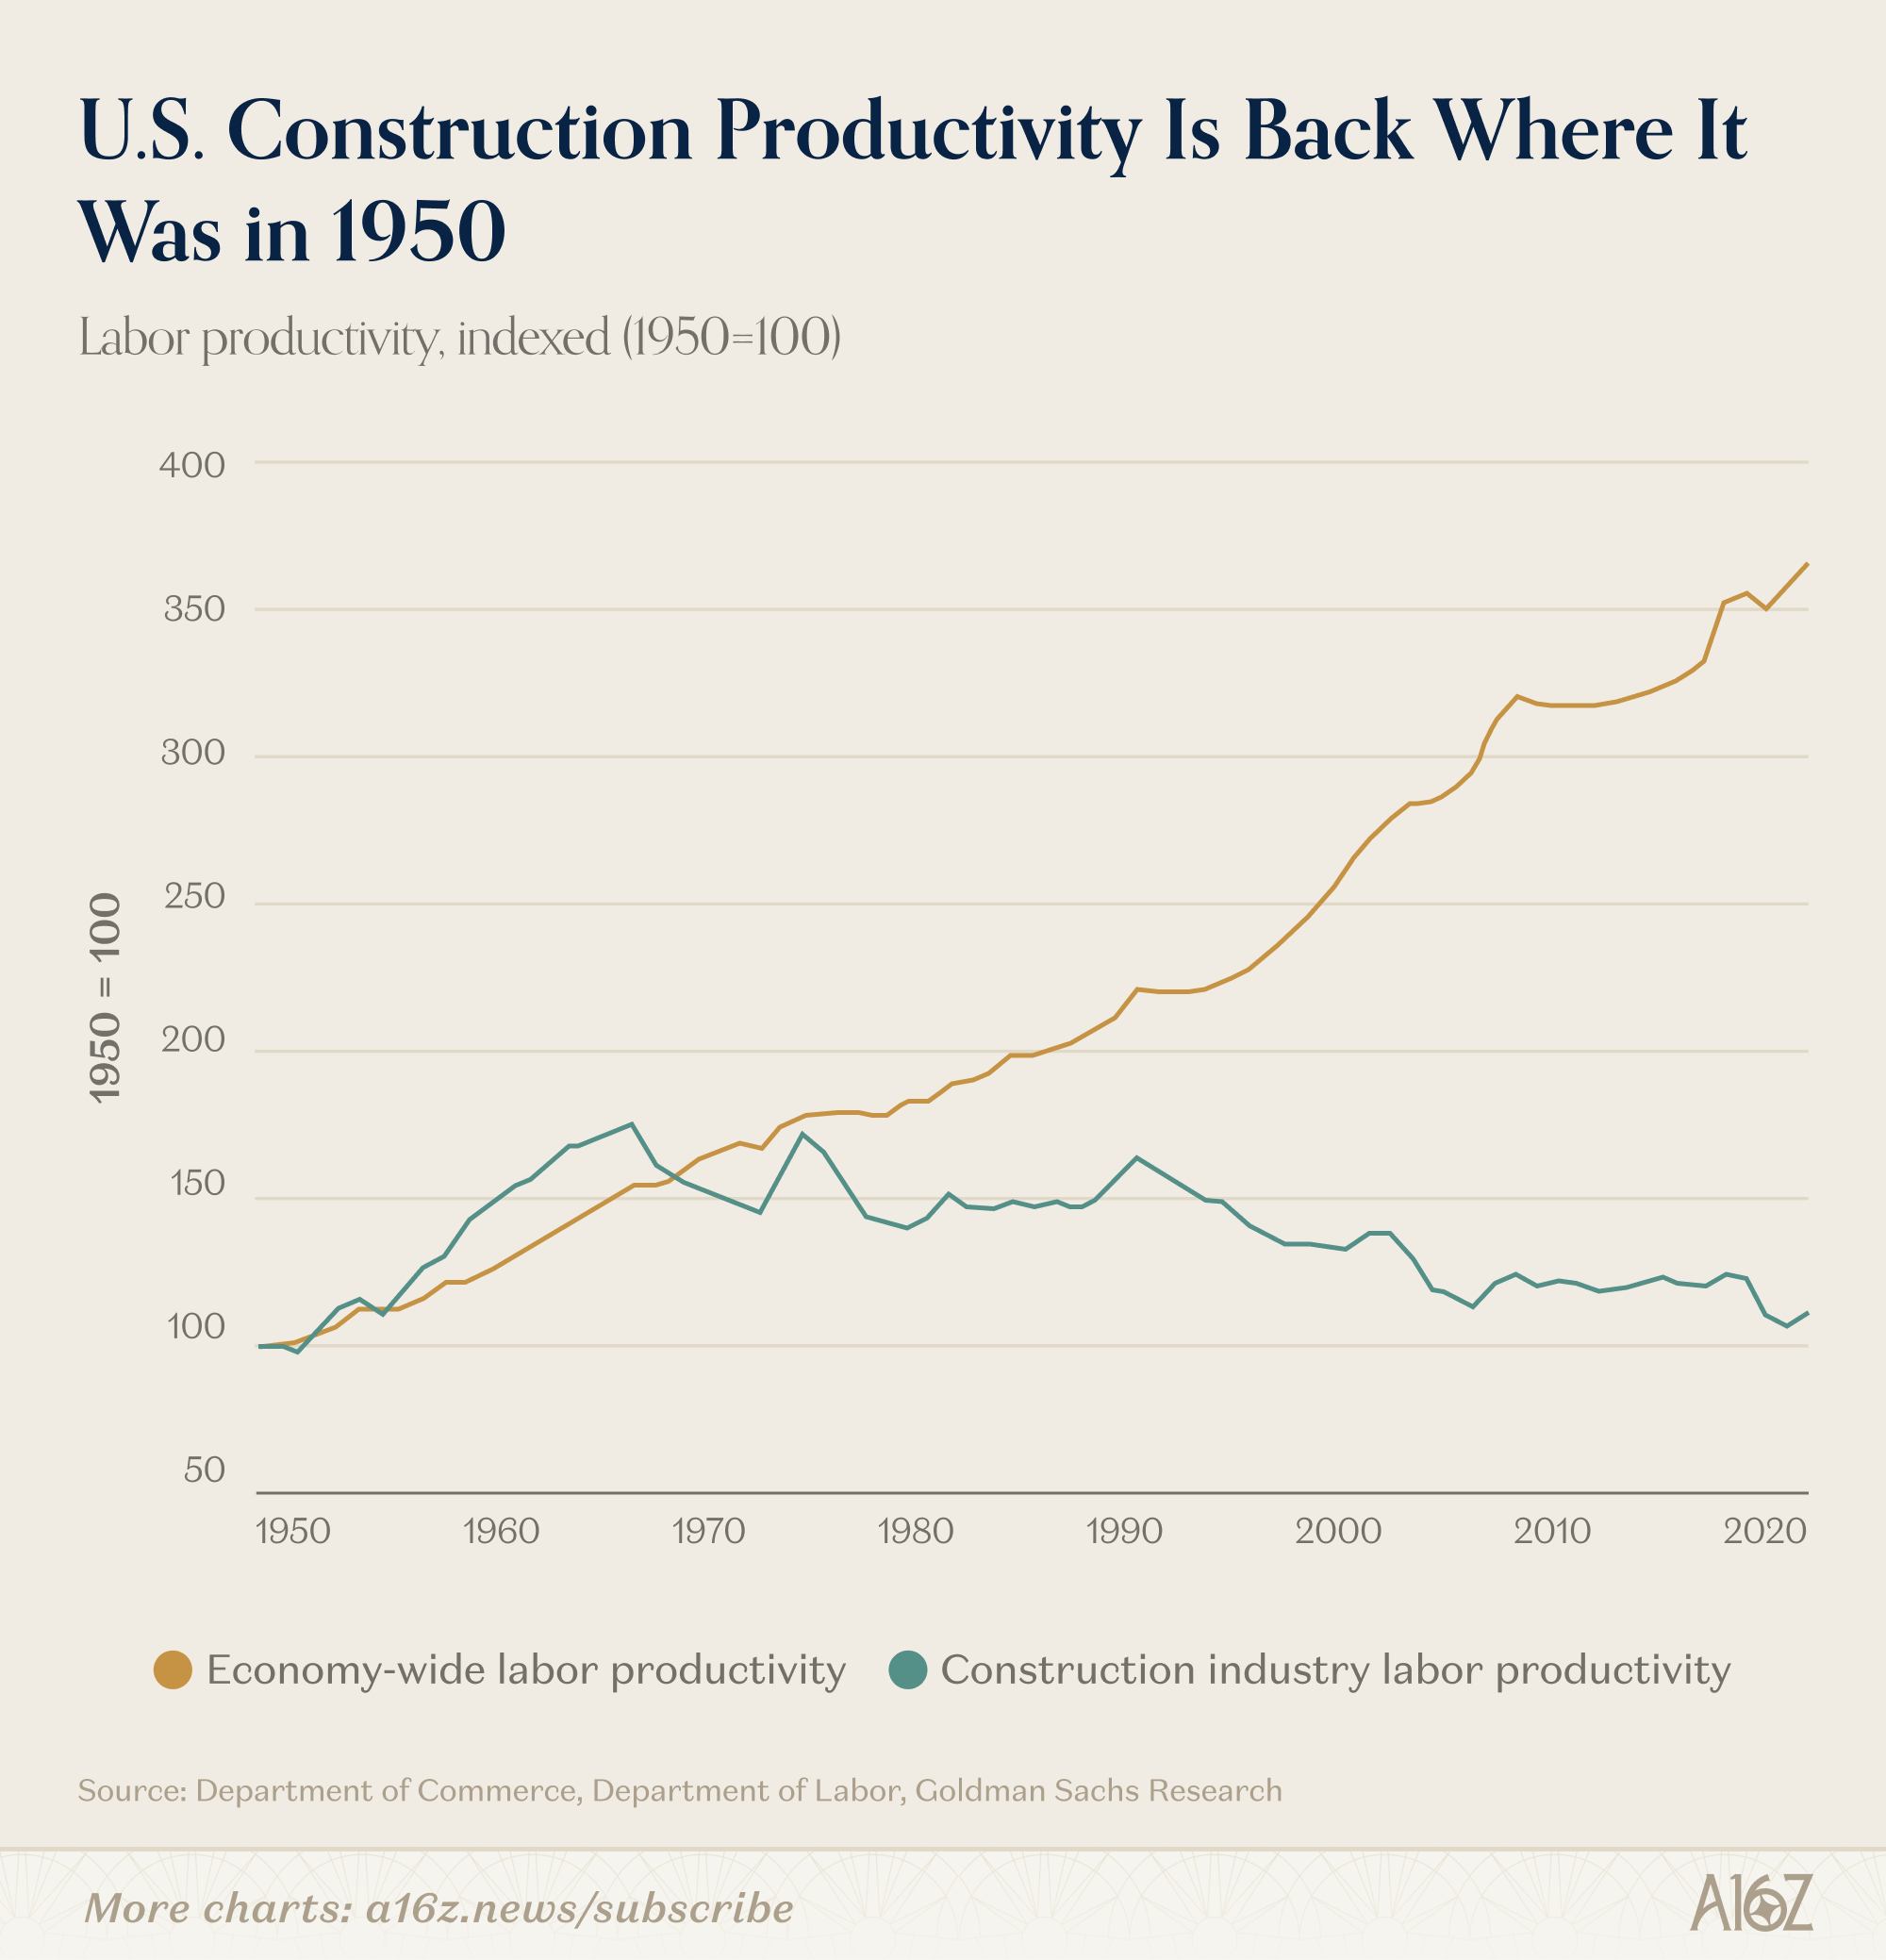
Goldman Sachs Research offers a few explanations. One is that construction basically stopped adopting new technology in the 1960s.
The share of industrial machines in total construction costs tripled from 4% to 12% between 1948 and 1968, then flatlined for the next half century.
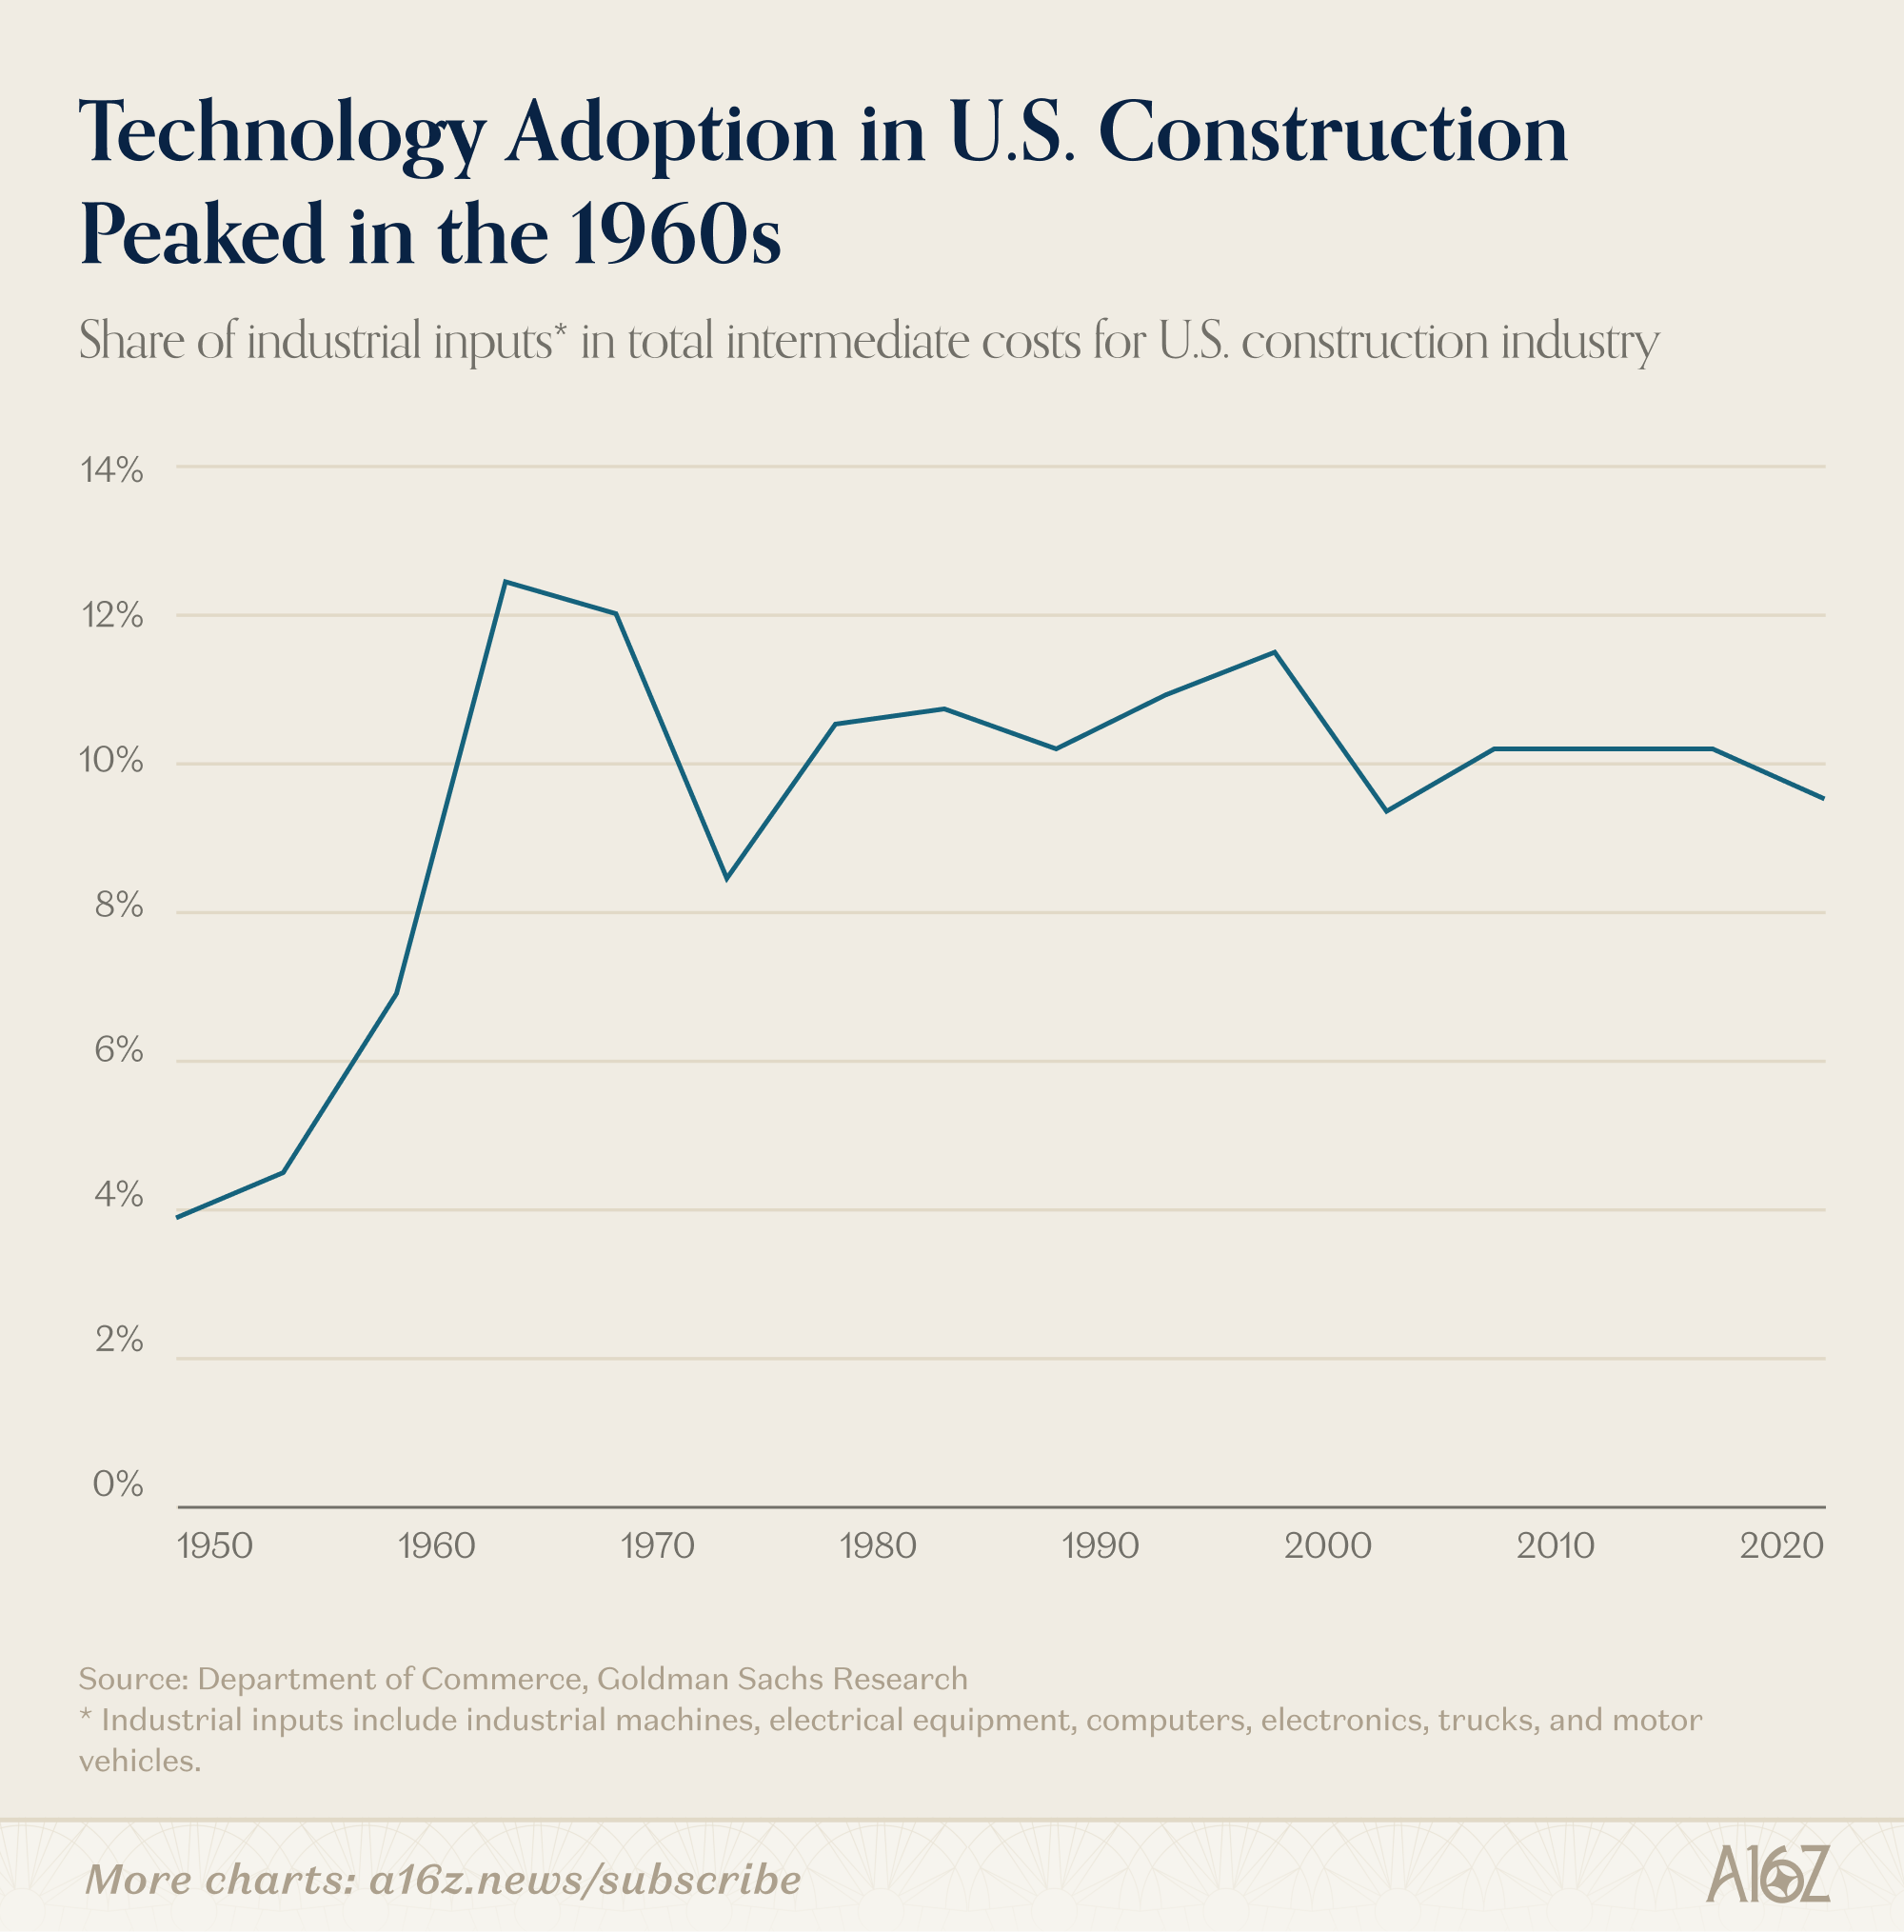
Most of the major machines used on job sites today – bulldozers, concrete mixers, cranes – have been available since the 1950s. And unlike pharma or professional services, construction hasn’t benefited much from spillover innovation in computing or communications.
Regulation is another factor. Goldman estimates that increased US land use regulation since the 1960s has reduced annual construction productivity growth by 0.7 percentage points.
But as Brian Potter has documented extensively in Construction Physics, the causes of construction’s productivity stagnation remain genuinely debated – industry fragmentation, the availability of cheap labor, lower-density building patterns, and even measurement challenges all likely play a role.
Whatever the mix of causes, construction is a $2 trillion industry that’s been waiting 60 years for its technology upgrade. That’s a major contributor to the housing affordability crisis – and one of the largest opportunities for robotics, prefabrication, and AI-driven construction tech to make a dent.
Summer Travel Is Getting More Expensive
Jet fuel prices have roughly doubled since February in the wake of the Strait of Hormuz disruptions:
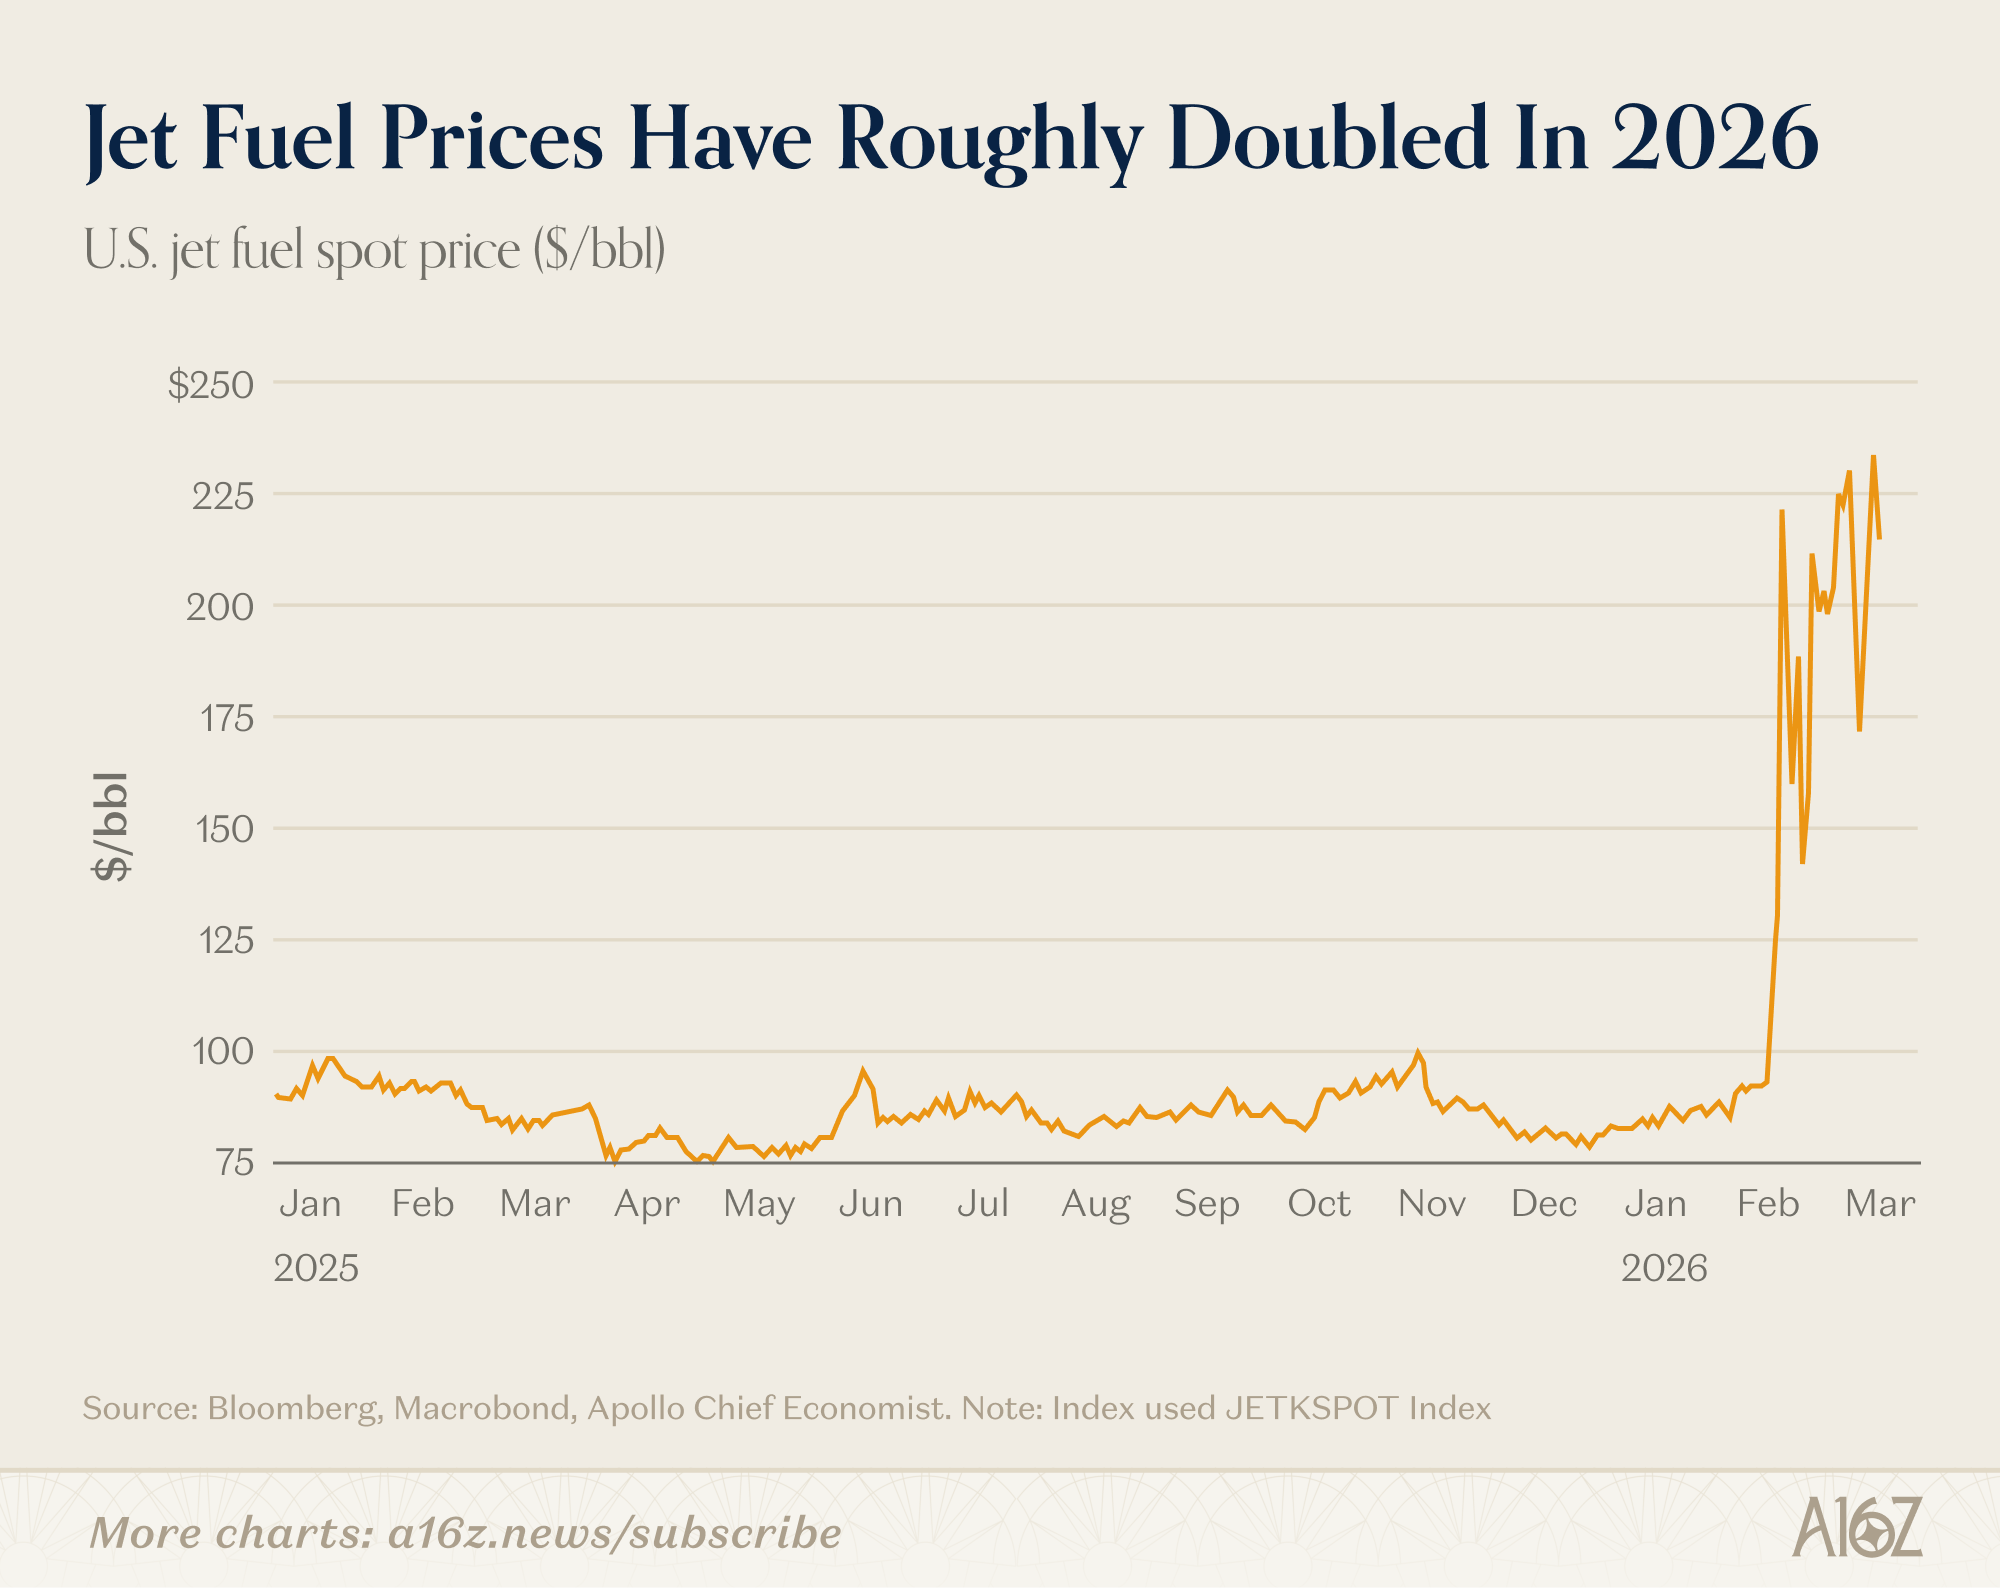
The damage is already showing up in airline stocks. Morgan Stanley cut earnings estimates across the sector and several airlines have begun raising bag fees and cutting capacity.
Per their annual filings, a one-cent increase in jet fuel per gallon costs American Airlines roughly $50 million annually, Delta about $40 million, and Southwest $22 million. Reuters estimates those three carriers plus United are looking at a combined $5.8 billion in additional fuel costs if prices remain at these elevated levels all year.
If history is any guide, airfares will follow. Analysis from Apollo’s Chief Economist Torsten Slok shows that US jet fuel prices have led airline fare CPI by about three months fairly consistently over the past 25+ years.
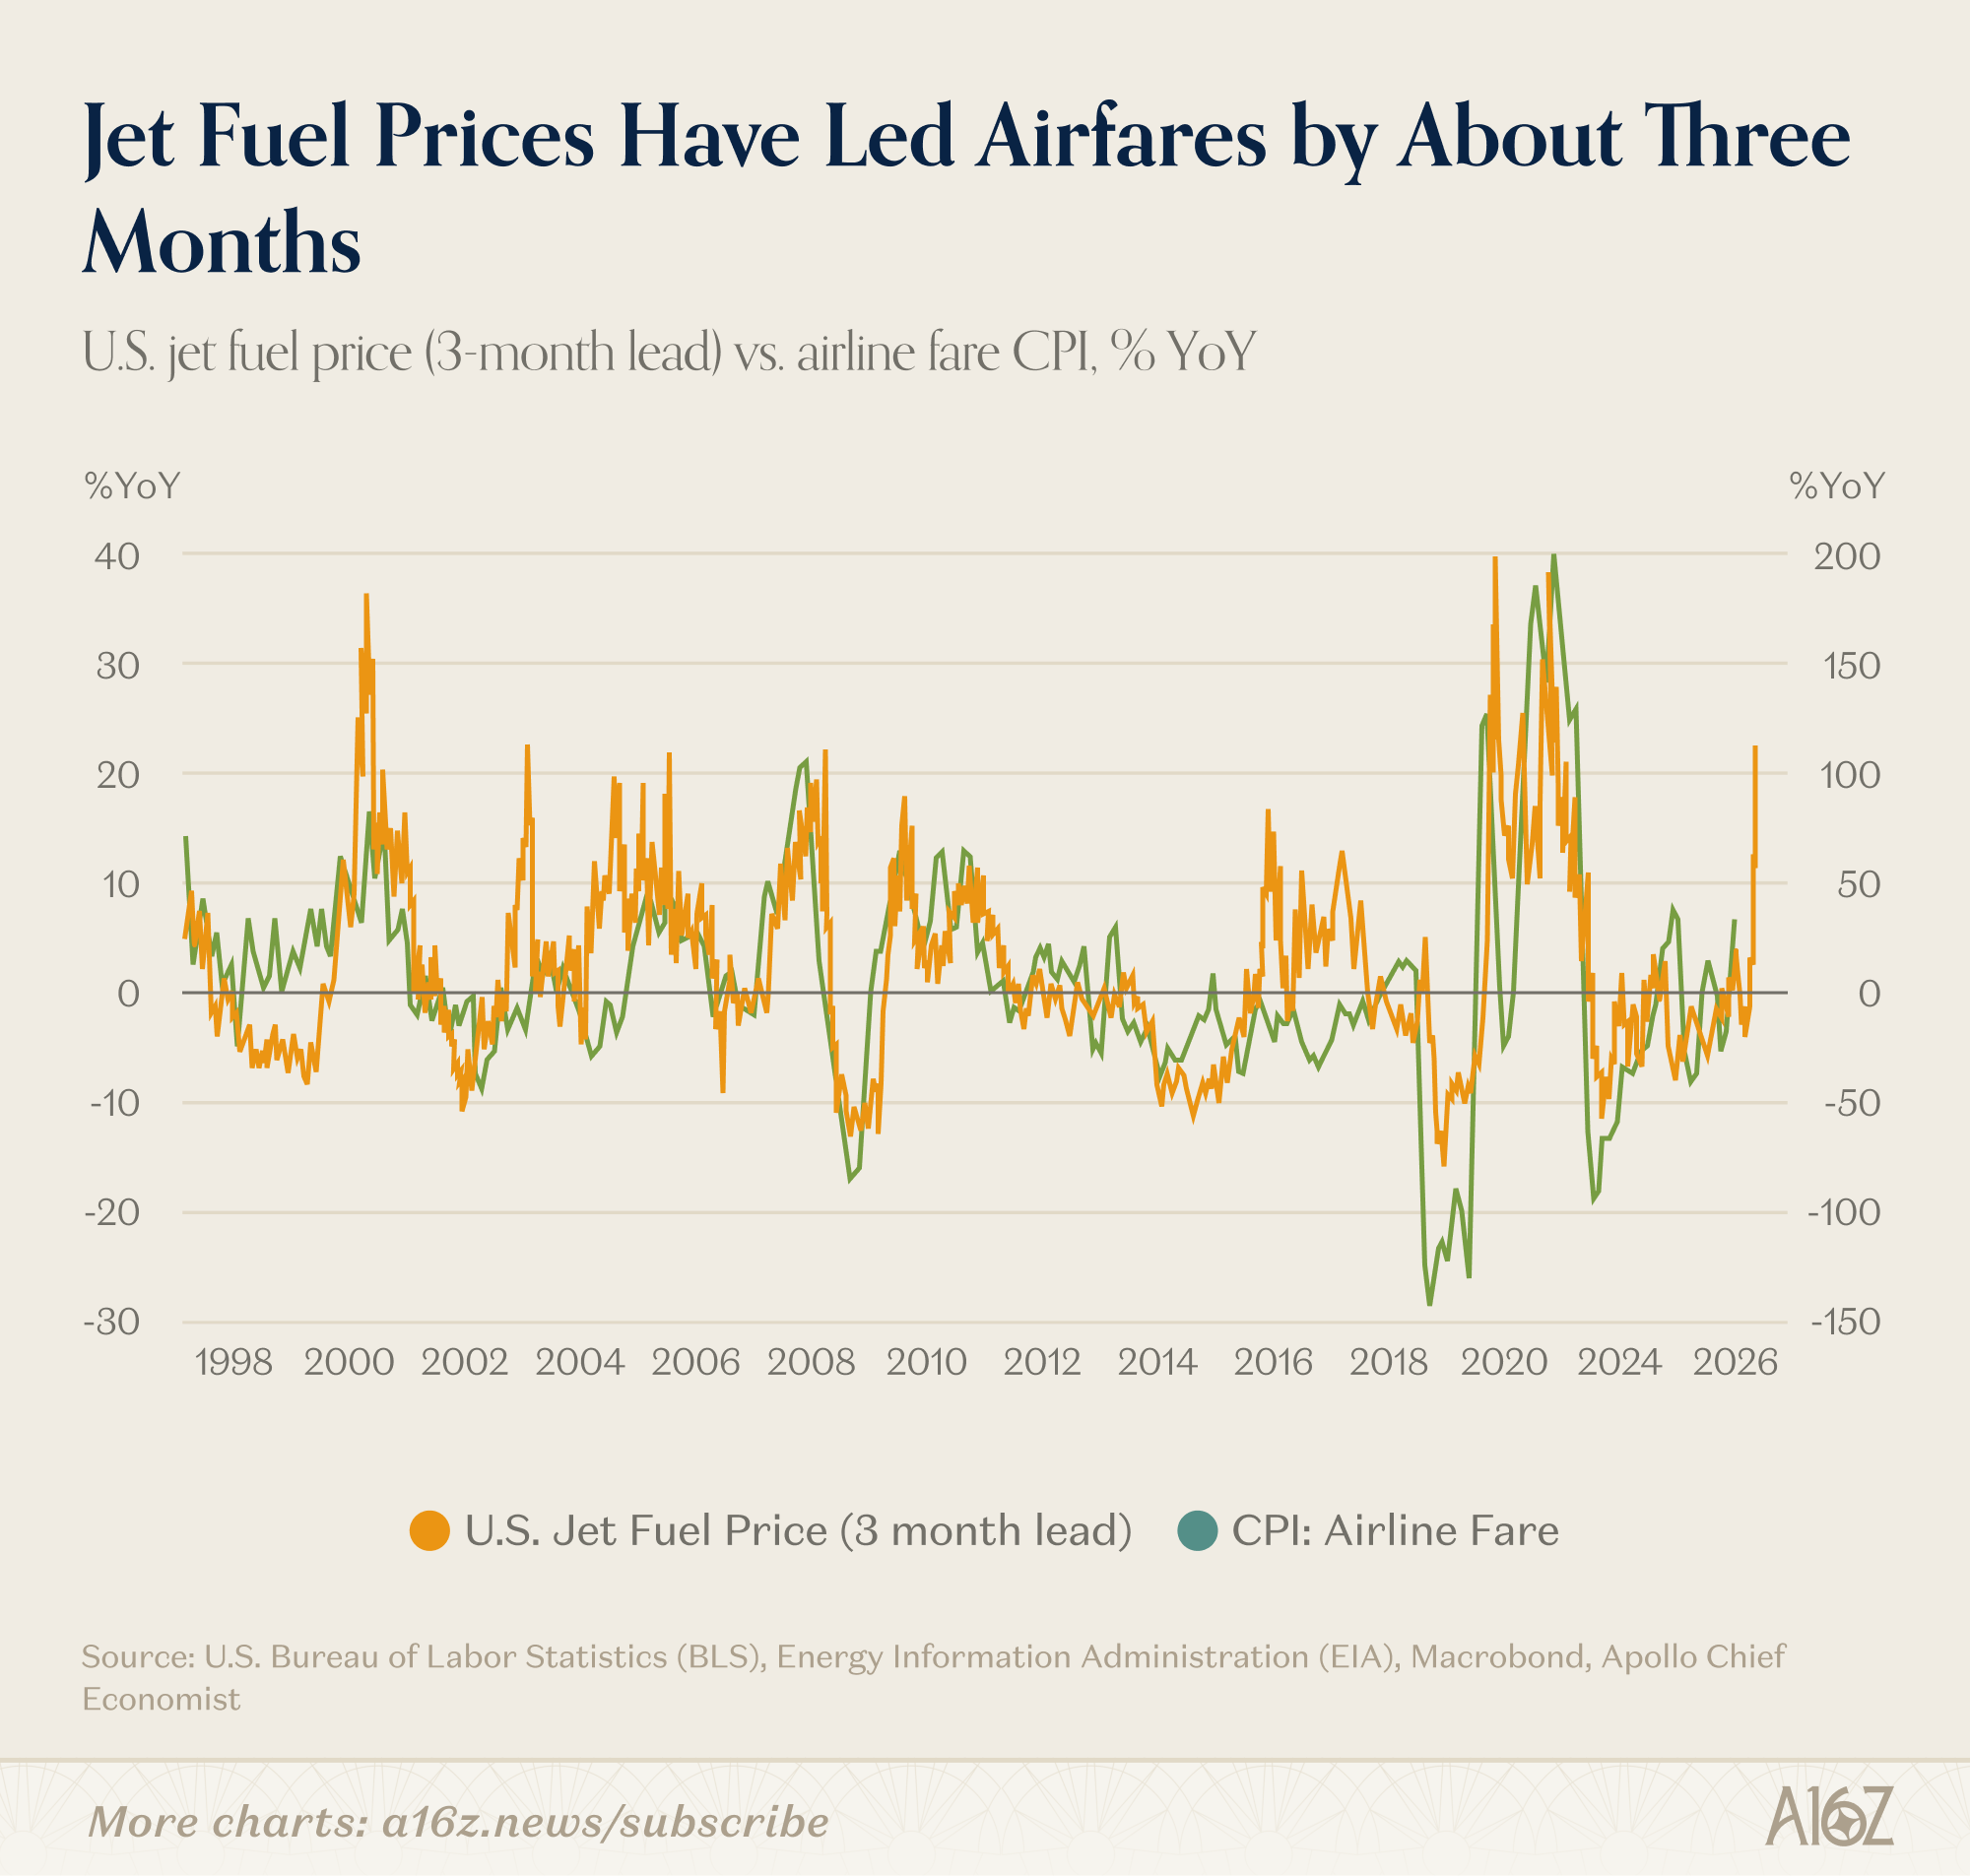
The current spike in jet fuel prices is among the sharpest in the data set. If the relationship holds and jet fuel prices don’t come down, airfare inflation could accelerate meaningfully by summer, right as travel demand hits its seasonal peak.
The Inference Buildout
There’s a common misconception that the AI infrastructure buildout is mostly about training – the expensive, one-time process of building foundation models. But McKinsey’s data center demand model tells a different story.
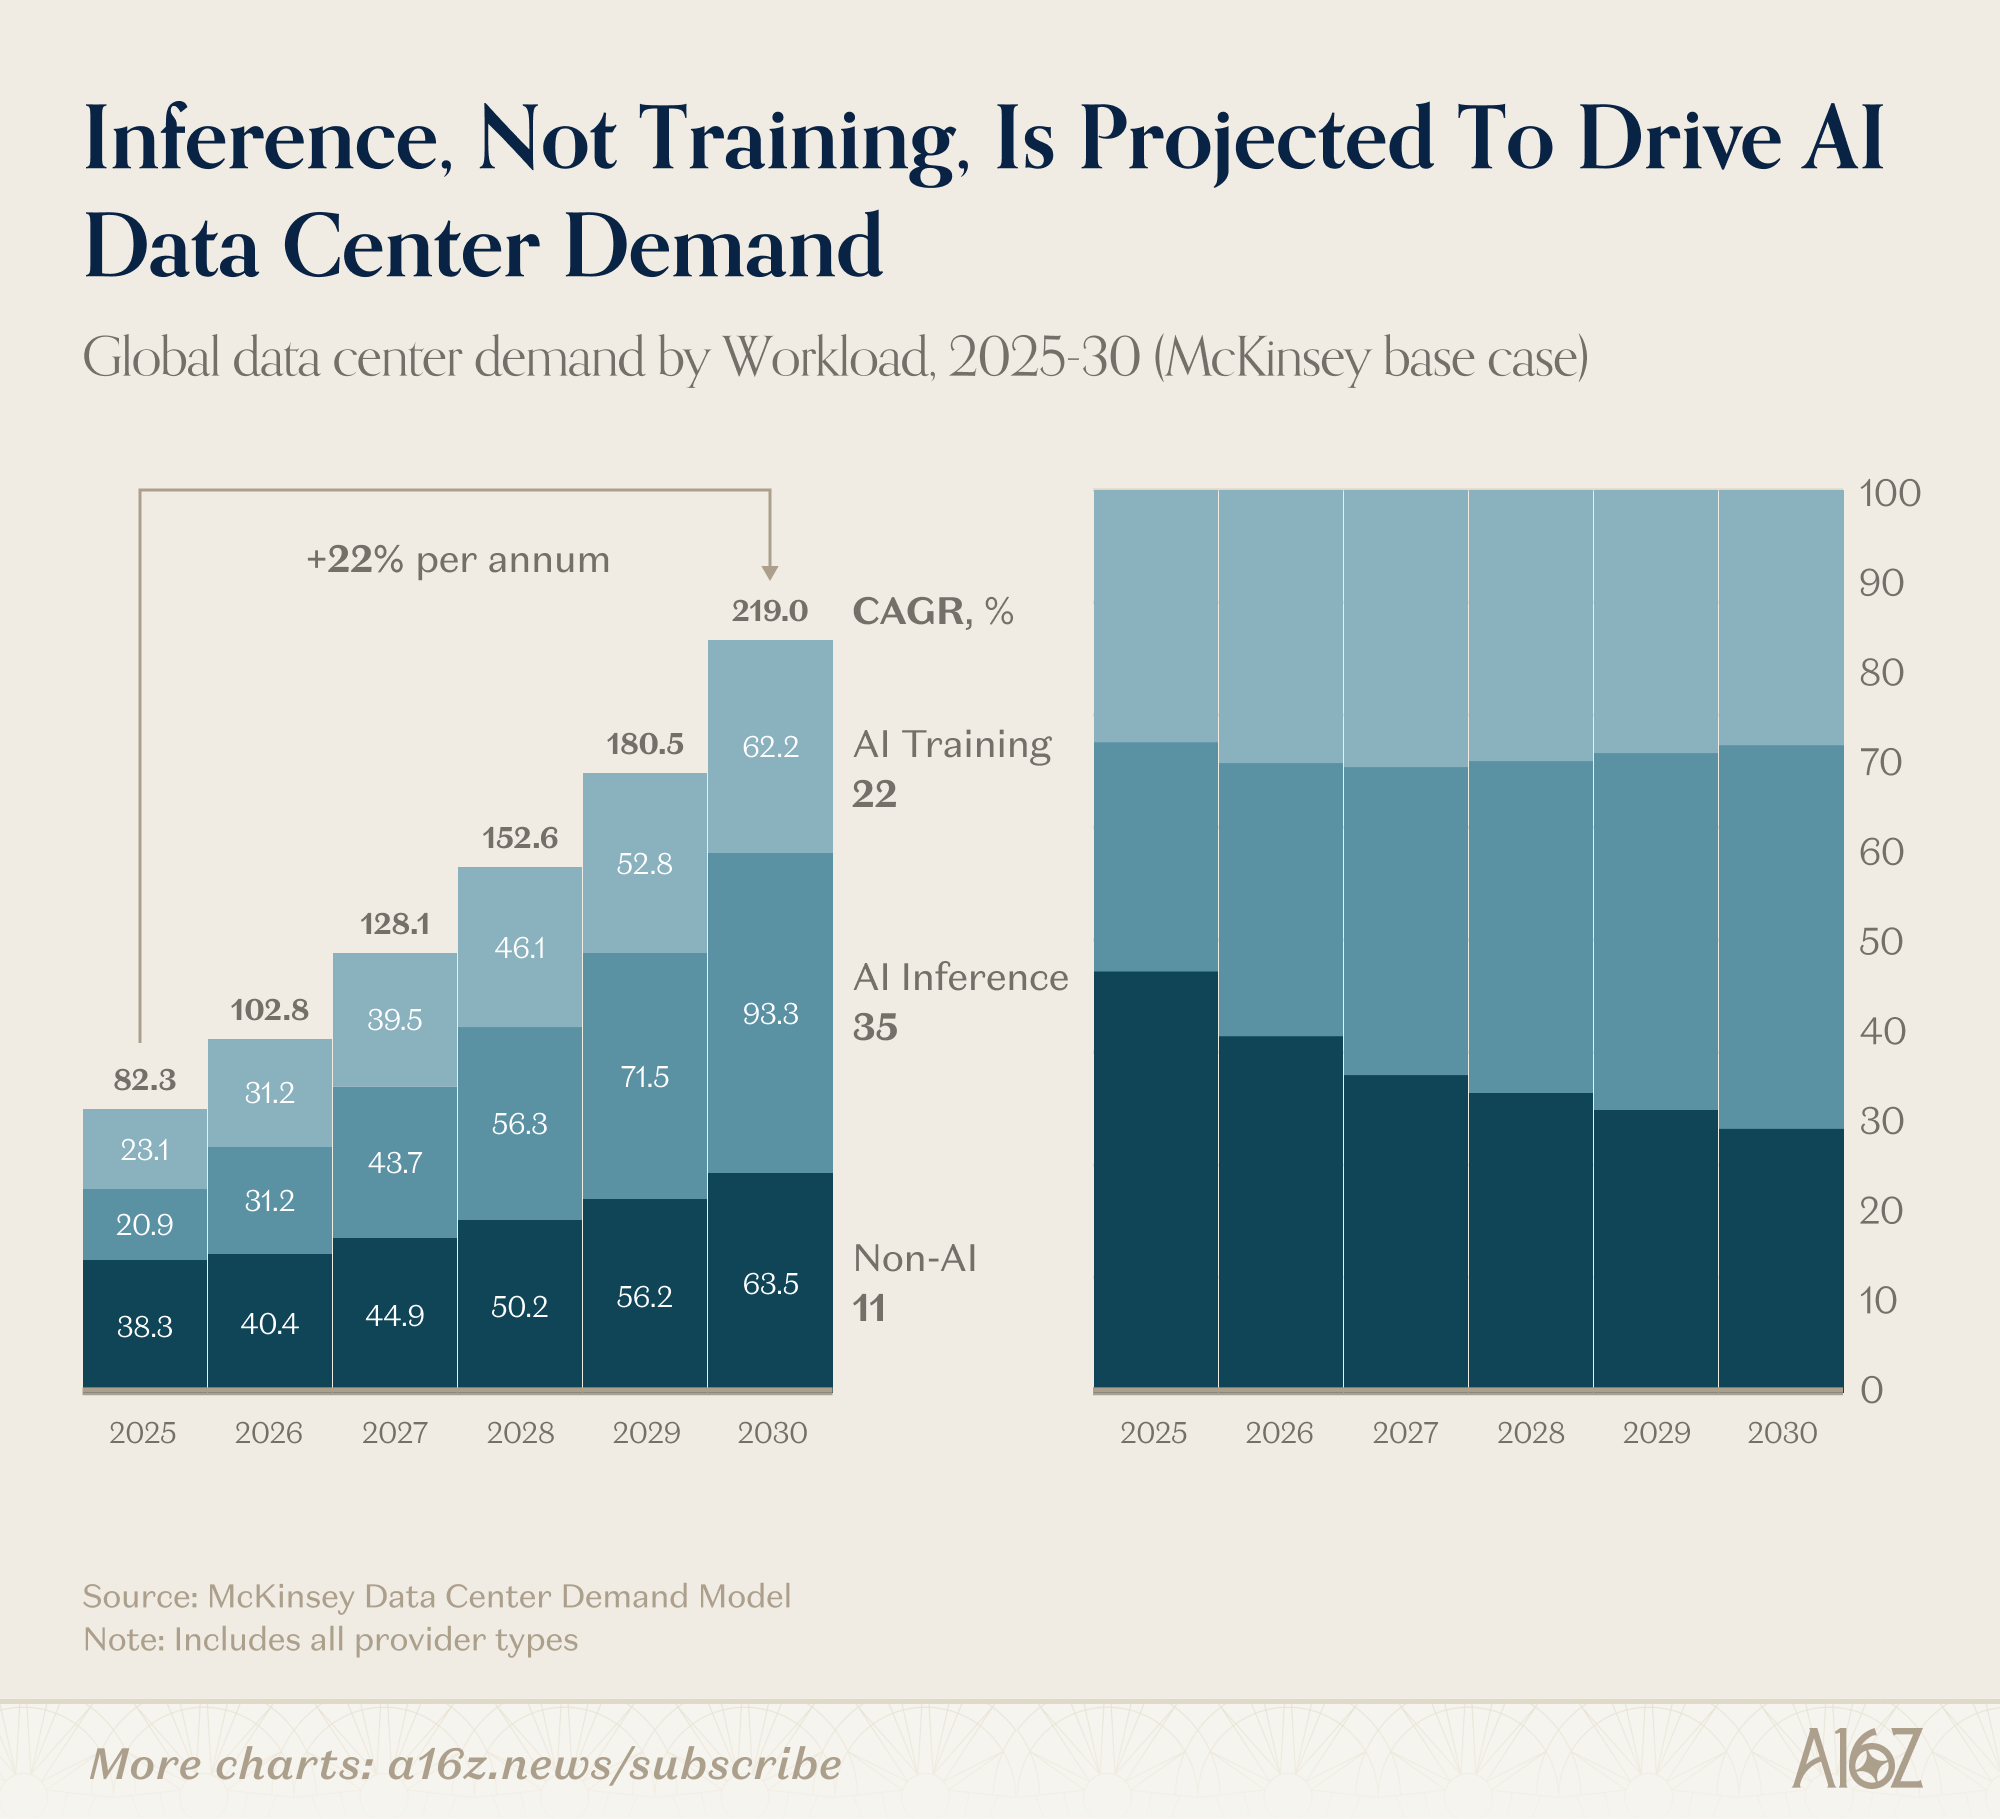
By 2030, AI inference – the process of actually running models for end users – is projected to surpass training as the dominant AI workload, representing over 40% of total data center demand and growing at a 35% CAGR.
Training grows too (22%), but inference is the workload that compounds with usage. Every chatbot response, code completion, agent action, etc. is an inference call.
As AI products spread to hundreds of millions of users, inference will be the dominant AI workload. And all of that compute will need chips.
McKinsey projects the global semiconductor market will roughly double from $775 billion to $1.6 trillion by 2030, with computing and data storage accounting for 55% of all industry growth – dwarfing every other vertical combined.
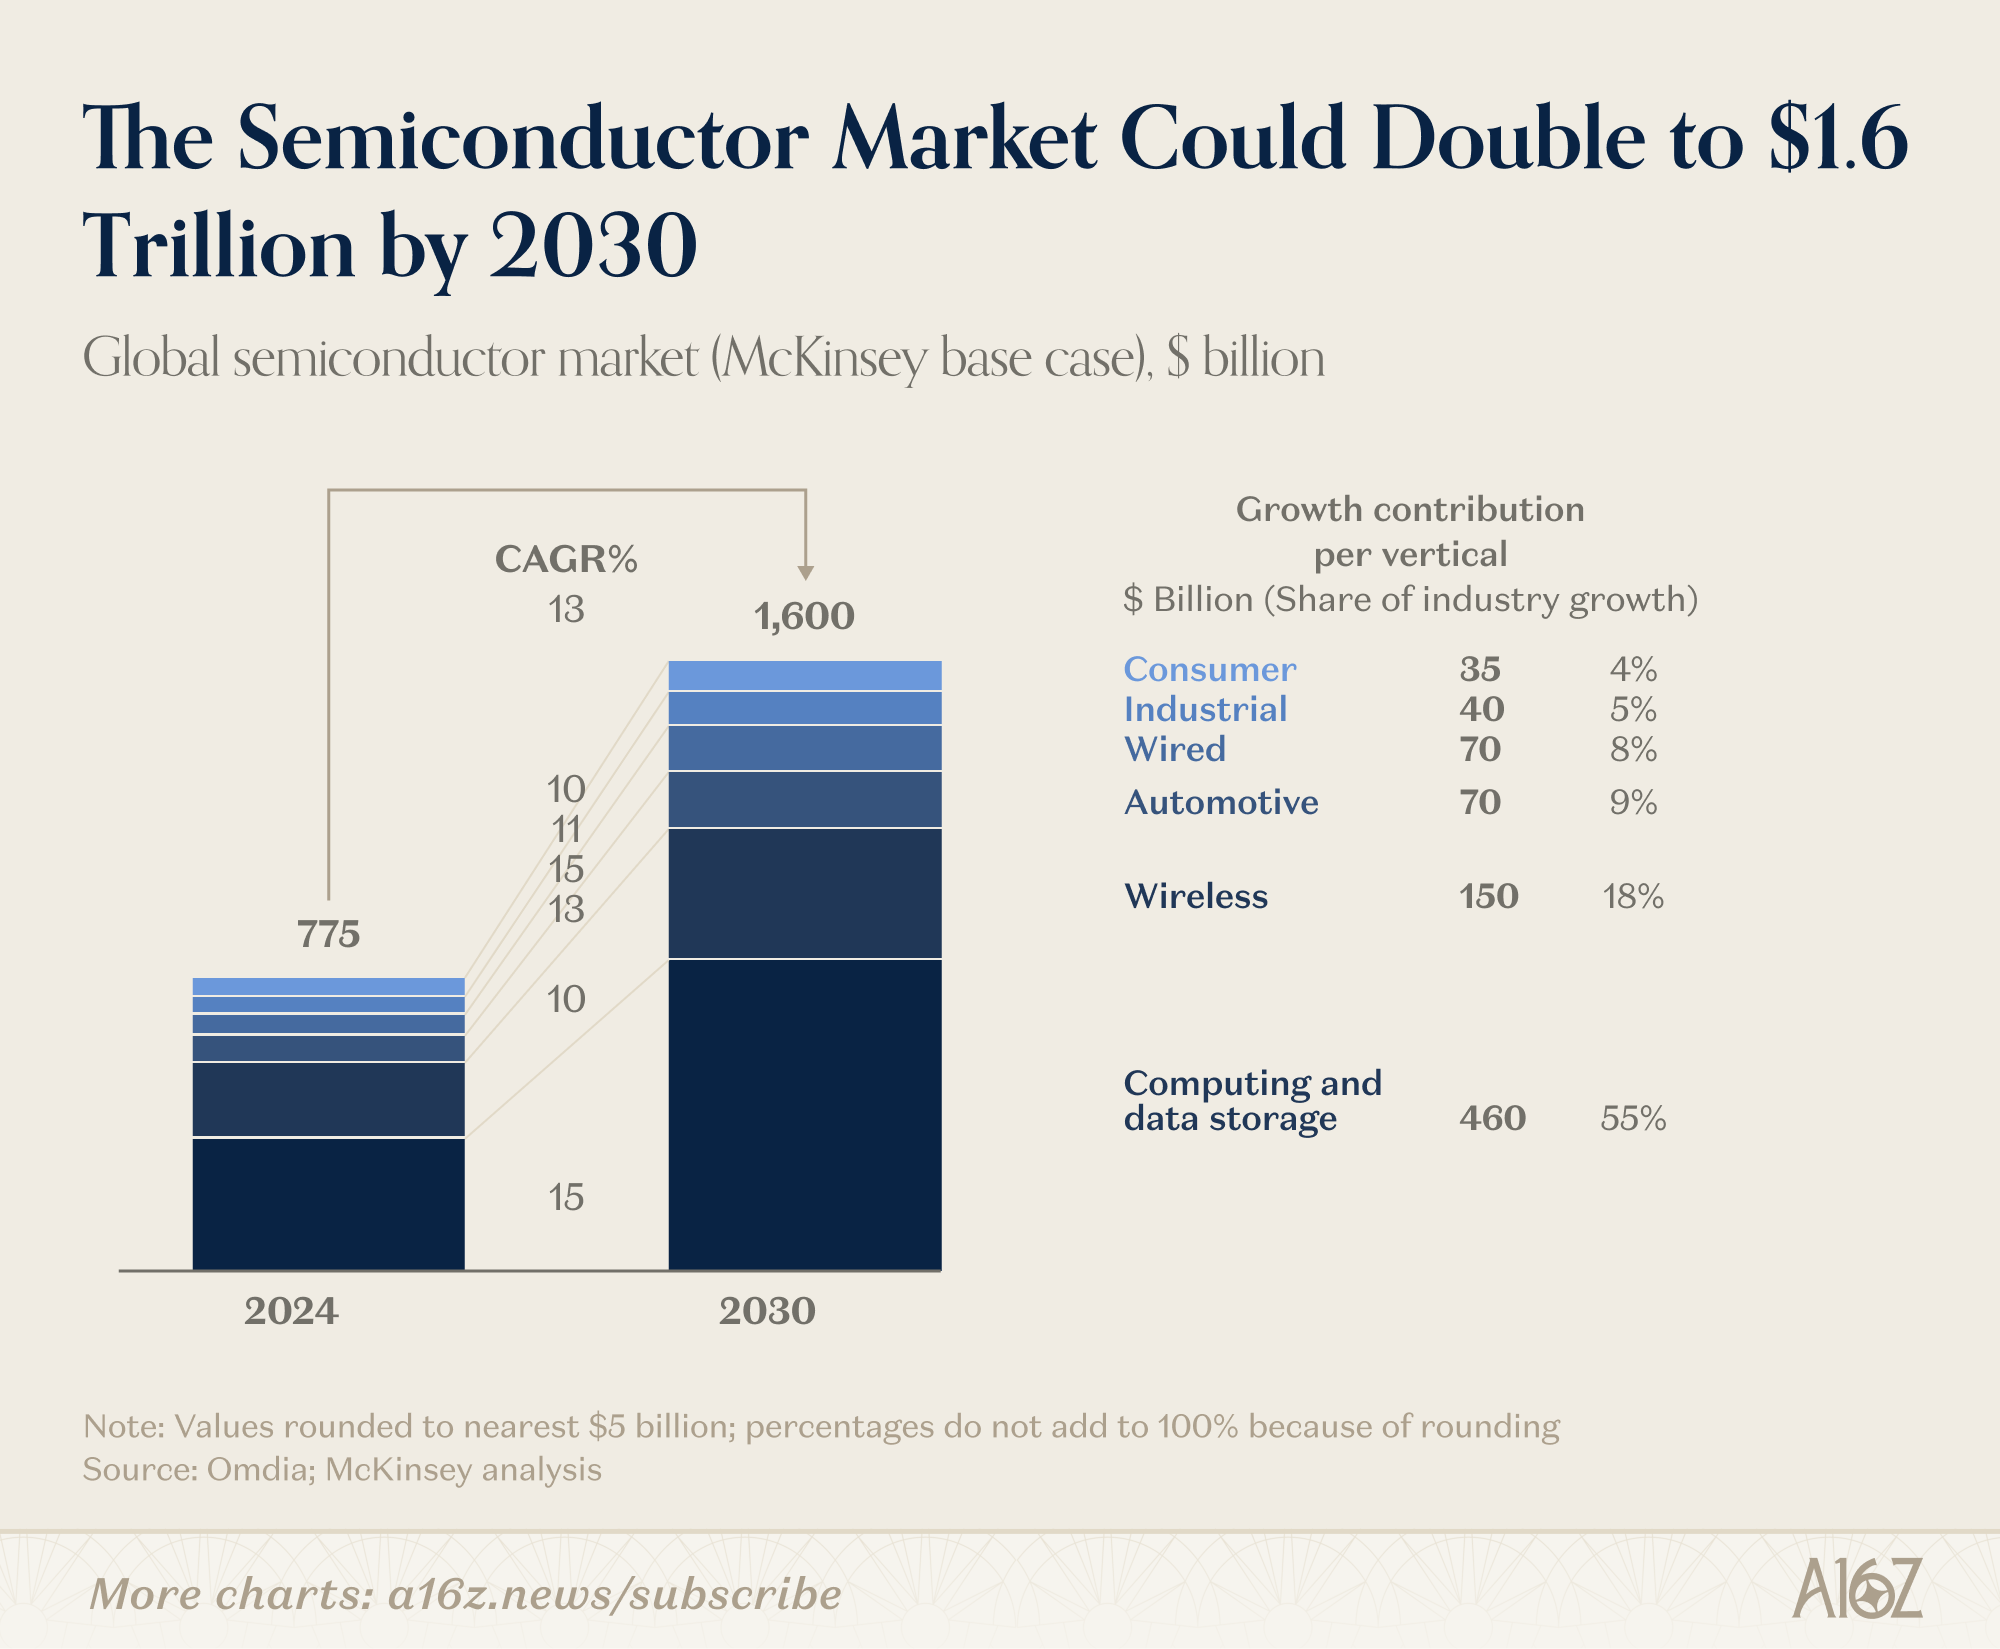
Most of that growth comes from inference, not training.
The AI buildout so far has been about making models smarter. The next phase is about building the infrastructure to run them for billions of users.
Strait of Hormuz Disruptions Threaten Global Fertilizer Supply
Conflict in the Middle East has created a bottleneck in one of the world’s most important – and least discussed – commodity supply chains.
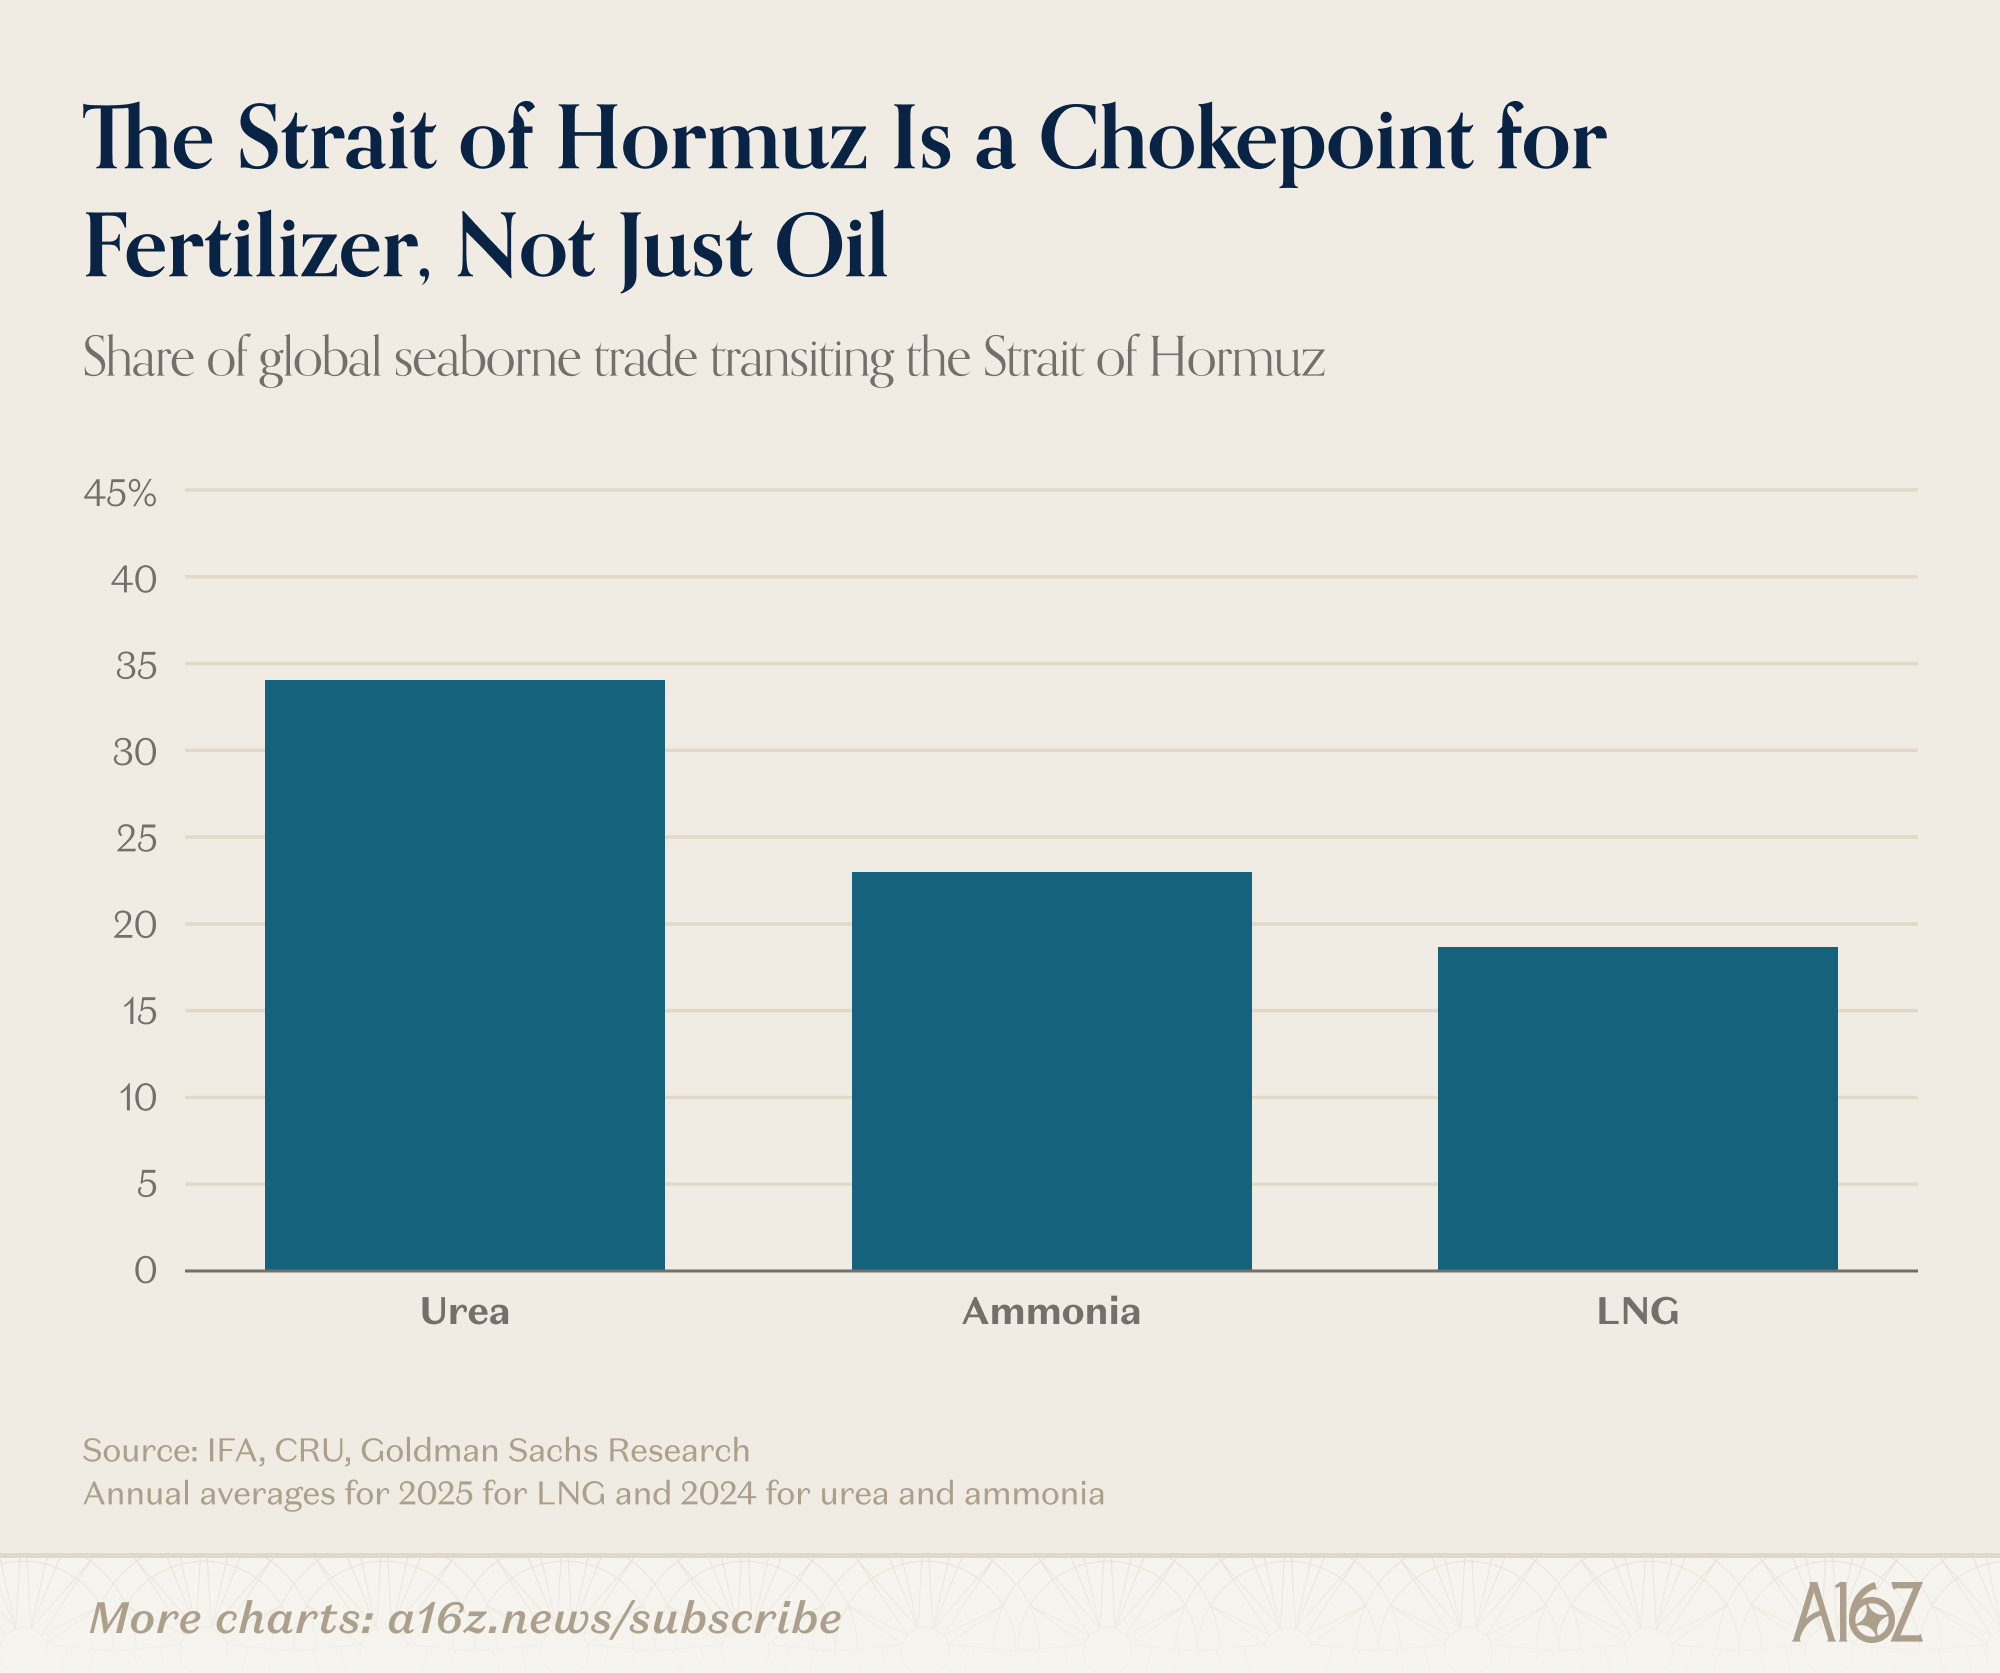
More than a quarter of global nitrogen fertilizer (i.e. urea, ammonia) and ~20% of LNG (the key feedstock for nitrogen production) transit the Strait of Hormuz.
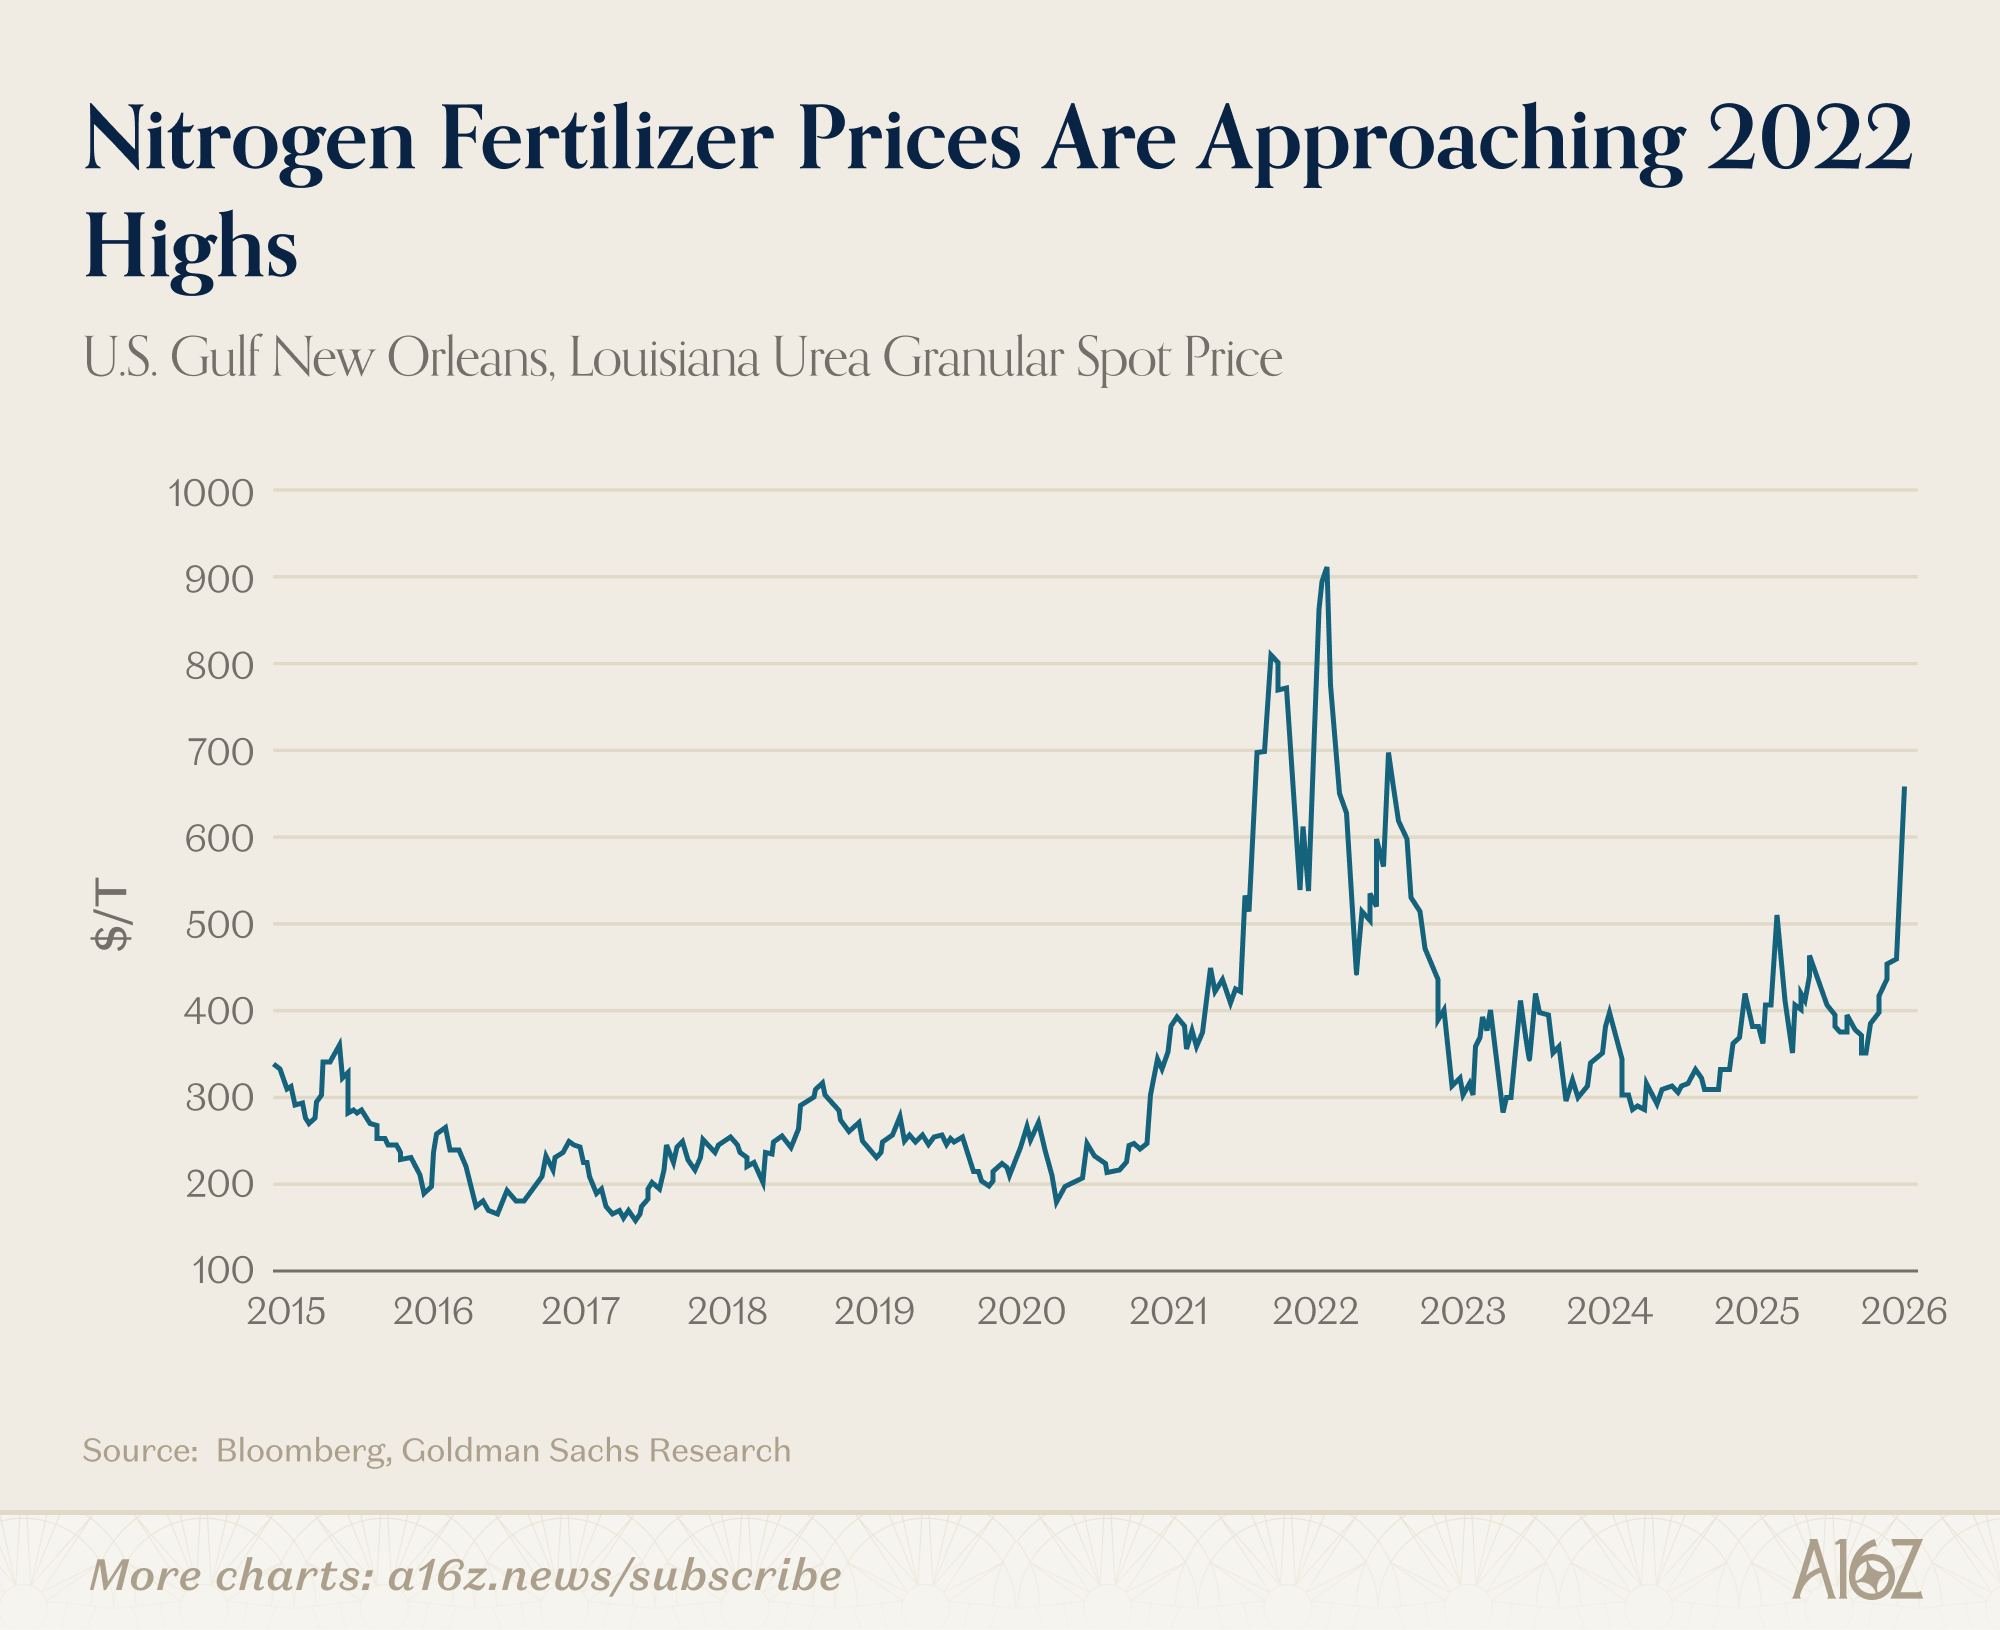
Shipping disruptions are already pushing fertilizer costs sharply higher. Urea spot prices are approaching 2022 highs.
Nitrogen accounts for roughly 60% of global fertilizer use, and fertilizer accounts for about 20% of grain production costs.
When nitrogen gets expensive or hard to source, yields fall because farmers can’t apply fertilizer at the right time. Acreage also shifts away from nitrogen-intensive crops like corn and wheat toward alternatives like soybeans, further reducing grain supply.
Most US farmers likely locked in their fertilizer needs before the conflict escalated. But March disruptions could be felt in April, and the US has no strategic fertilizer reserve. China is largely self-sufficient in fertilizer production (it uses coal rather than LNG as its nitrogen feedstock) but has restricted exports to protect its domestic market.
Europe, Australia, and the Southern Hemisphere – where crop calendars are later and domestic fertilizer production is more dependent on LNG pricing – are more exposed. If these regions can’t get enough fertilizer, they’ll look to import more grain from the US instead, pushing up American agriculture prices even if domestic supply holds.
It’s a useful reminder that geopolitical risk doesn’t always show up where you’d expect. Everyone watches oil prices when the Strait of Hormuz is in the headlines, but the food supply chain may be the more consequential second-order effect.


This newsletter is provided for informational purposes only, and should not be relied upon as legal, business, investment, or tax advice. Furthermore, this content is not investment advice, nor is it intended for use by any investors or prospective investors in any a16z funds. This newsletter may link to other websites or contain other information obtained from third-party sources - a16z has not independently verified nor makes any representations about the current or enduring accuracy of such information. If this content includes third-party advertisements, a16z has not reviewed such advertisements and does not endorse any advertising content or related companies contained therein. Any investments or portfolio companies mentioned, referred to, or described are not representative of all investments in vehicles managed by a16z; visit https://a16z.com/investment-list/ for a full list of investments. Other important information can be found at a16z.com/disclosures. You’re receiving this newsletter since you opted in earlier; if you would like to opt out of future newsletters you may unsubscribe immediately.
To me the seed data is the most interesting signal here.
Dollars up but deal count down 30%... that's not just "bigger checks," that's a fundamental shift in how early-stage risk gets priced.
When seed rounds start getting bigger than what Series A's used to be, it raises the question of who's funding the truly experimental stuff now.
Are we seeing the emergence of a pre-seed gap where the weirdest, most contrarian ideas struggle to get off the ground?
Capital efficiency is the new North Star. Reaching TRL 4 on a bio-adaptive OS with zero-latency hardware integration is how we turn that $300B into the next industrial revolution. C.E.B. Systems is executing exactly that. Deep Tech isn't about the money you spend, but the complexity you solve. Hardware is ready. Kernel is live. Symbiosis is next.