



America | Tech | Opinion | Culture | Charts

Renting an apartment is a strange transaction. It is the biggest bill most renter households pay each month. Yet the deal itself gets struck in a hurry: a couple of weeks of searching, a tour squeezed into a lunch break, an application that wants your pay stubs, your credit score, and possibly a guarantor. Housing is one of the only major purchases where the product screens you back. For rent, about 46 million American households (35% of the country) do this dance, per the Census Bureau.
Welcome to the latest edition of our chartpost series, where we use one company’s data to light up a corner of the economy. This time the corner is literally nationwide: the US rental market, seen through EliseAI, which builds the AI agents that automate communication and operational workflows for apartment buildings. When you text a building “is the one-bedroom still available?” at 11:48pm and someone helpful writes back immediately, that is likely Elise.
Here is why that vantage point matters right now. Census data shows that measured from the supply side, the rental market finally looked like it would see some relief. Builders completed more than 600,000 apartments in 2024, the most in a single year since 1986, and kept a heavy pace through 2025. Vacancy sat at record highs. National rents have been flat to slightly falling for three straight years. Balance, at last.
But that progress is occurring against a backdrop of a much larger structural shortage. Estimates still place the national apartment deficit at 5 million apartment units. Half of all renters remain cost-burdened, meaning they spend more than 30% of their income on housing. New supply matters, but it has not yet translated into broad affordability for renters.
To understand how that tension plays out in the apartment search itself, we need a view beyond supply, vacancy, and rent levels. For the first time at this scale, we can now examine the demand side through data generated by real renter interactions. EliseAI handles millions of conversations with prospective and current renters each year, throughout the country and at every hour of the day. The analysis that follows draws on aggregate data from those conversations to identify patterns in what renters say, what they do, and how their behavior is changing with AI.
Classify every opening message renters send and you can measure the share that leads with money: the rent, the fees, “any specials?” Call it the rent-anxiety index. It is climbing.
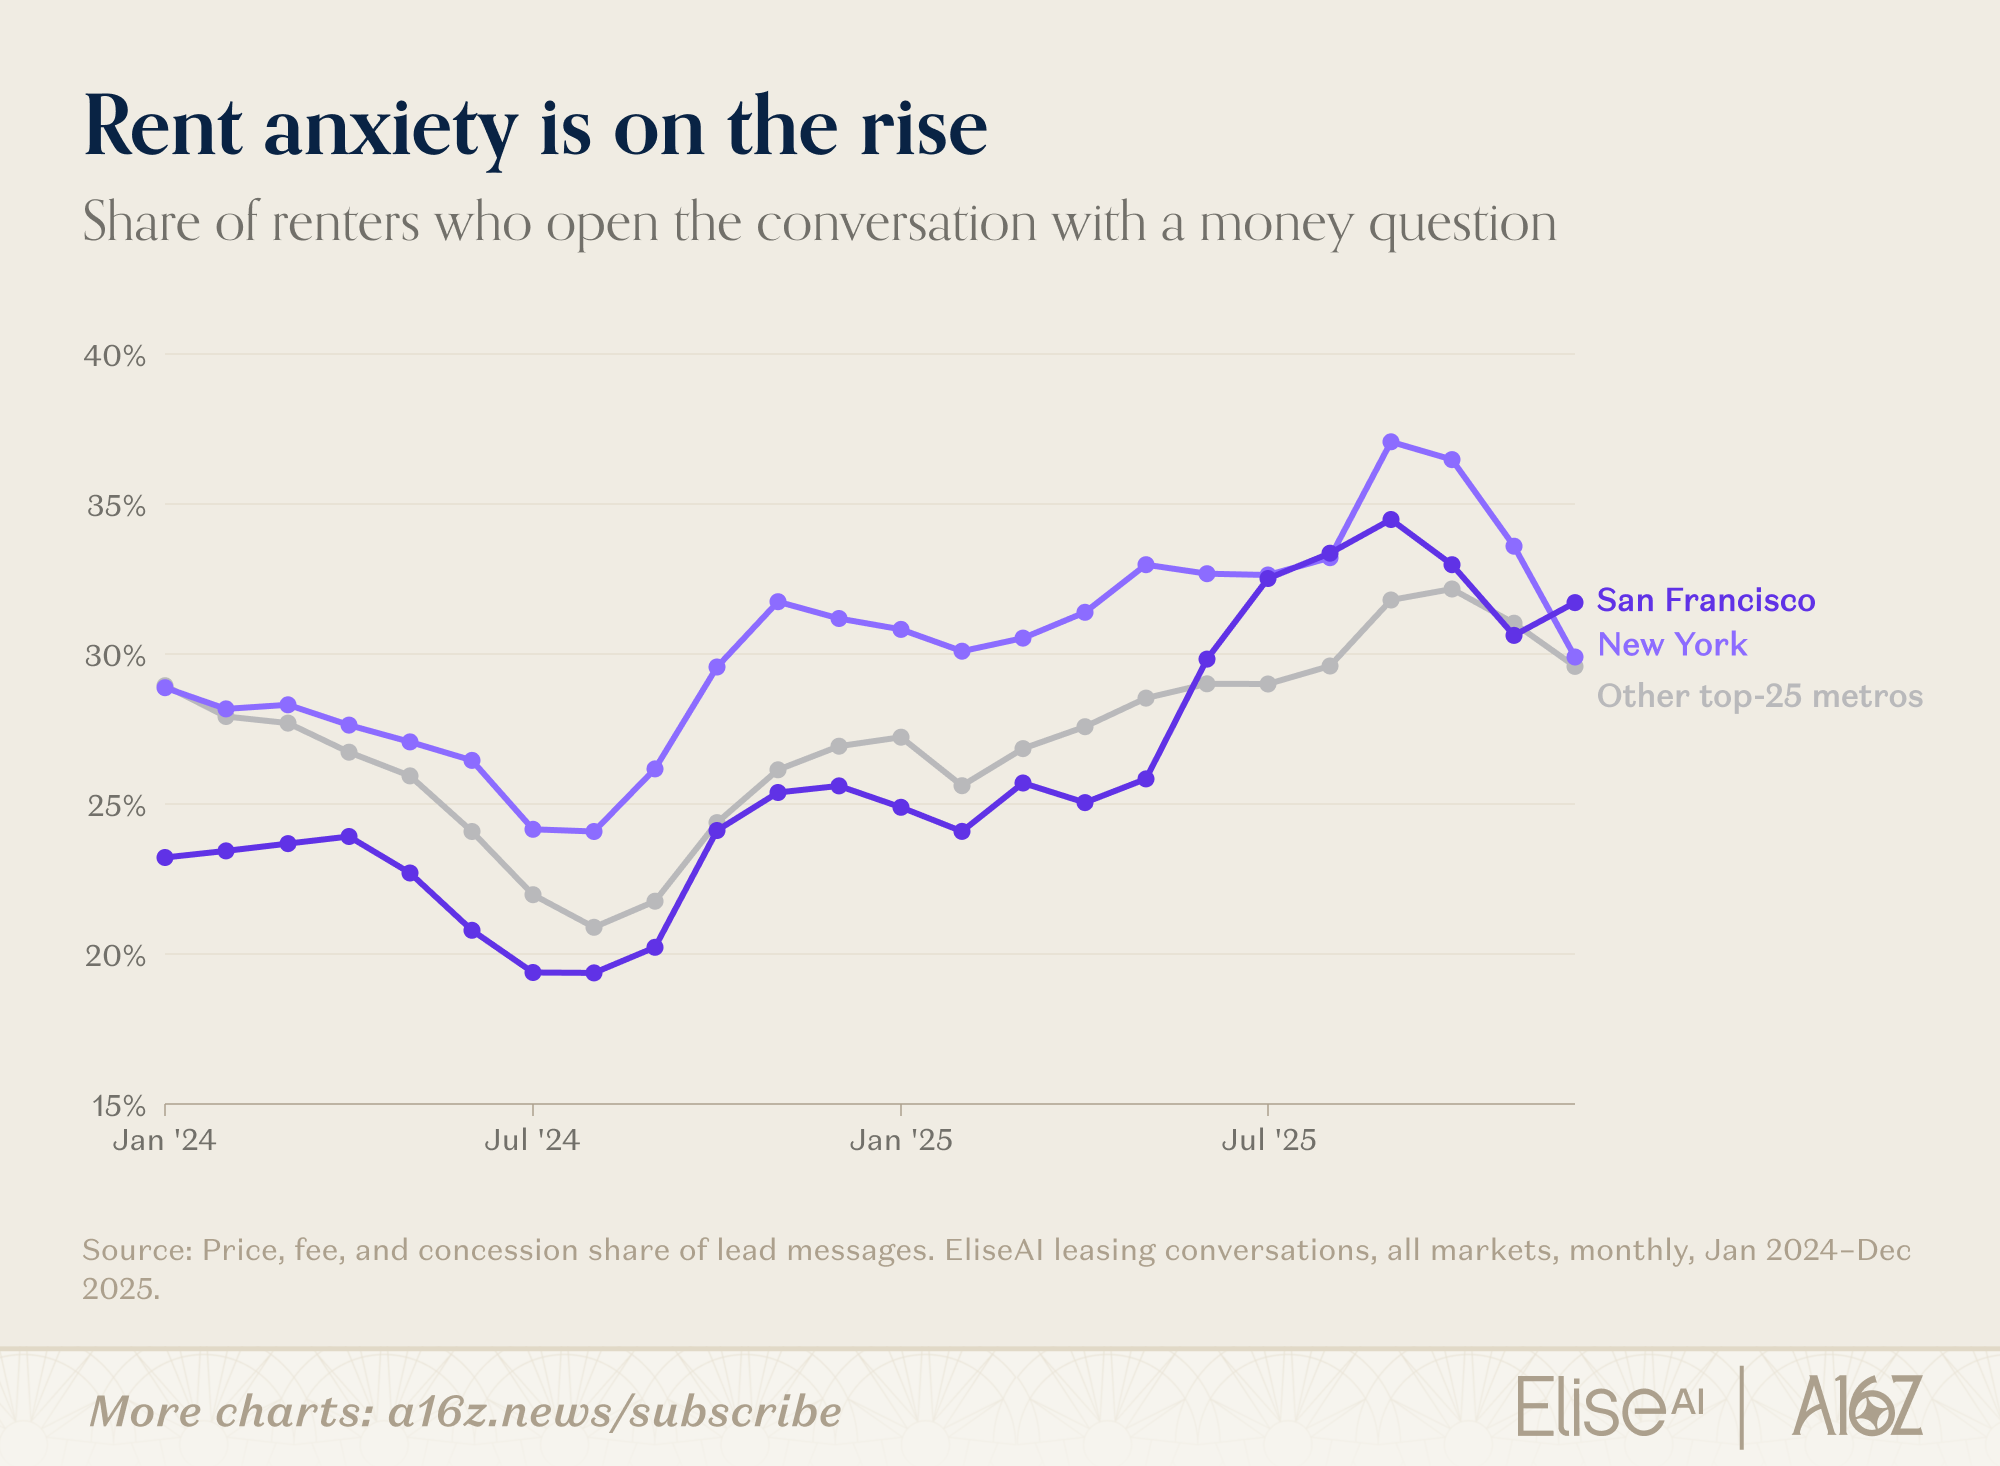
Two details stand out. The low point in the index was August 2024, in every market, and the climb since has been relentless. And San Francisco, of all places, entered this window among the least price-anxious big markets in the country, then added 15 points in fourteen months to surpass New York in late 2025.
So where does anxiety bite hardest? The cleanest way to see the country is to cross the market’s two sides: what landlords advertise, meaning concessions (industry speak for a move-in deal: a free month, waived fees, occasionally a gift card), against what renters actually ask about. Do that for the 25 biggest metros and America splits into four rental markets:
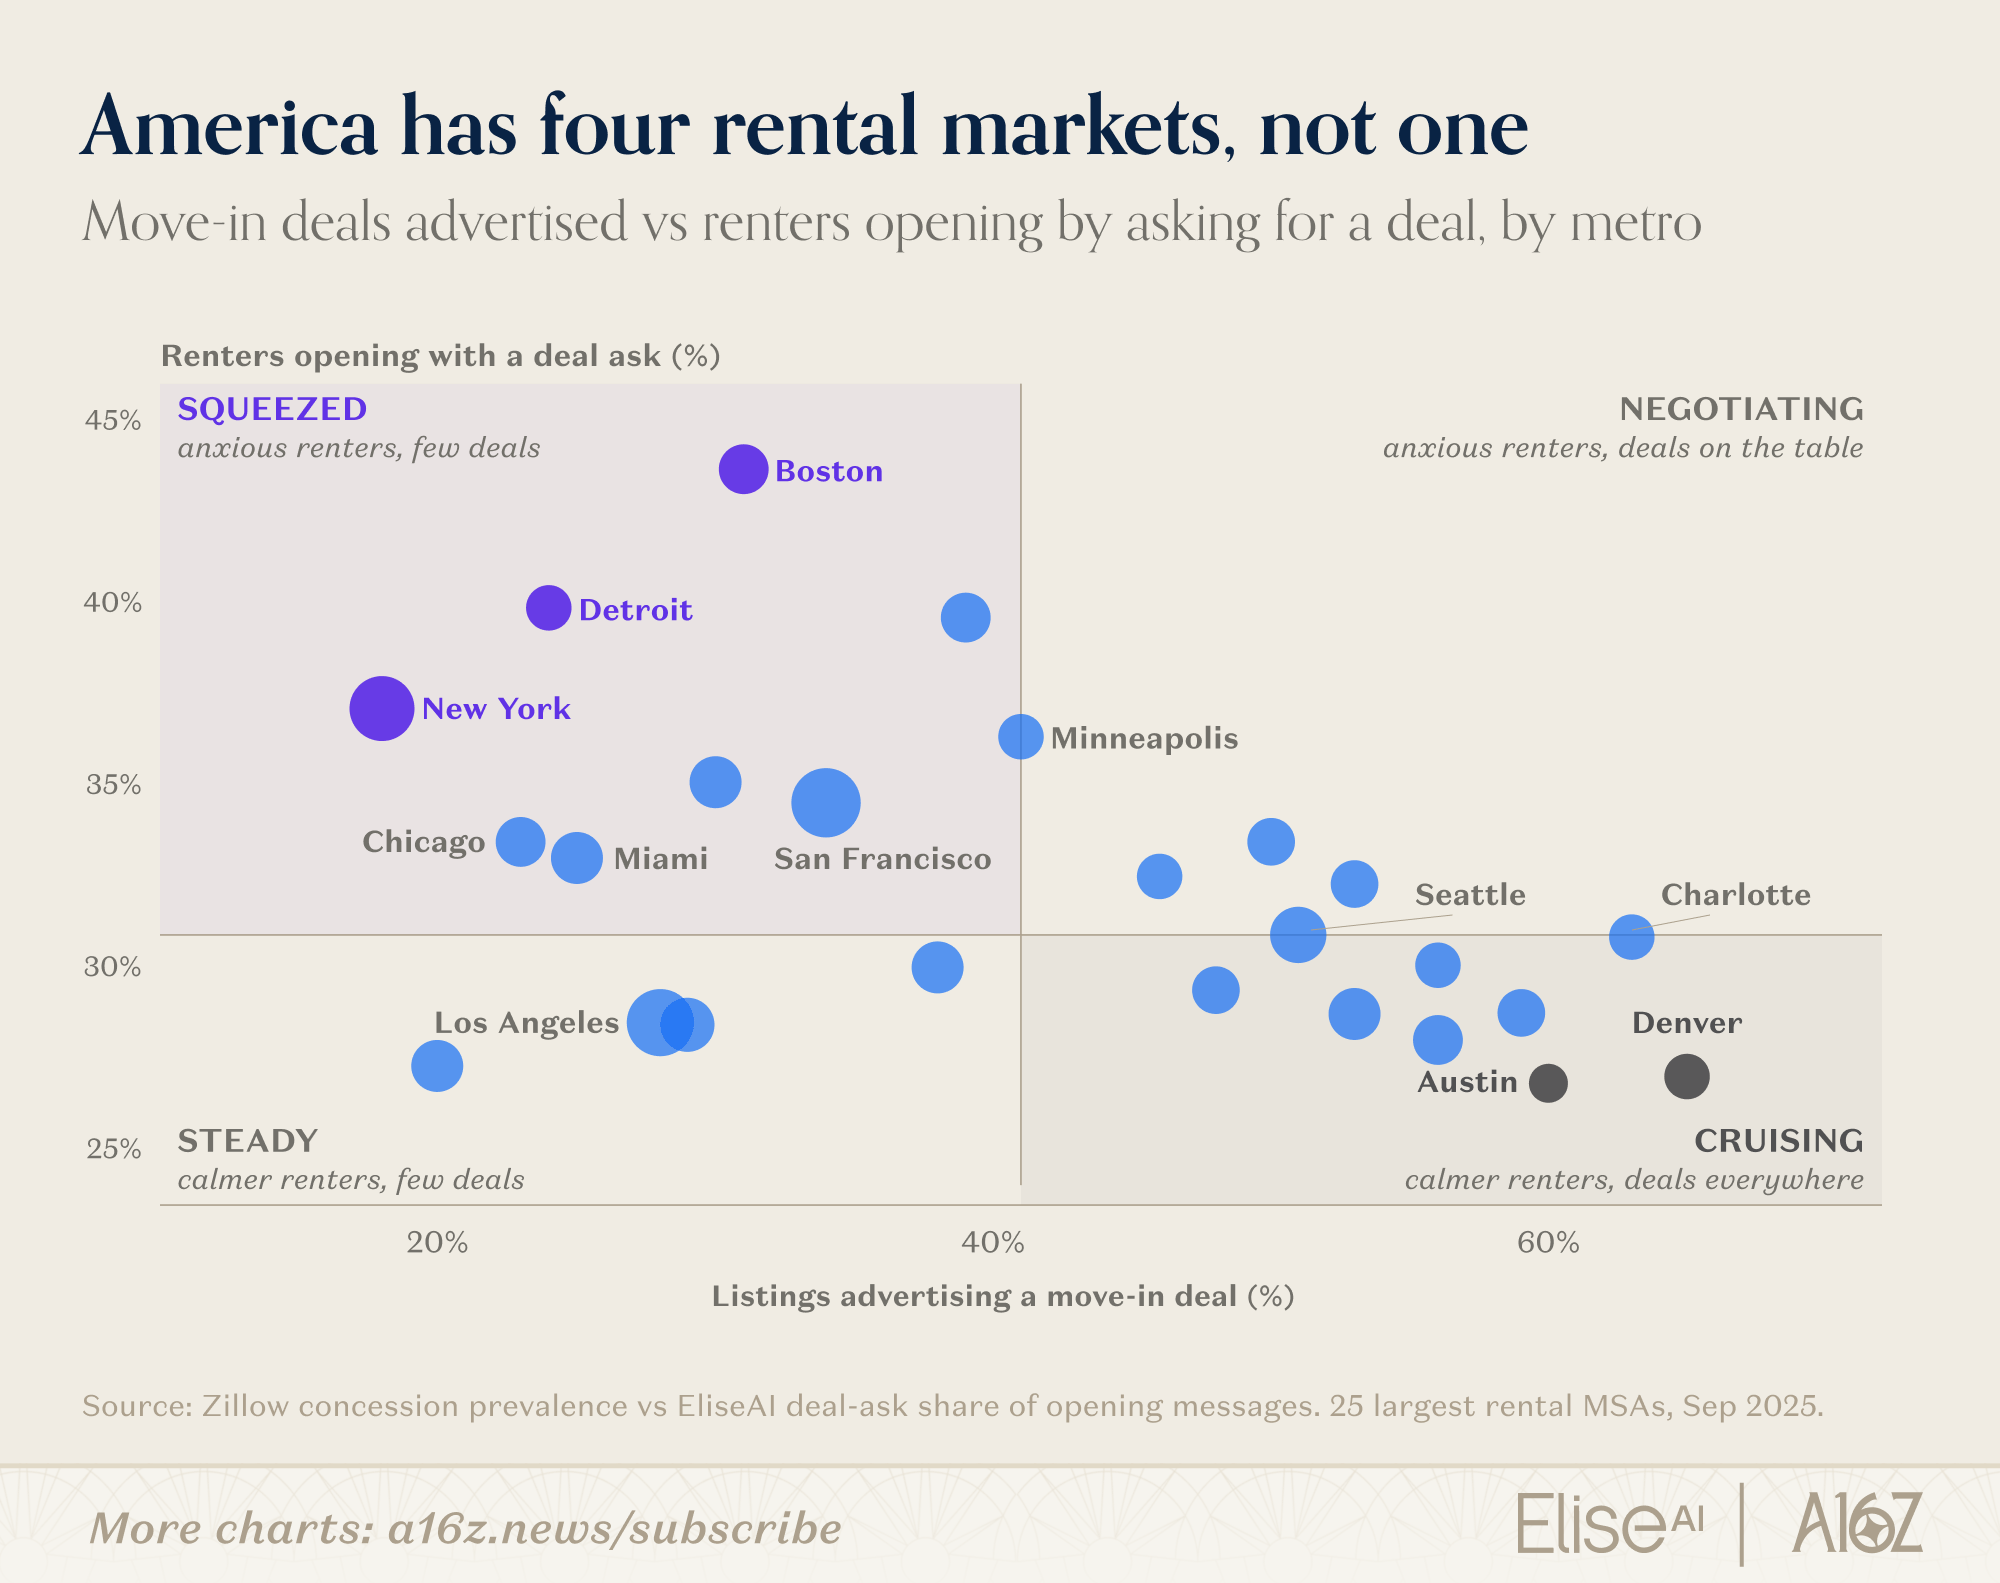
Squeezed, steady, cruising. Then look at the fourth corner, the one reserved for anxious renters swimming in deals. It is largely empty. No large American rental market is both generous and stressed. Score that same gap city by city, advertised relief minus renter asks, and you get a genuinely new scorecard: where renter stress goes most unanswered.
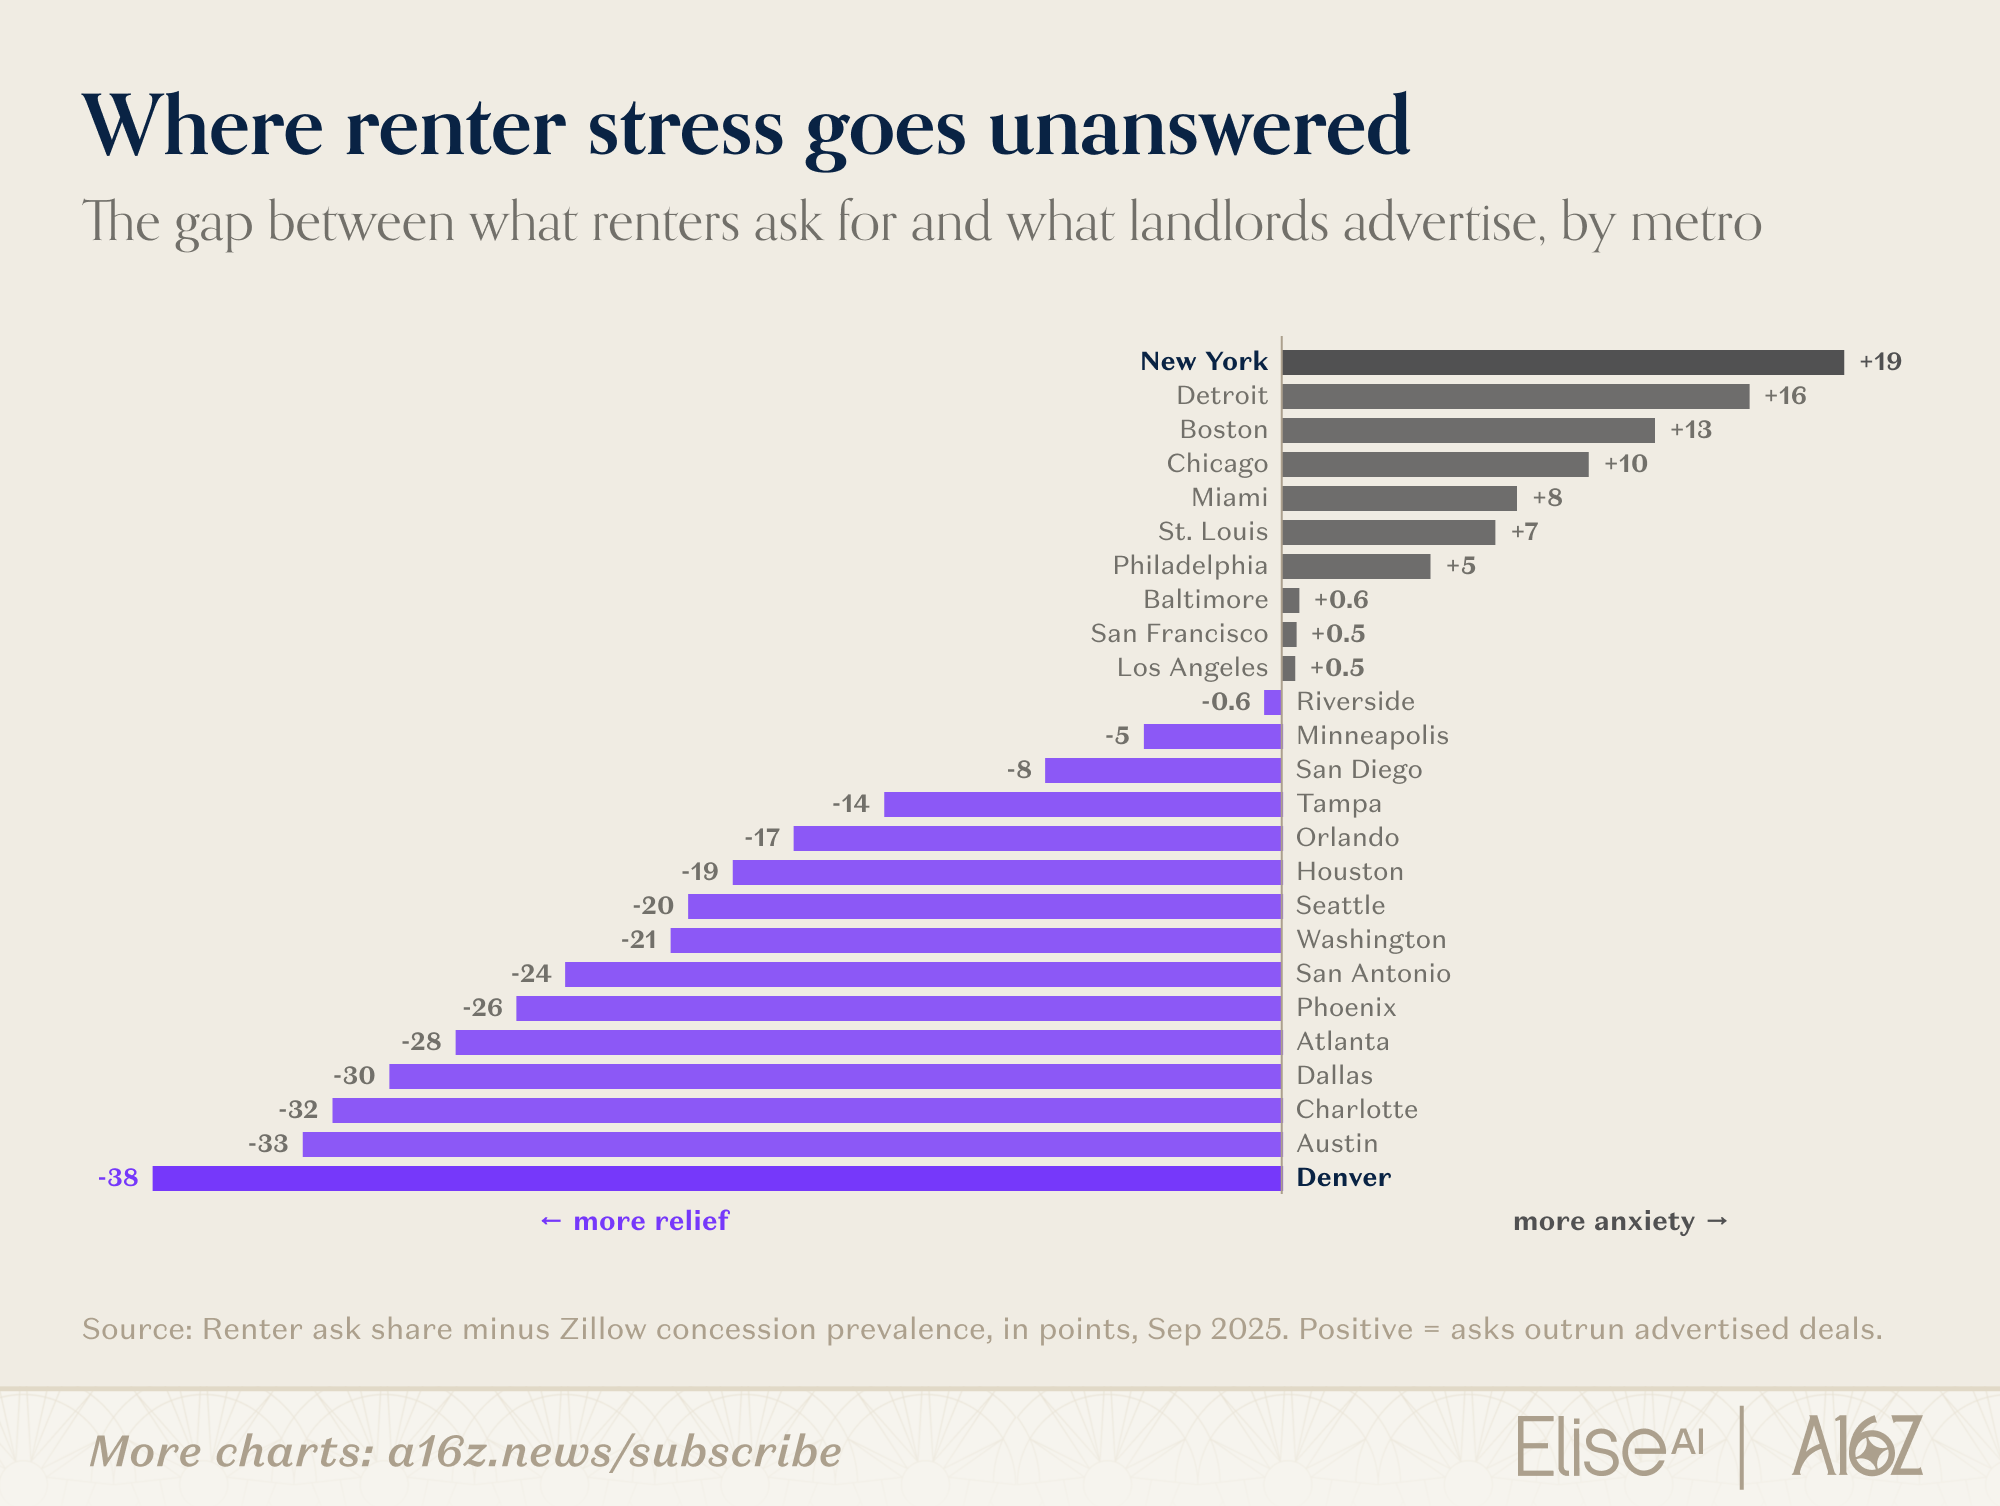
New York renters carry about 19 points of unrelieved stress. Denver landlords, meanwhile, are offering 38 points more deal than renters request. So, within the U.S., major metros present opposing problems and differing rental landscapes (duh).
This is also where the data starts overturning received wisdom. Did someone say “narrative violation”? Received wisdom says renters ask for deals where deals abound. Check the conversations against Zillow’s count of listings advertising a concession, and the truth runs backwards.
Renters ask about deals more in the places where the fewest are posted. Said differently, it makes a bit more sense: listings show what landlords advertise; conversations reveal what renters want but cannot find.
The stress map isn’t static; the metros where anxiety rose fastest are not the ones you would guess, either.
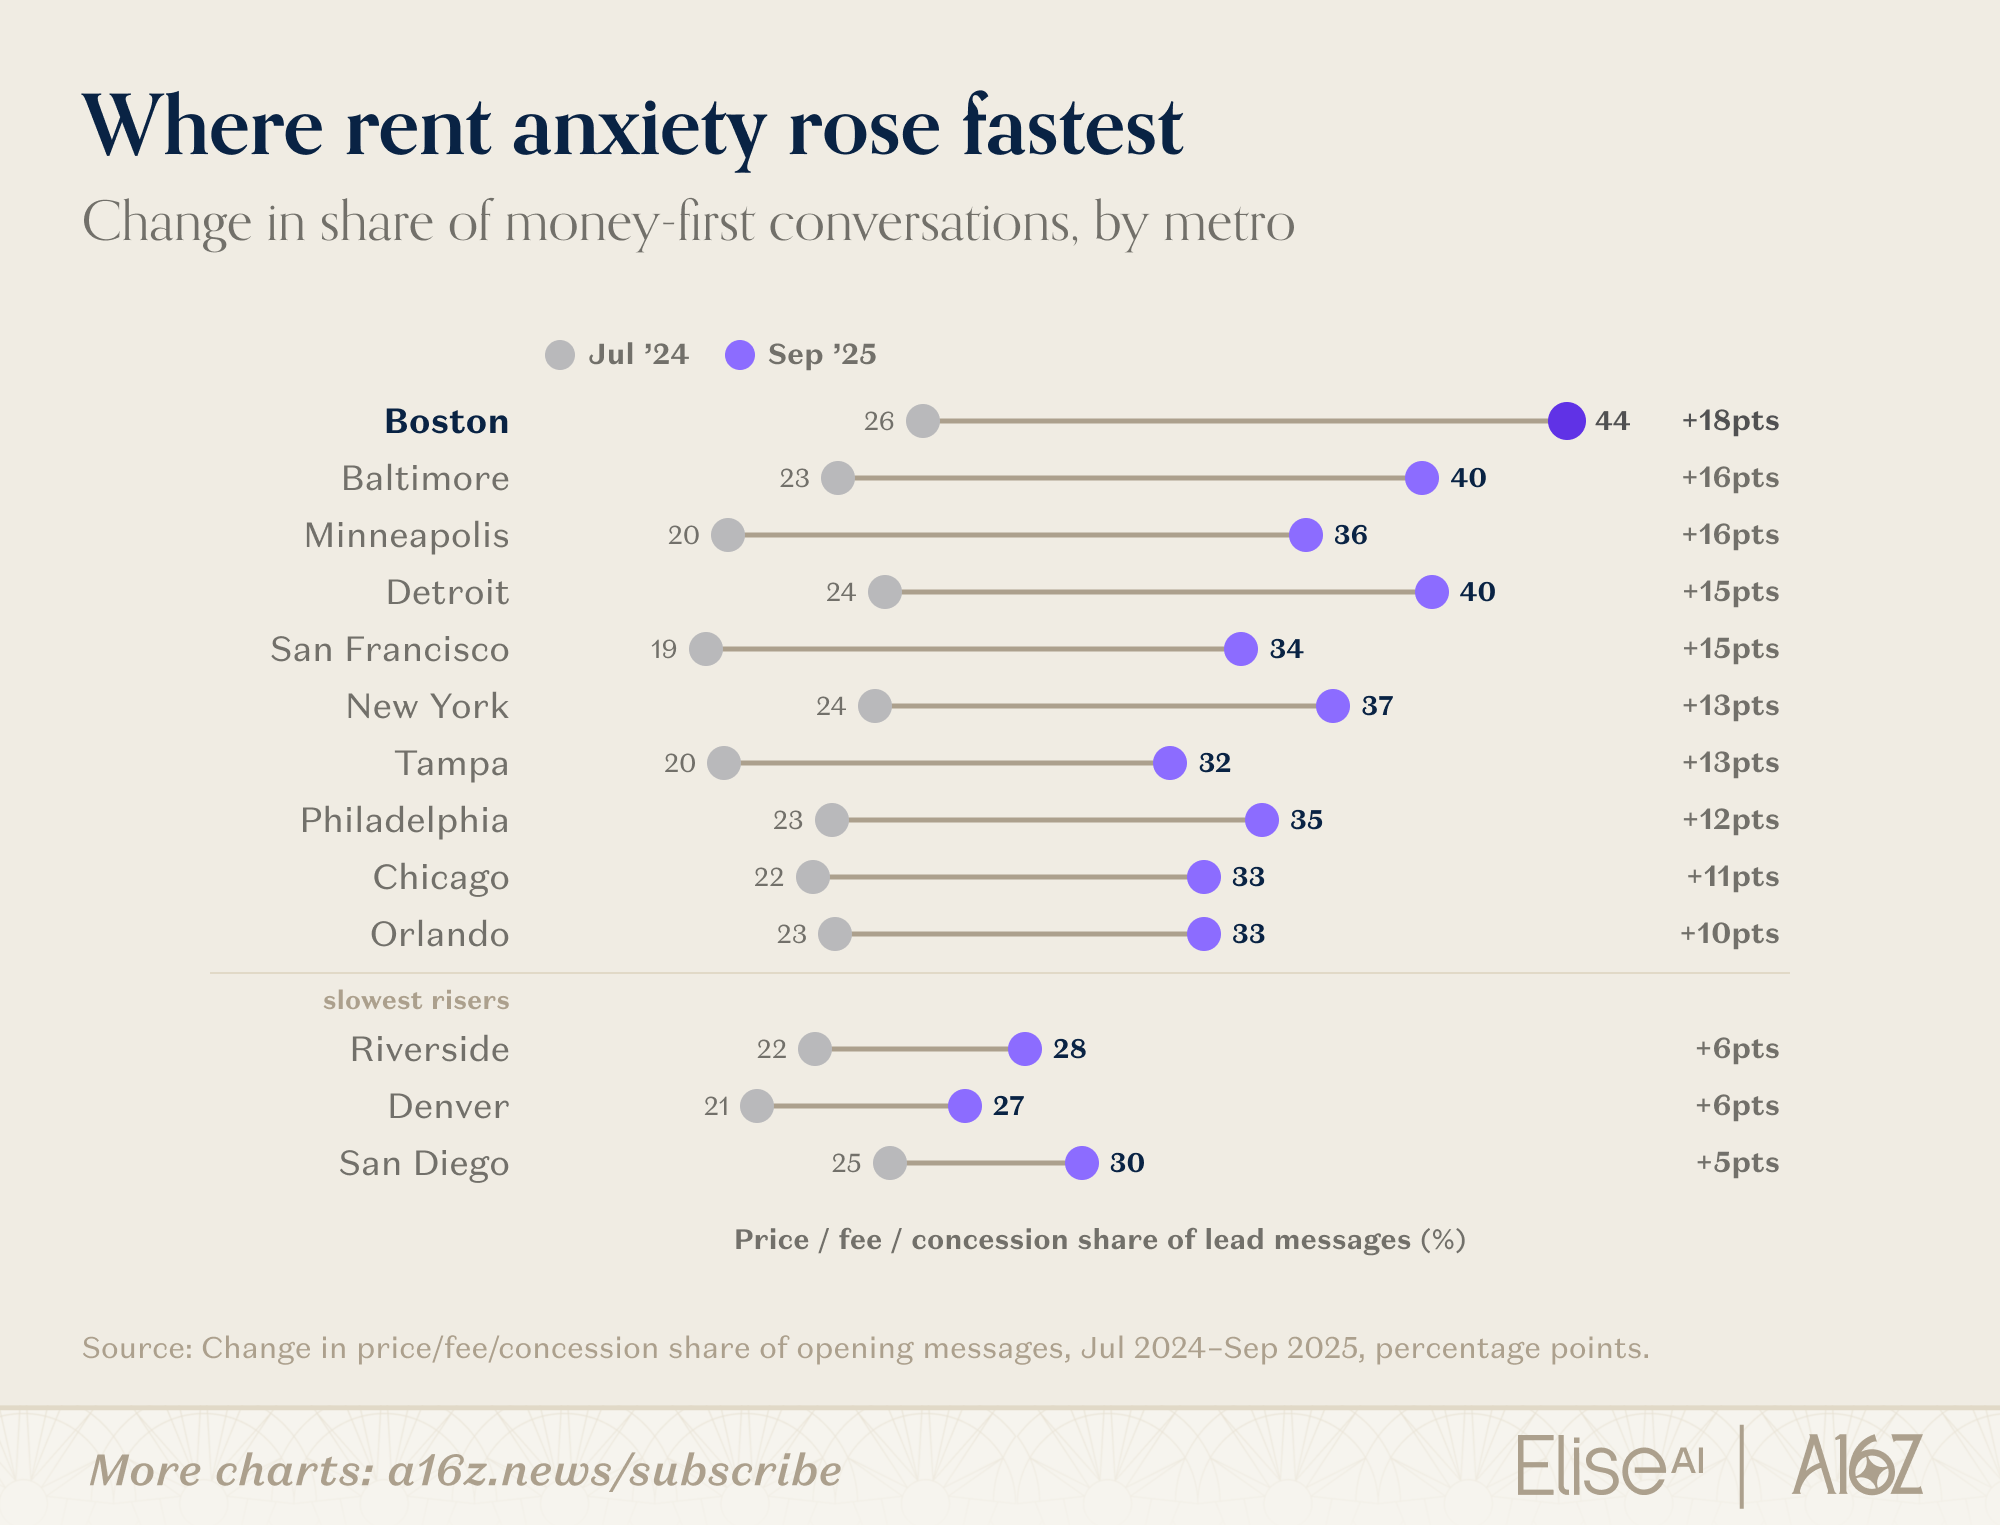
Boston. Baltimore. Minneapolis. Detroit. The surge lives in the Northeast and Midwest, while Denver and Southern California, currently blanketed in move-in deals, barely moved. This isn’t a story about cheap buildings. A quick decoder ring, since the housing industry loves letter grades: Class A means the newer glassy buildings with the rooftop and the package room, Class B means older but well kept, Class C means the oldest and cheapest stock, often called workforce housing. Here is the anxiety index for each grade:
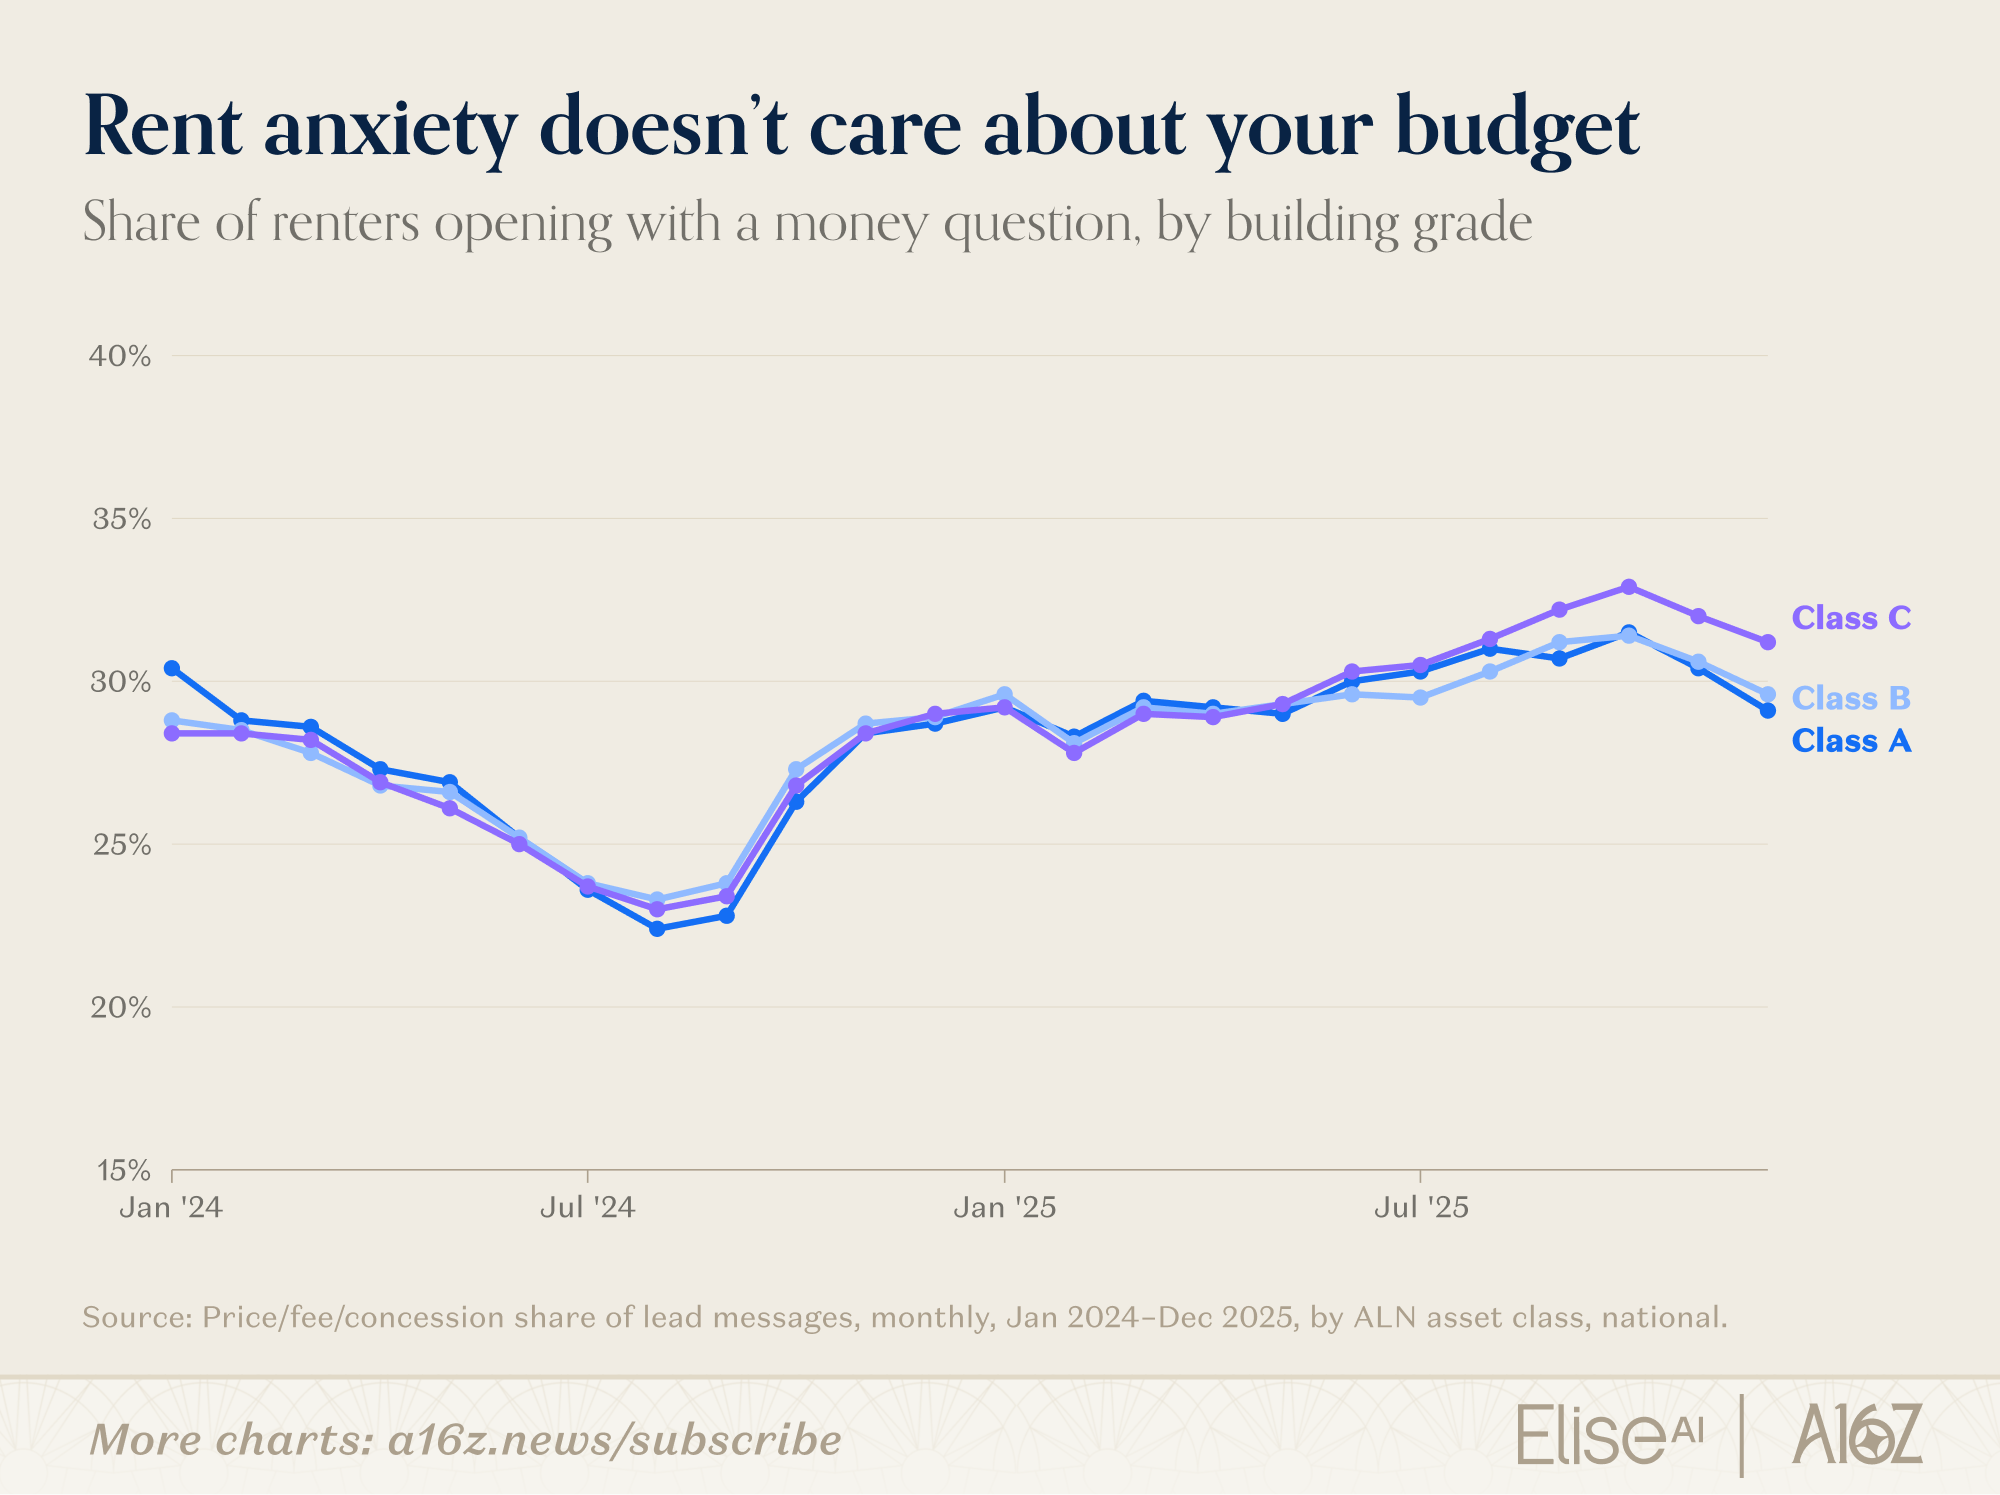
The three lines sit on top of each other for two full years, never more than about two points apart. Luxury renters and workforce renters are both opening with the same nervous questions. So, are renters right to be anxious? Let’s examine what it takes to actually land an apartment.
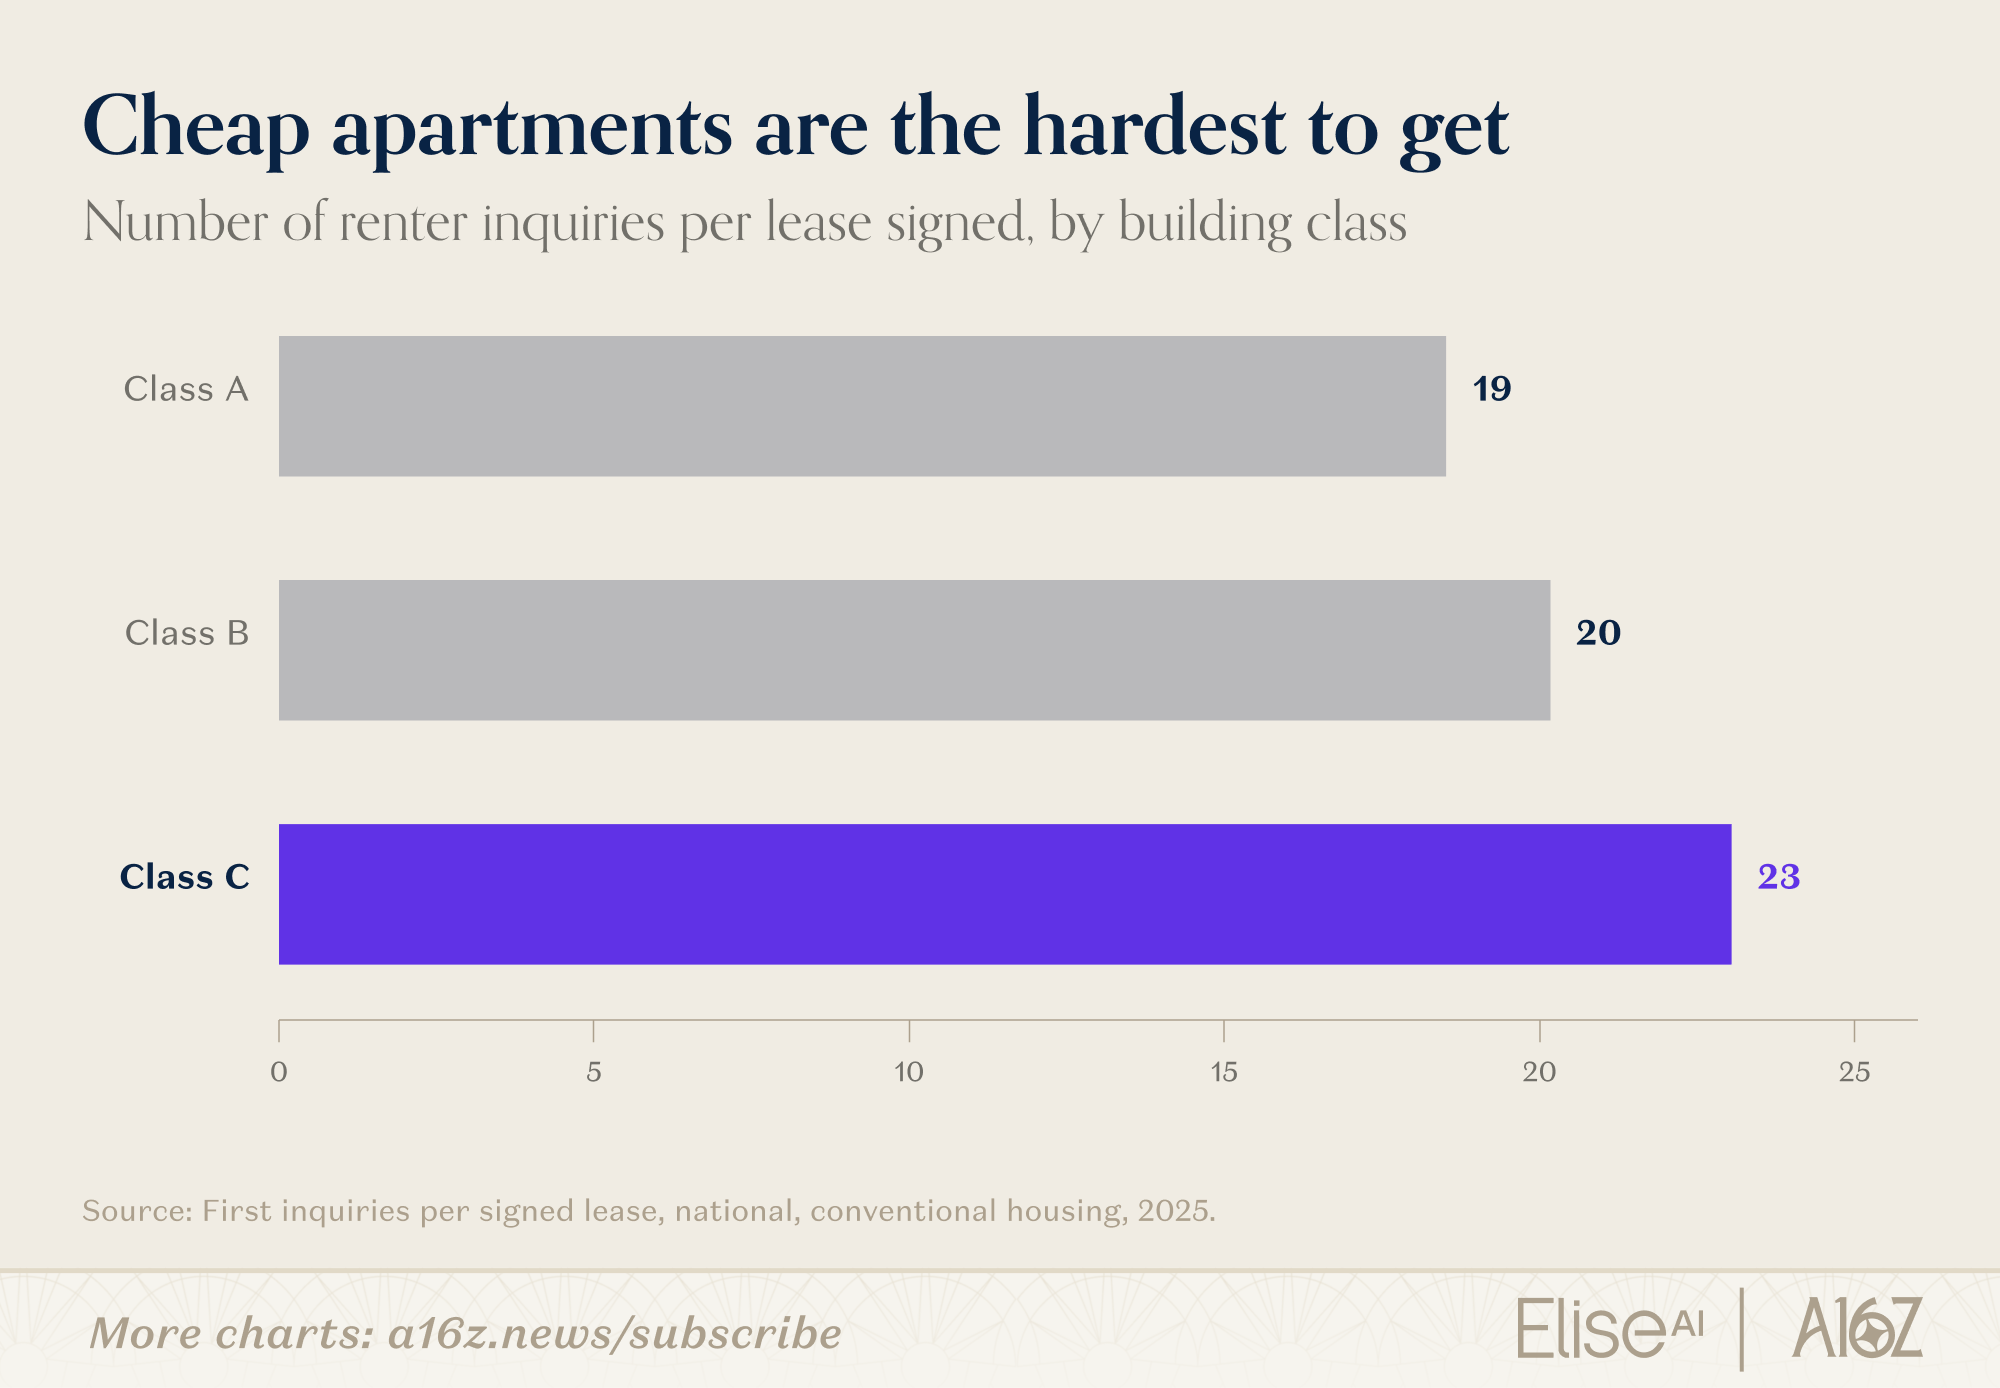
Nationally, the cheapest homes draw the “longest lines,” and the renters with the least financial slack are the ones standing in them. But there’s a twist: crowded is not the same as slow.
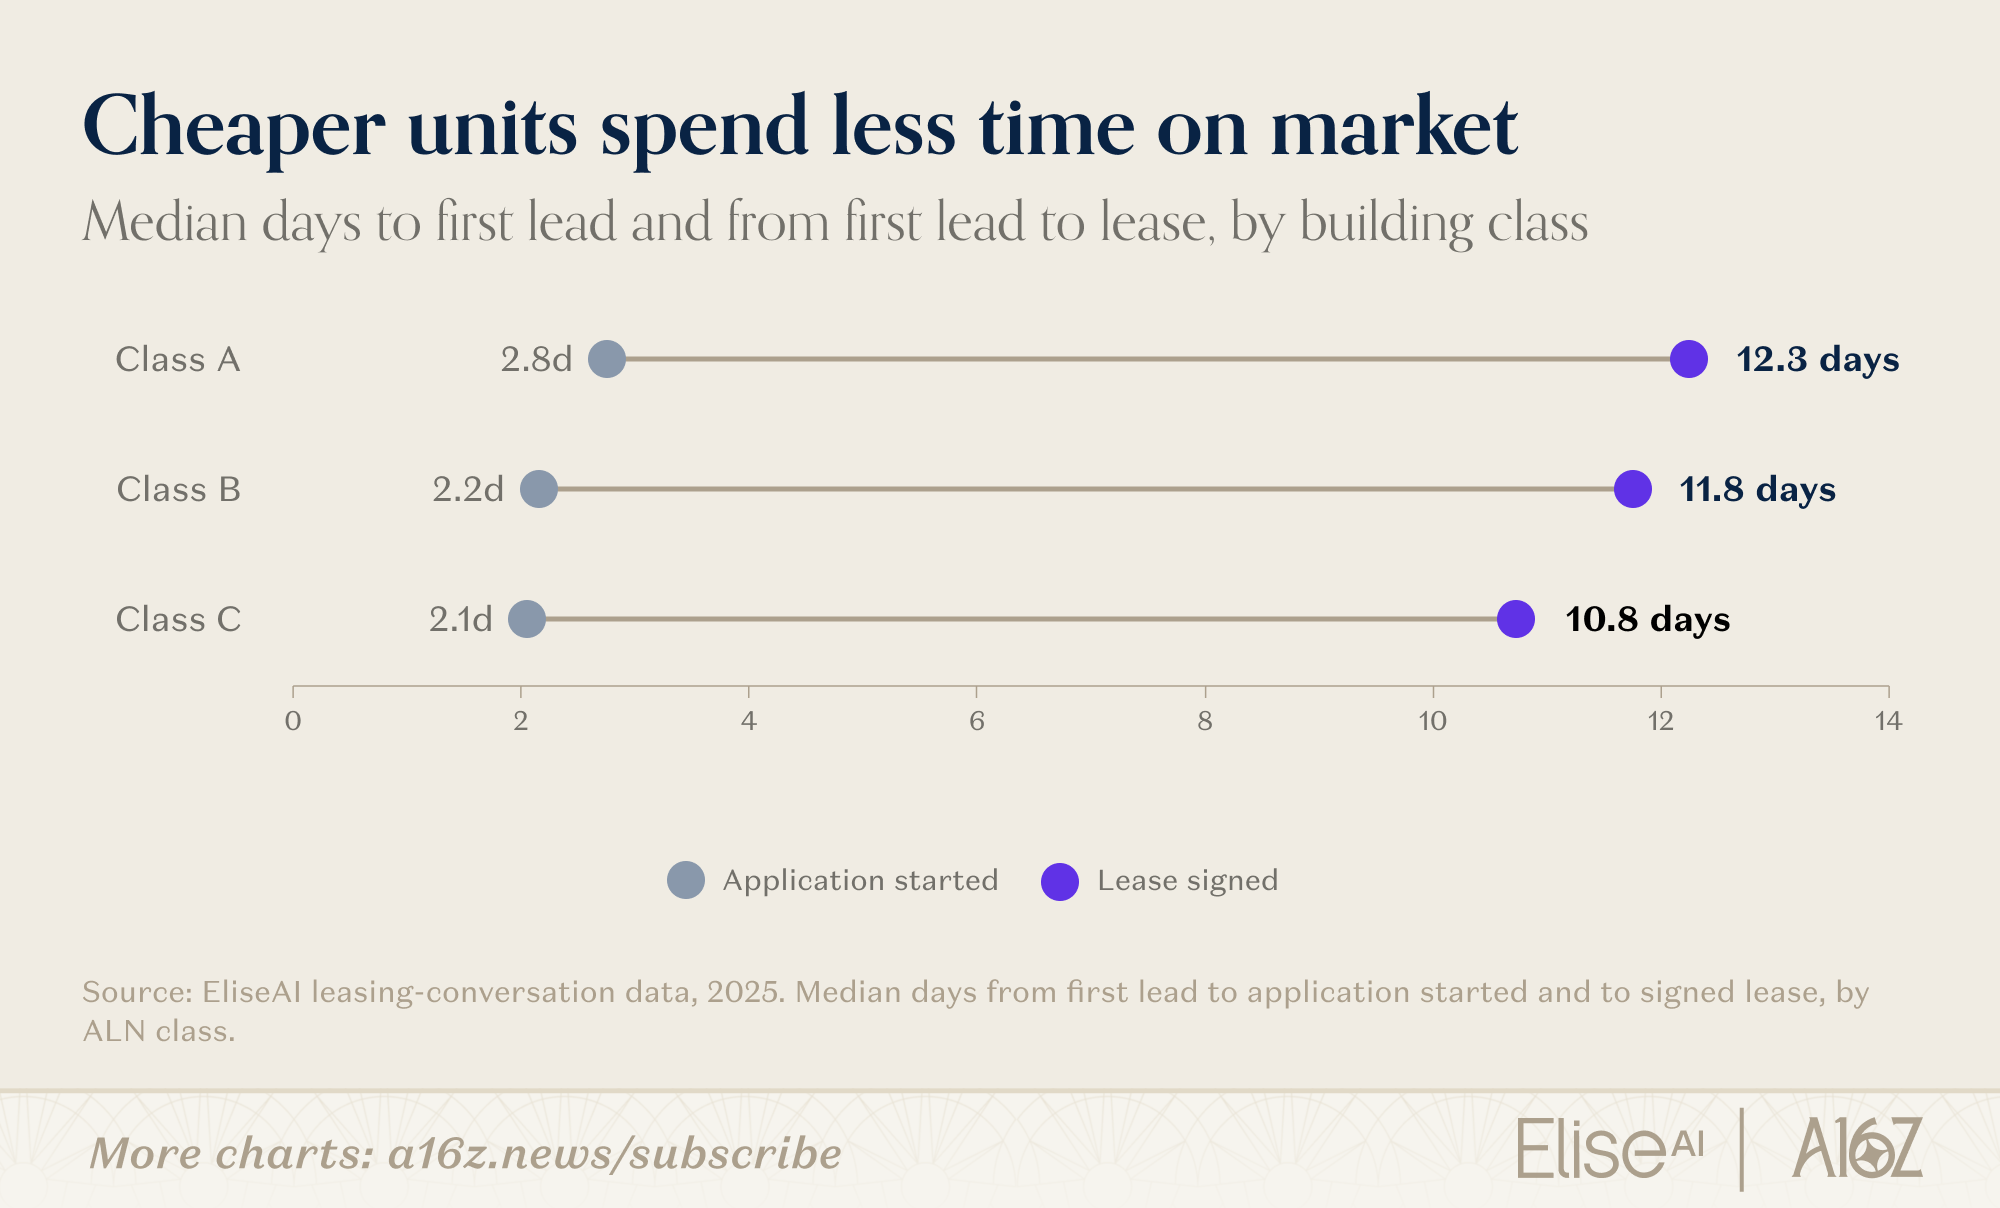
Once renters engage on a Class C unit, it signs faster than luxury: 10.8 days to a lease, versus 12.3. The “search tax” on cheap apartments is competition, not pace. As an aside, across this entire dataset, how many people chase a unit and how long the process takes turn out to be almost completely unrelated.
Next, a ritual every renter knows: you send the inquiry, and nothing comes back. To measure the nothing, EliseAI ran mystery shops, sending realistic renter inquiries to leasing offices and tracking whether, and how quickly, anyone responded. The results are bleak.
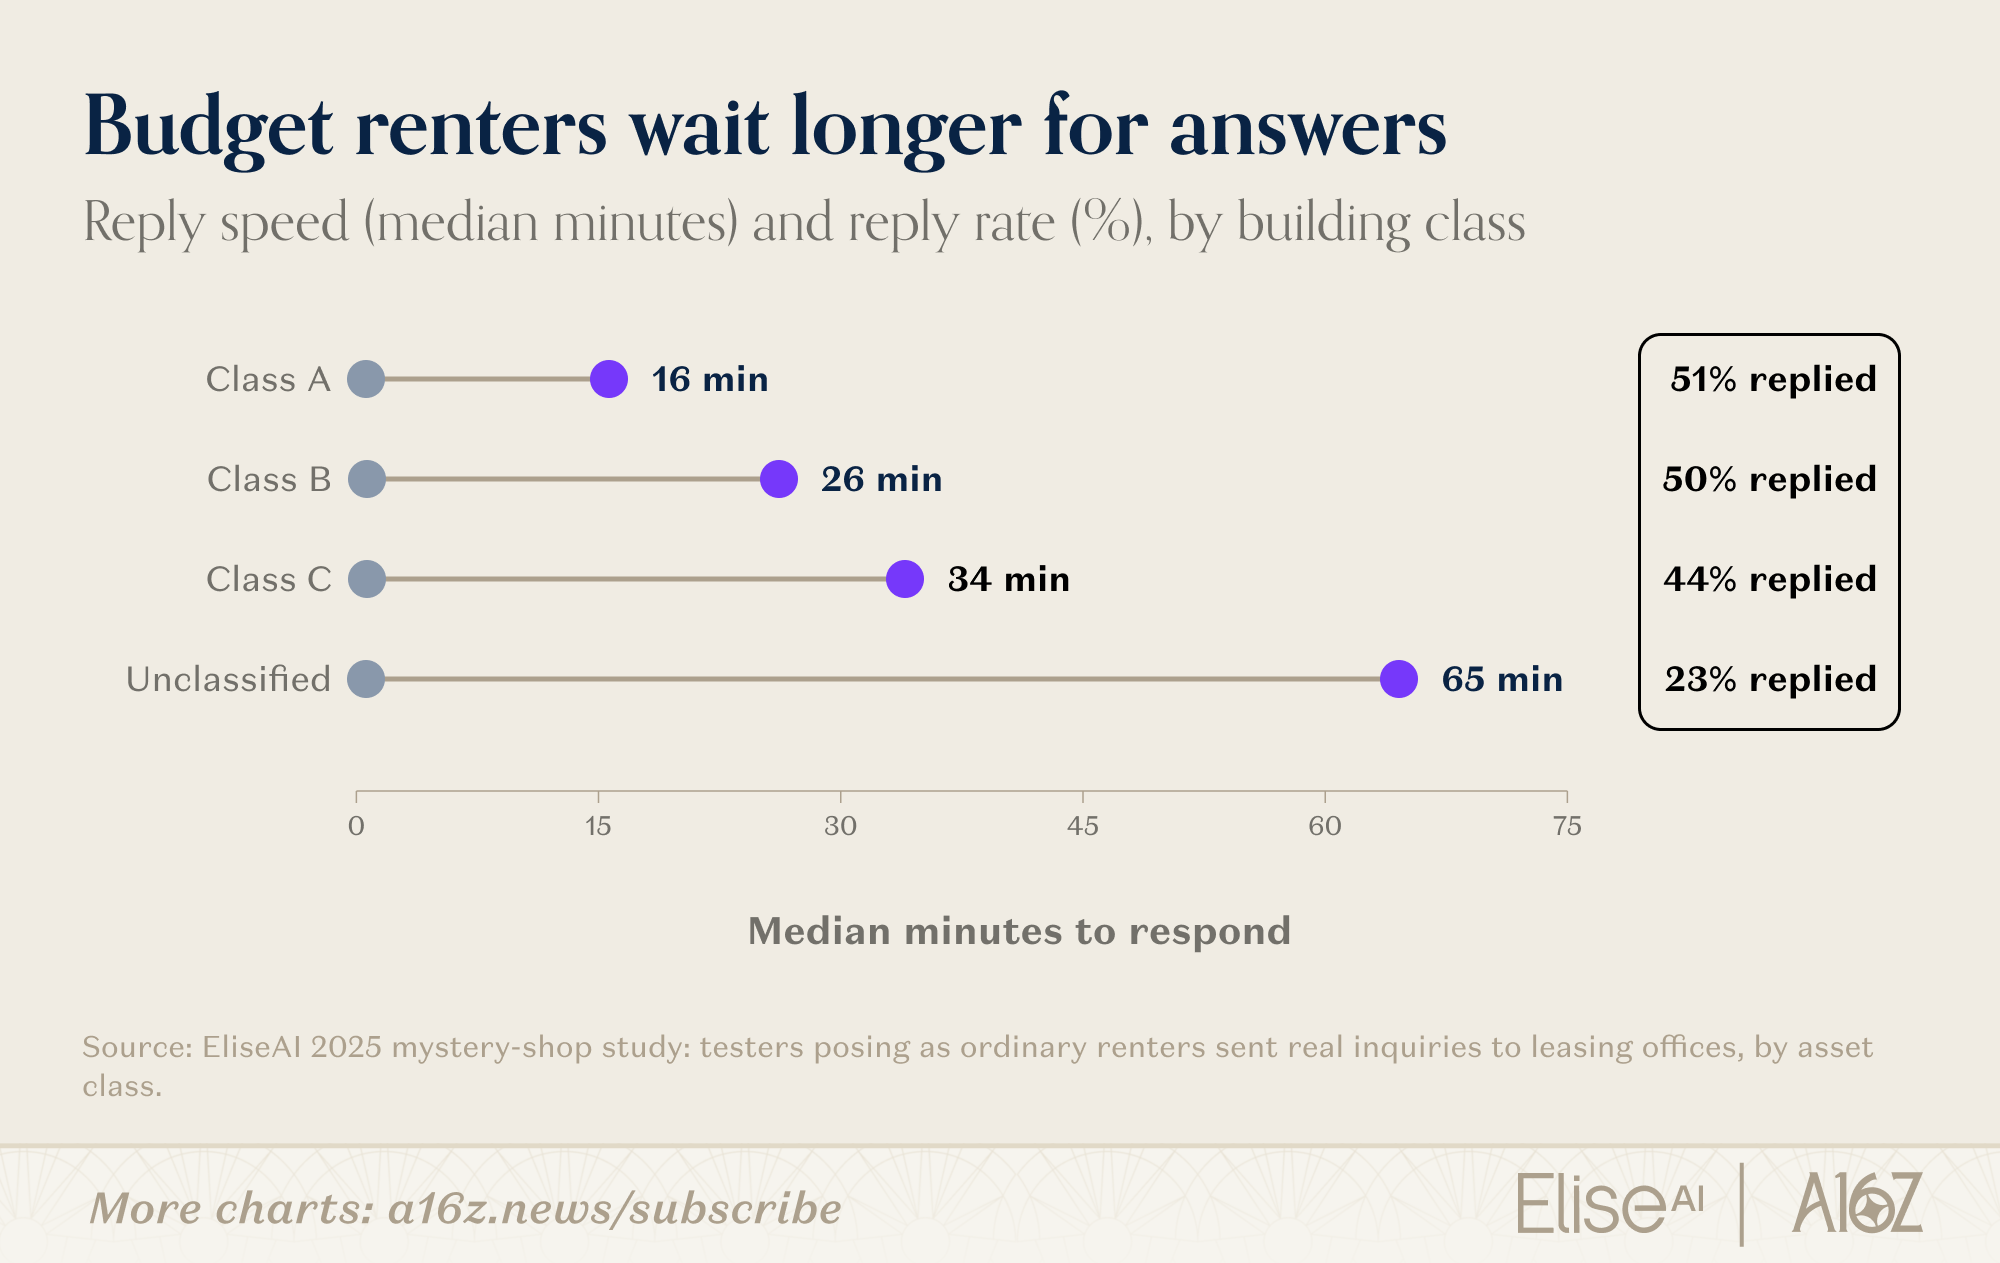
Even Class A buildings answered only about half of the mystery shoppers, and when replies did come, the wait grew as the rent shrank. Again, renting is a rare market where the customer does the chasing.
At the affordable end specifically, renters face a double bind: longer lines for units that move faster, and slower, or nonexistent, replies. Those with the least financial slack must chase hardest and decide fastest, often with the least information.
But the reply is only the first gate. The biggest leaks come next: getting renters to show up for a tour and then begin an application. Once the paperwork starts, most finish it. In renting, the contest is attendance. Much of the attendance rate hinges on how far ahead the tour was booked.
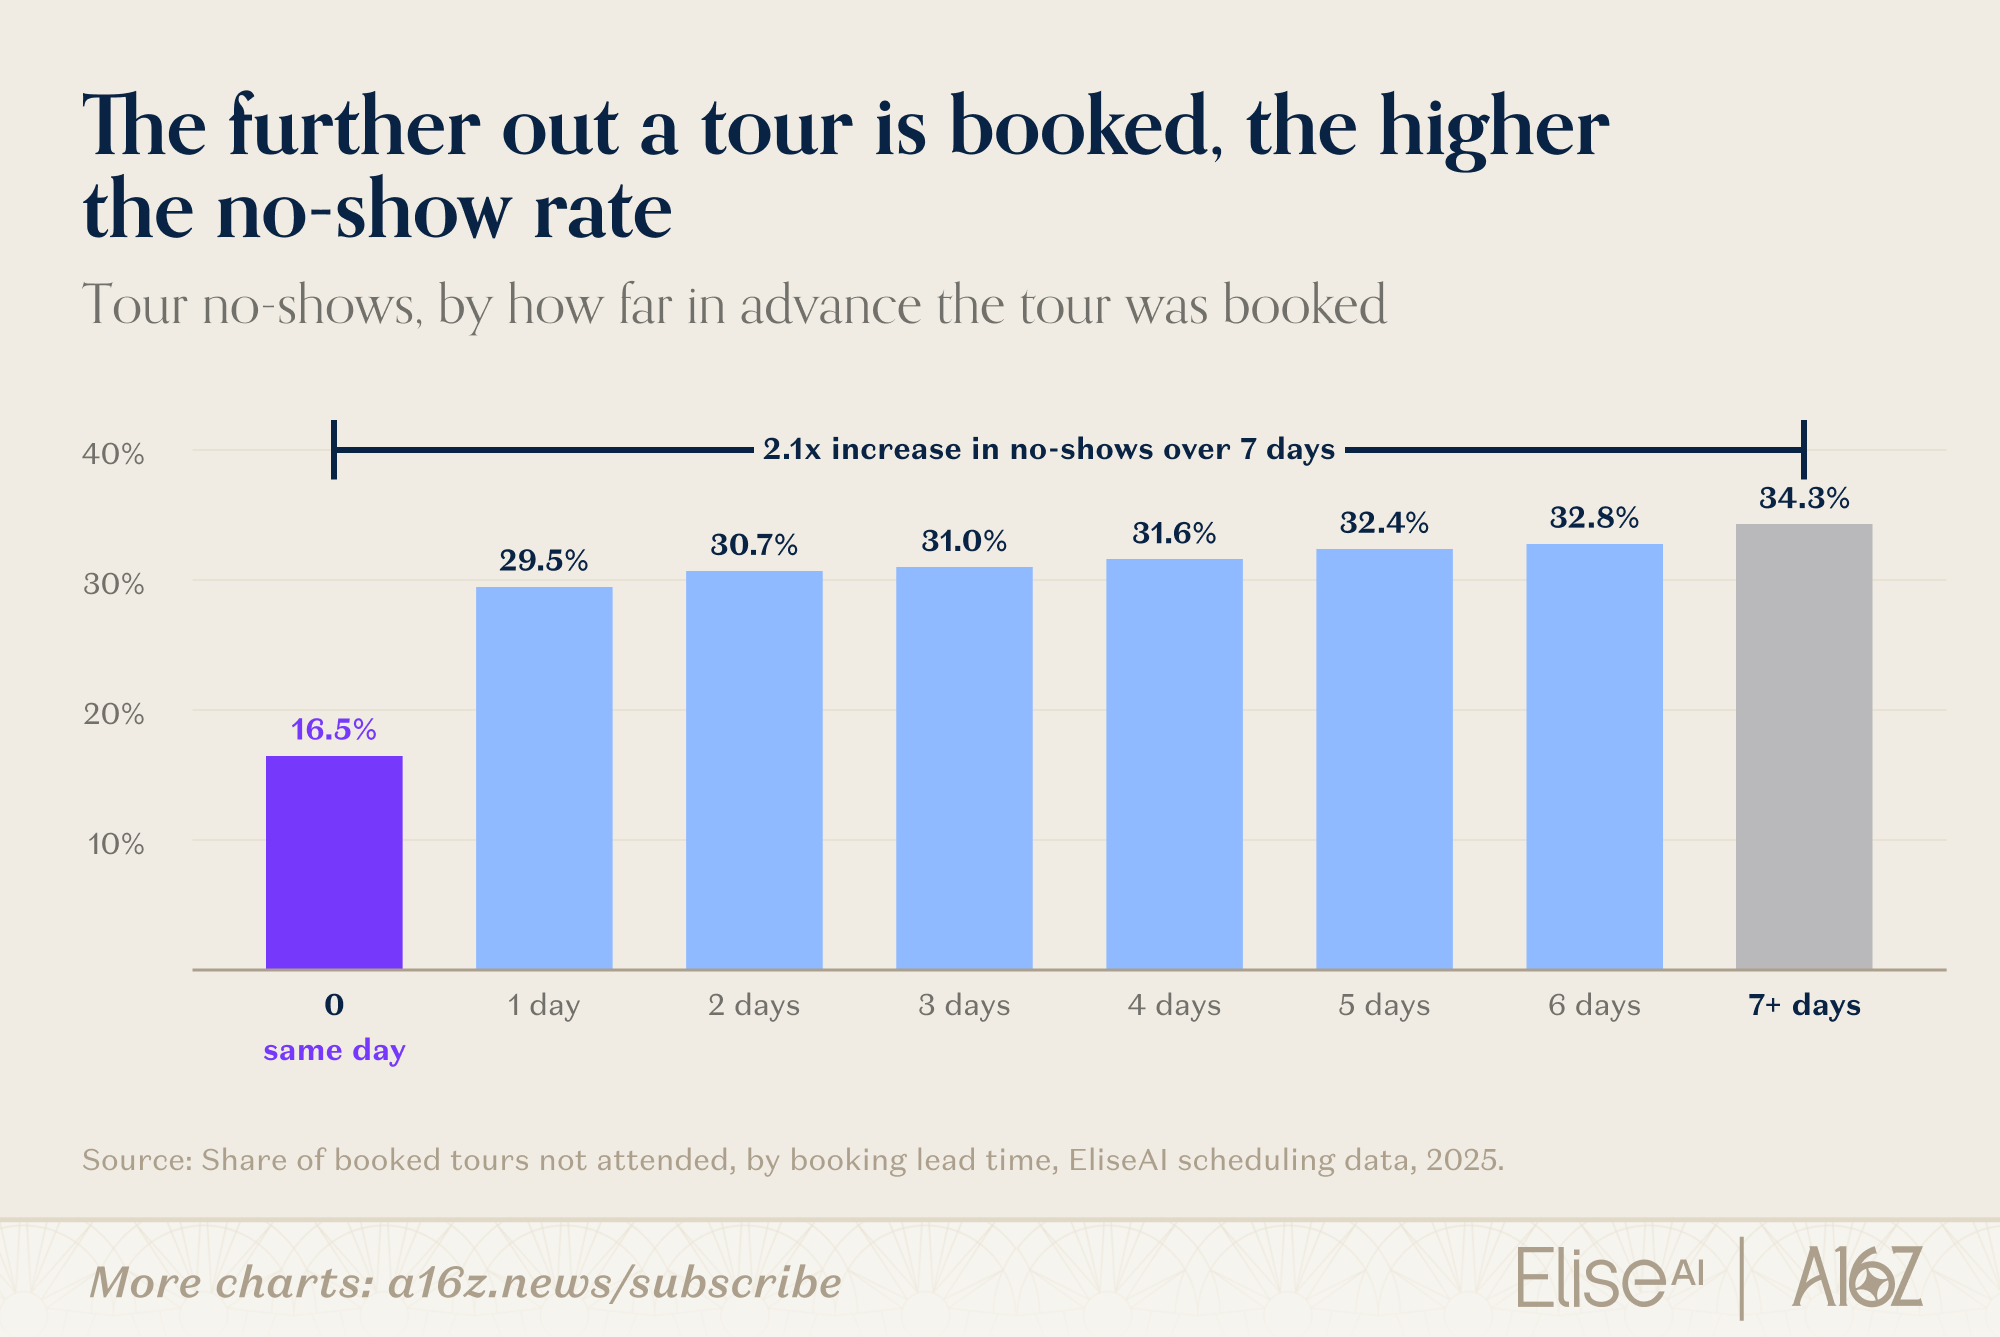
Book a tour for today and you’re more likely to show up. Book it for next week and no-show rates more than double. In a fast-moving market, this is a problem for both renter and landlord. The longer the wait, the more time there is for plans to change, the apartment to be leased, or another option to move ahead. But, this is also the most fixable number in the piece. Instant scheduling, reminders, and self-guided or AI-guided tour options all help renters get closer to signing a lease.
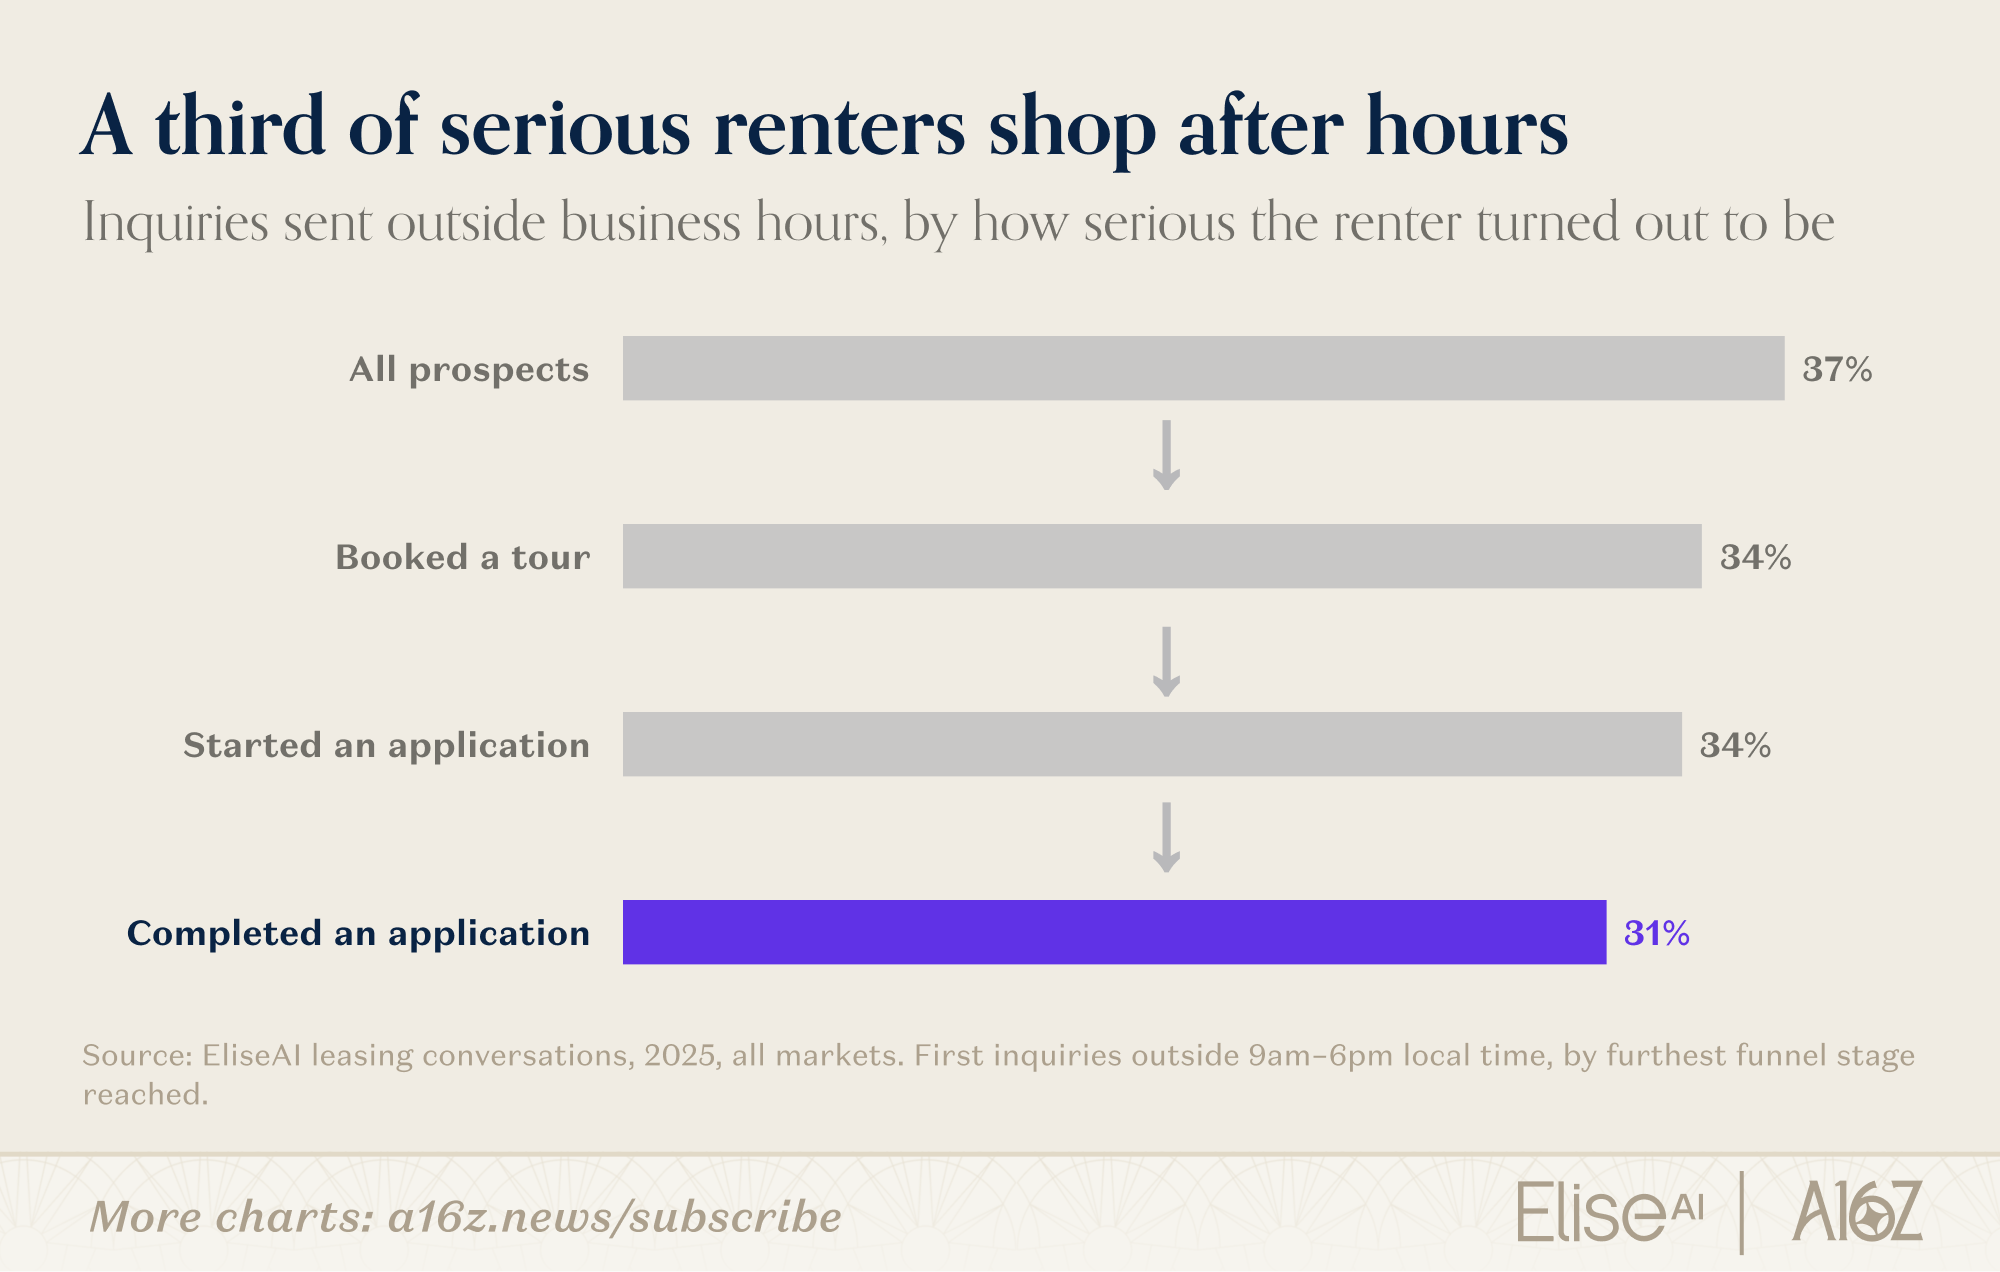
The clock doesn’t do anyone any favors, either. Renter demand has two rush hours, and both are inconvenient. Tours cram into lunchtime: 52% happen between noon and 3pm, when the leasing office is at its busiest. Messages pile up after work: inquiries roll deep into the evening, after the leasing office has gone home. And that evening traffic is not just idle scrolling. Among renters who eventually complete an application, the most serious cohort in the funnel, a third made first contact outside 9-to-6. The leasing office may close at six; renter intent does not. The conversation increasingly cannot, either.
Everything we’ve covered so far is the machinery of why we’re all so anxious about rent. Now we get to look at some sharper cuts: by city, by building grade, by calendar.
City by city, the texture gets richer and San Francisco earns a paragraph of its own, because the crowding there is something else.
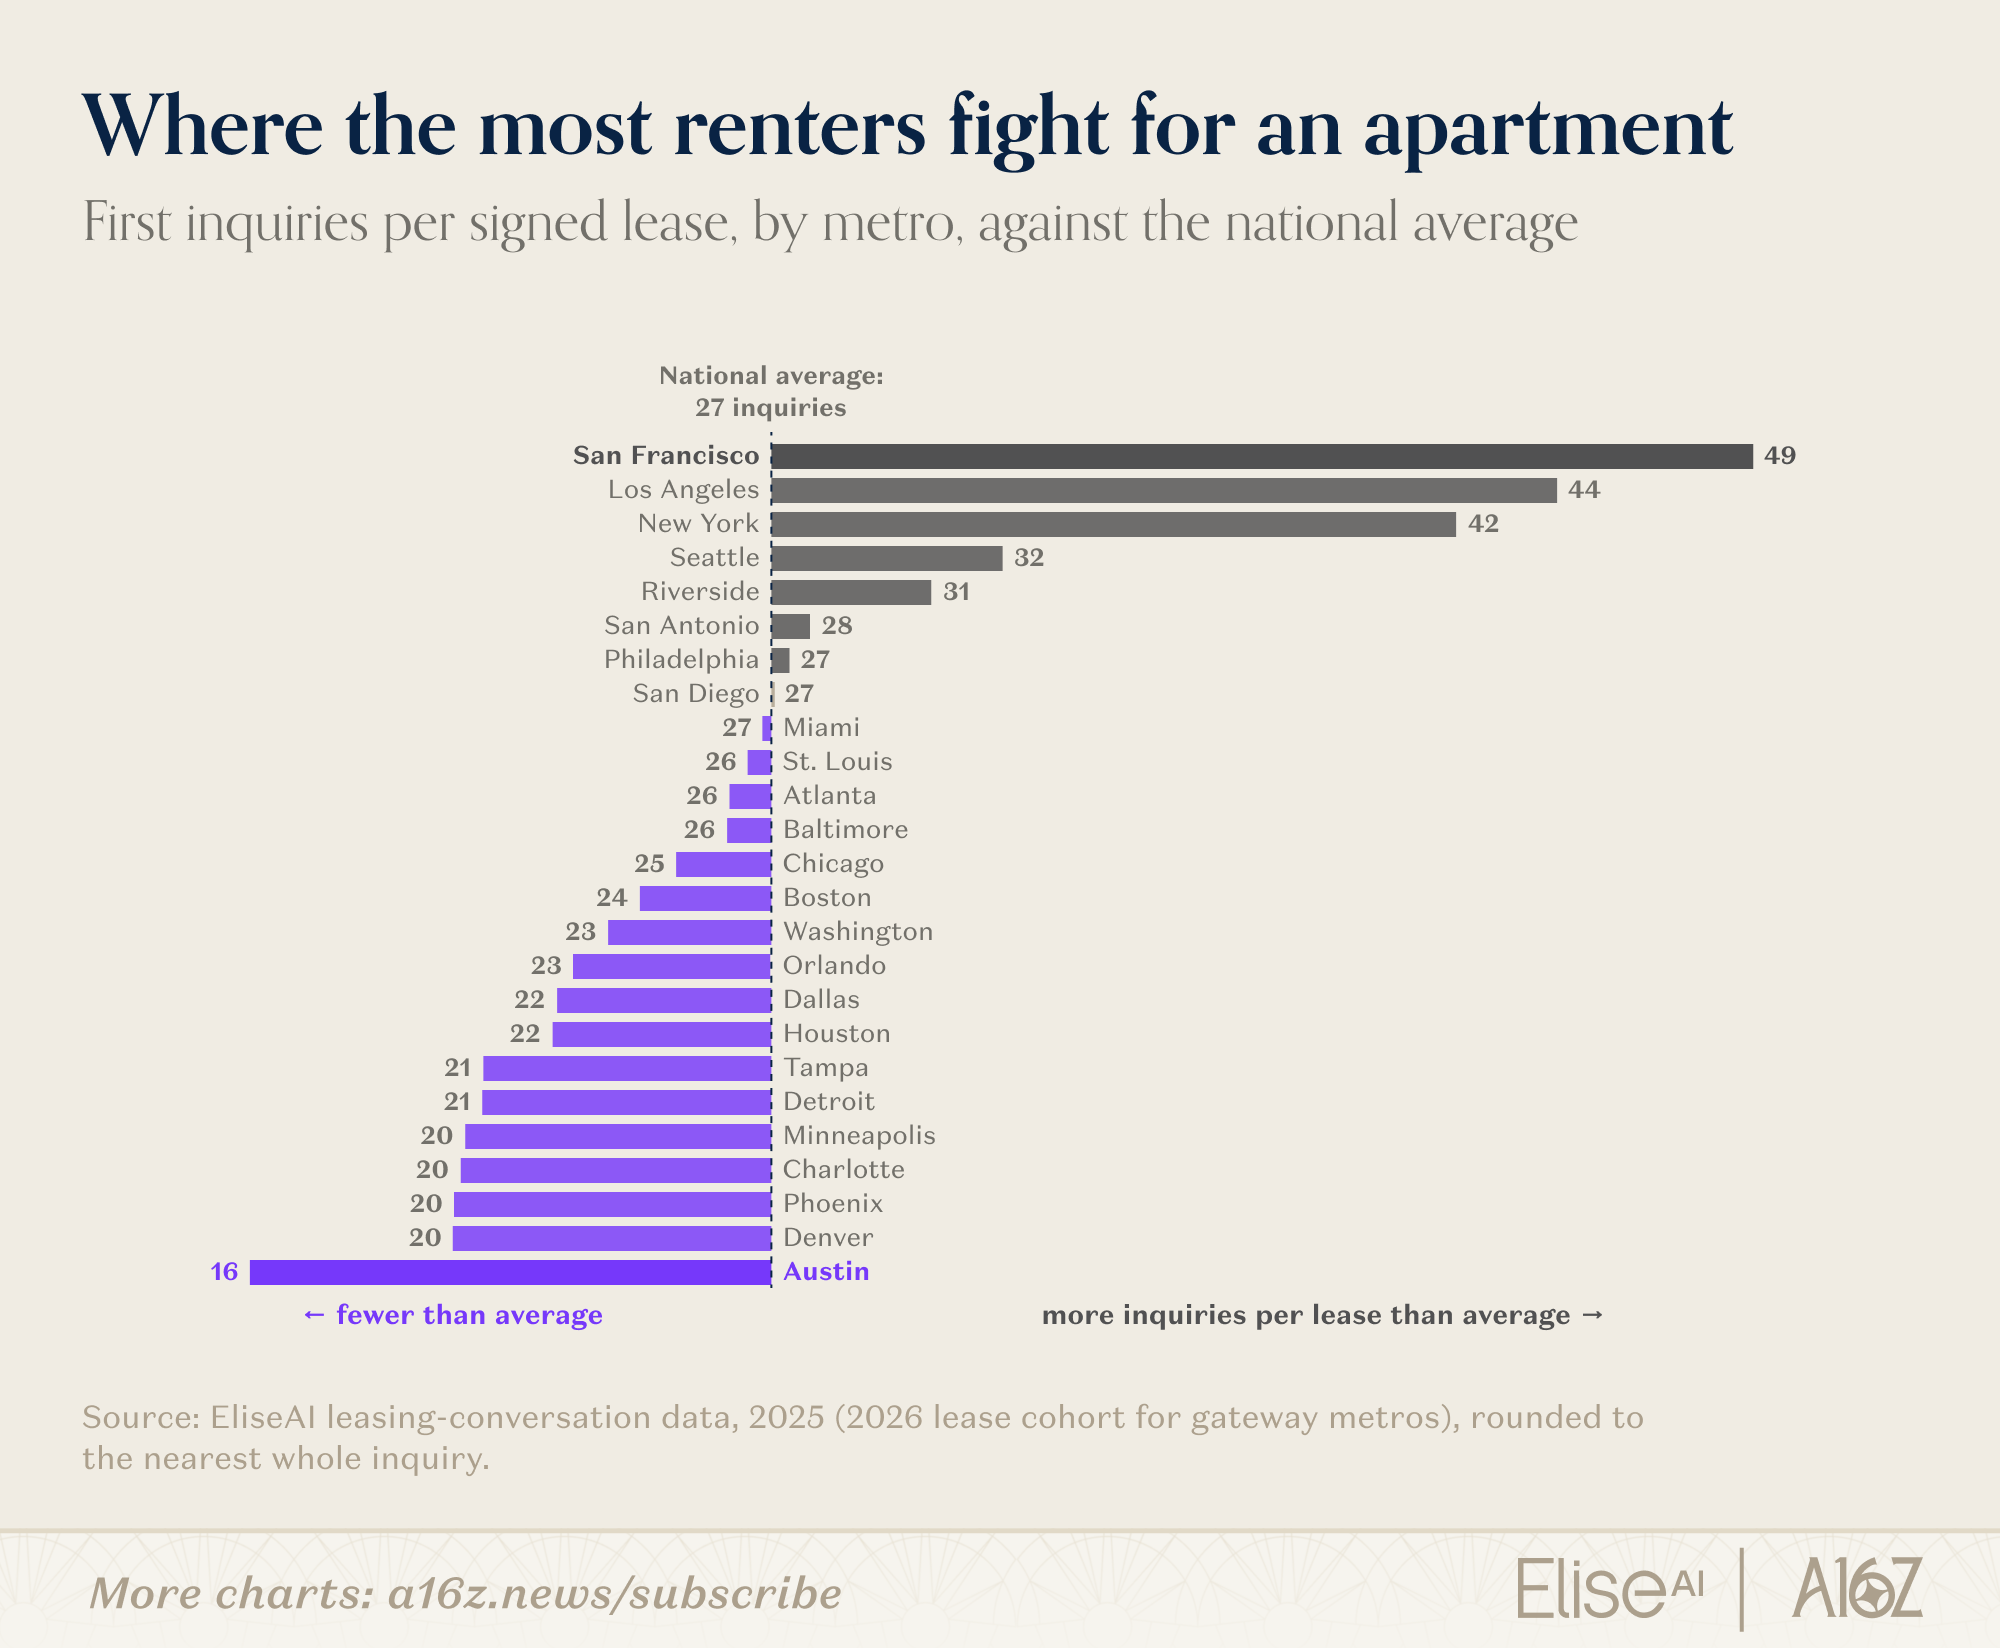
Behind every signed San Francisco lease stand 49 first inquiries. So for all of our SF readers, you and your 48 rivals almost double the national average. And once you’ve booked a tour, where you stumble depends on the coast.
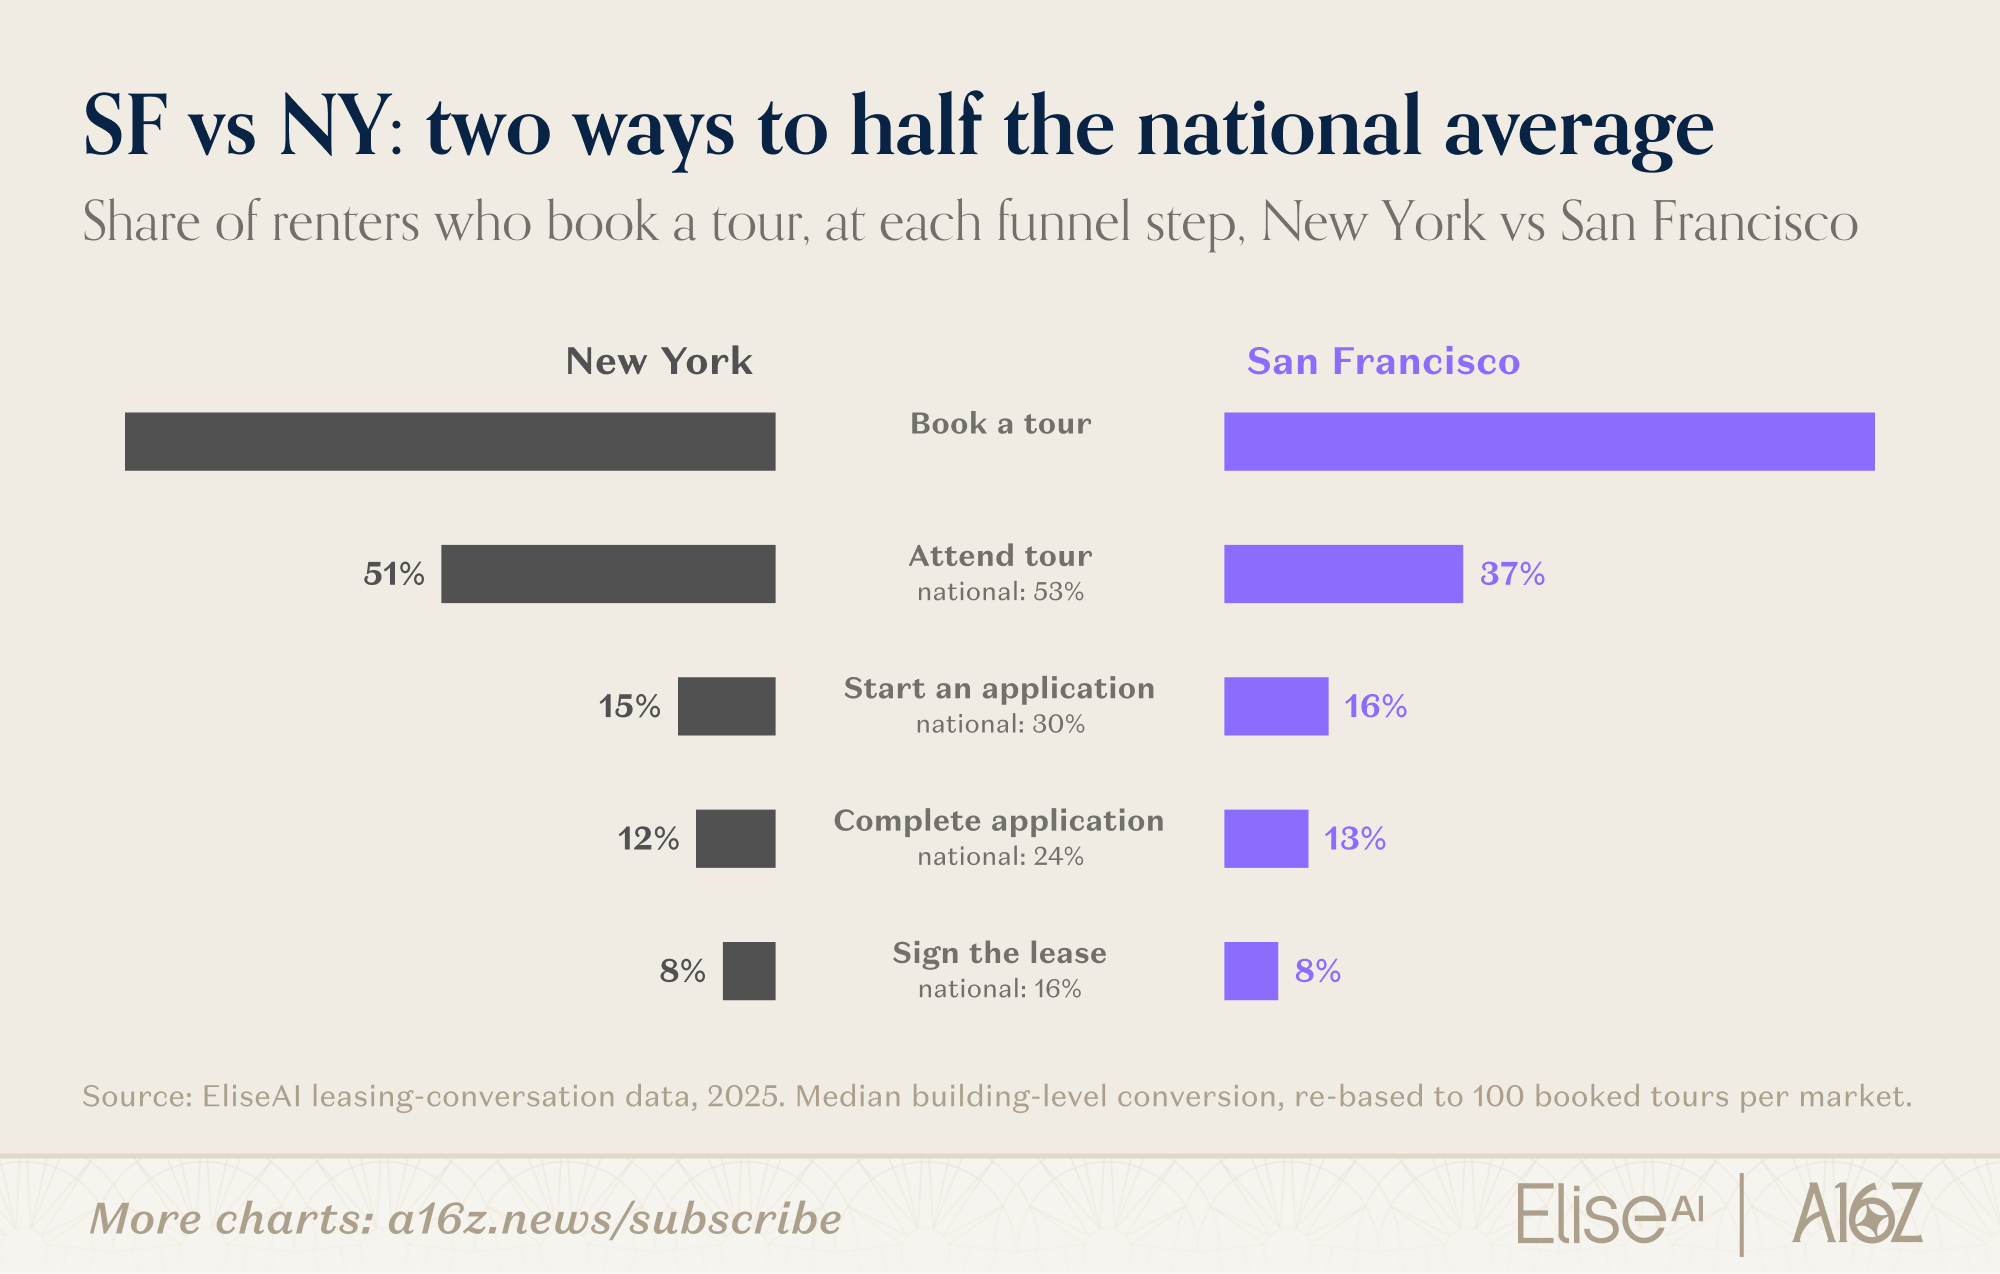
San Francisco’s hurdle is physical: only 37% of booked tours actually happen there, versus 53% nationally. New York’s hurdle is bureaucratic: tours happen at the national rate, 51% attend, and then the paperwork strikes. Just 15% of booked tours ever become a started application, half the national 30%. From there the two cities move in lockstep and finish in the same place: 8% of booked tours end in a signed lease in both markets, versus 16% nationally. Two different leaks, two different fixes, and the same narrow finish. The one stage that behaves the same everywhere is the form itself: wherever you rent, about four-in-five renters who start an application finish it. Most of the chaos and mess is upstream; getting people to the tour and onto the application at all. The funnel differences show up in what each city asks about.
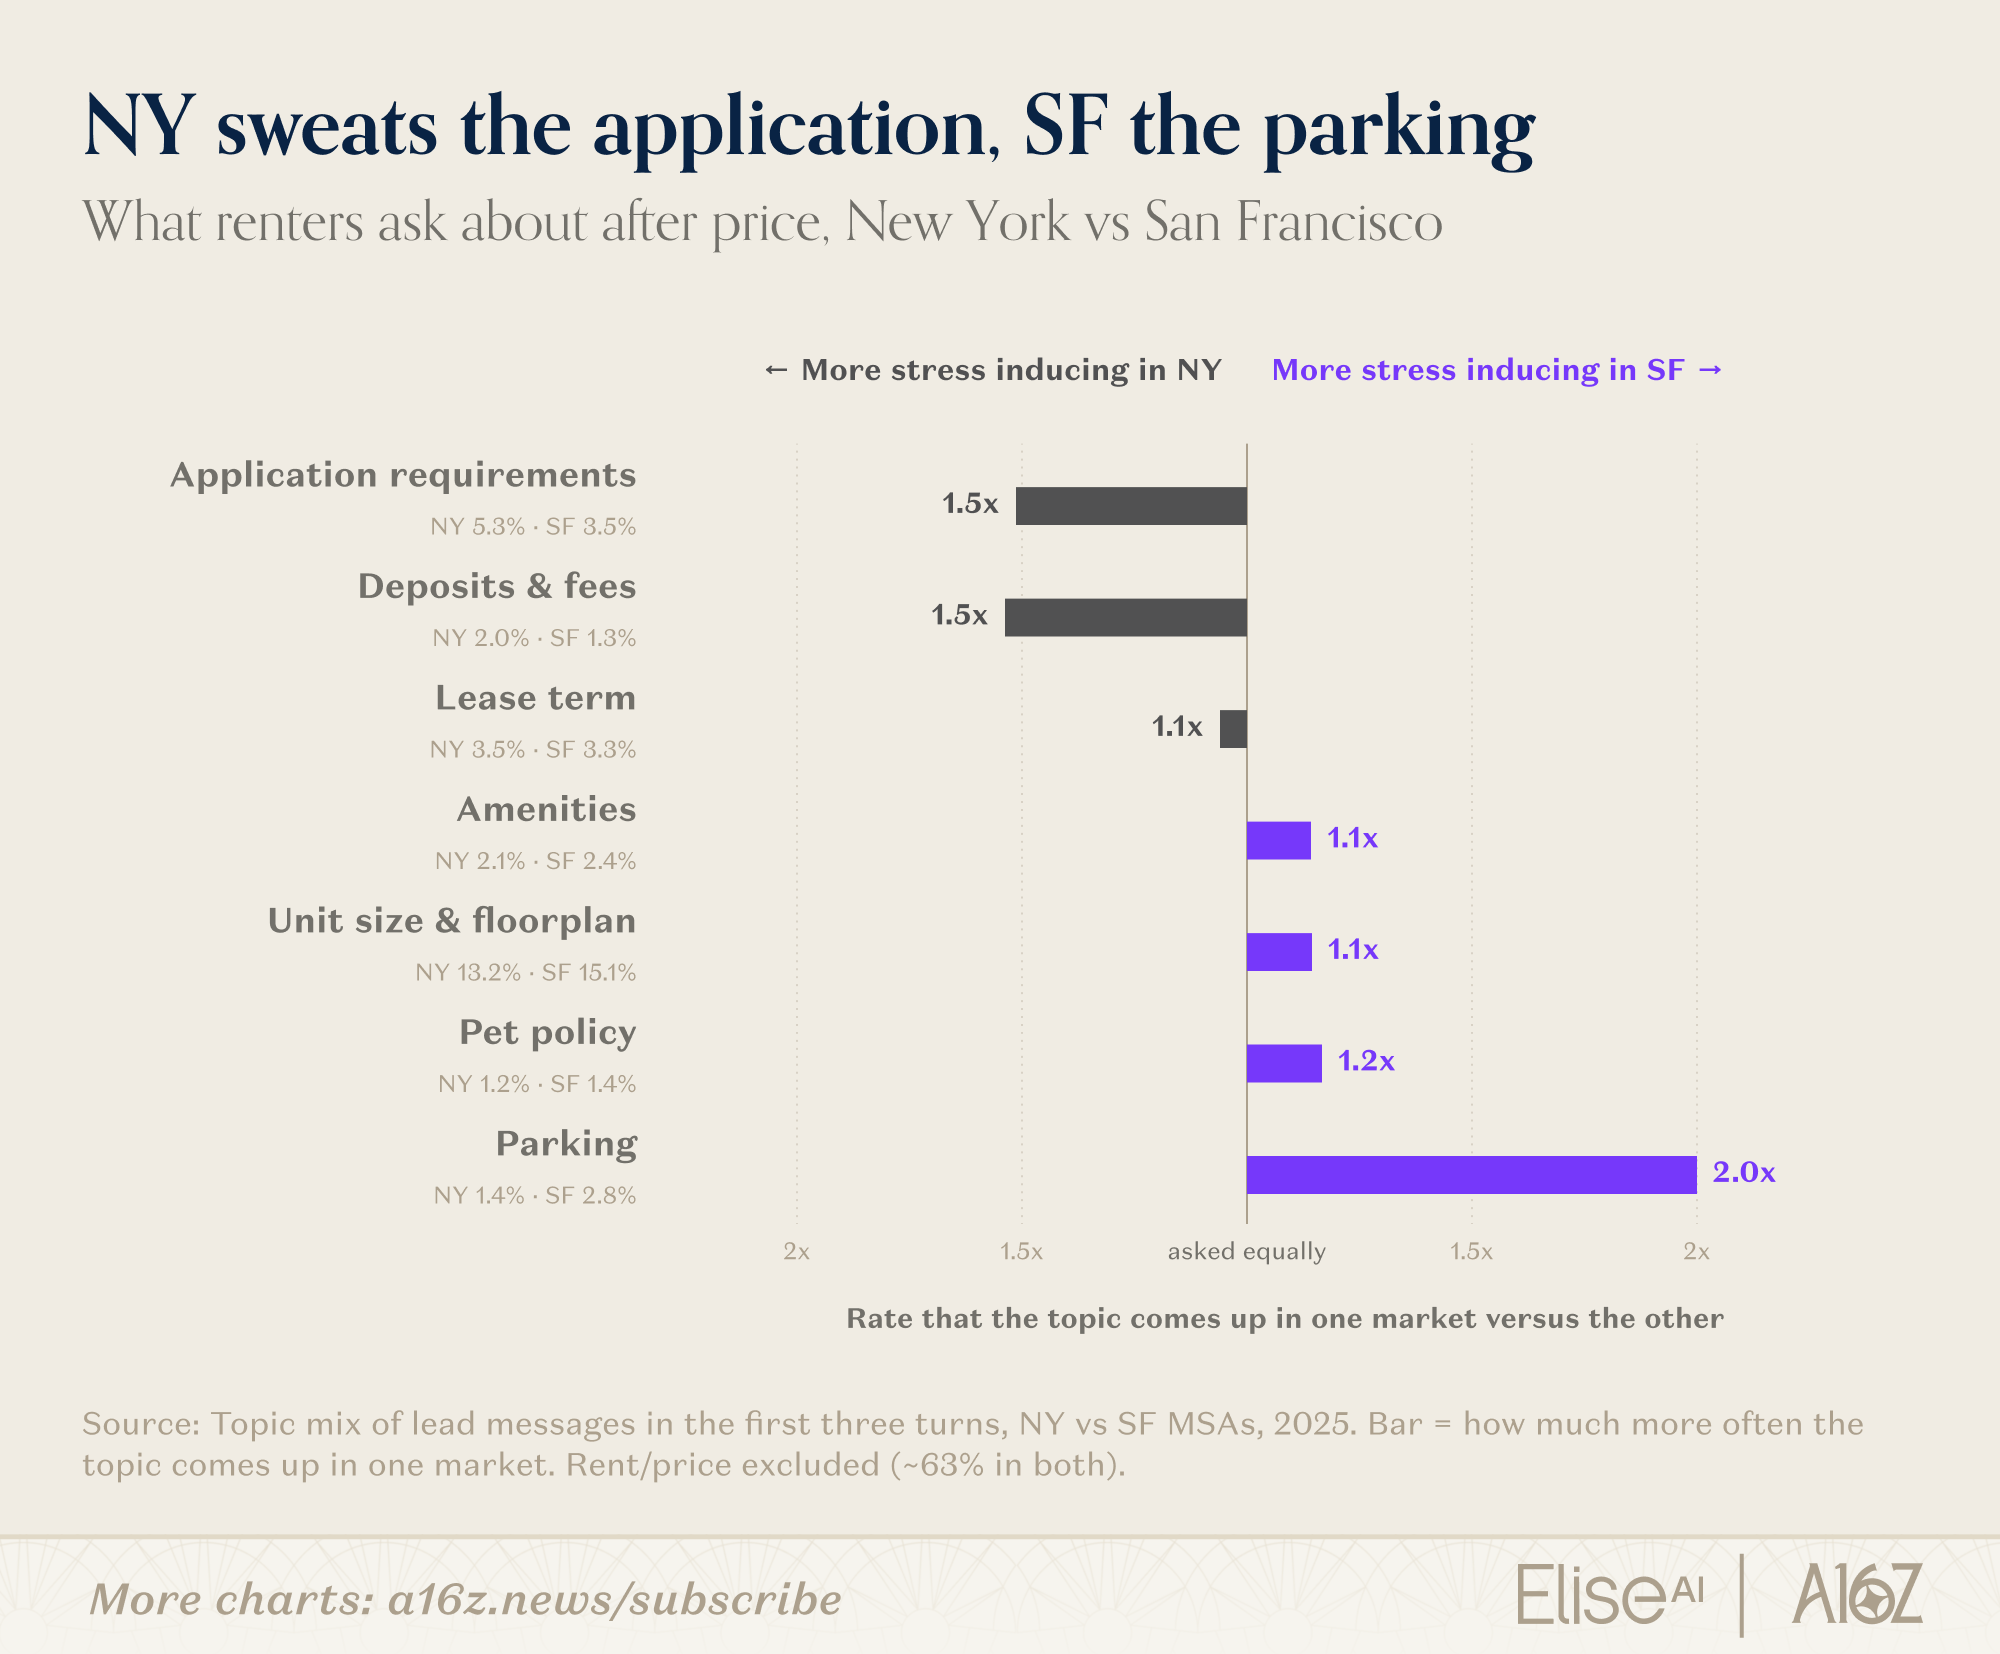
The two cities open on price at identical rates; the split arrives with the second question. New Yorkers sweat the application: income documentation, credit, guarantors. San Franciscans ask about parking and square footage. We’re all anxious, just about different things. New York’s paperwork fixation turns out to be one instance of a general rule.
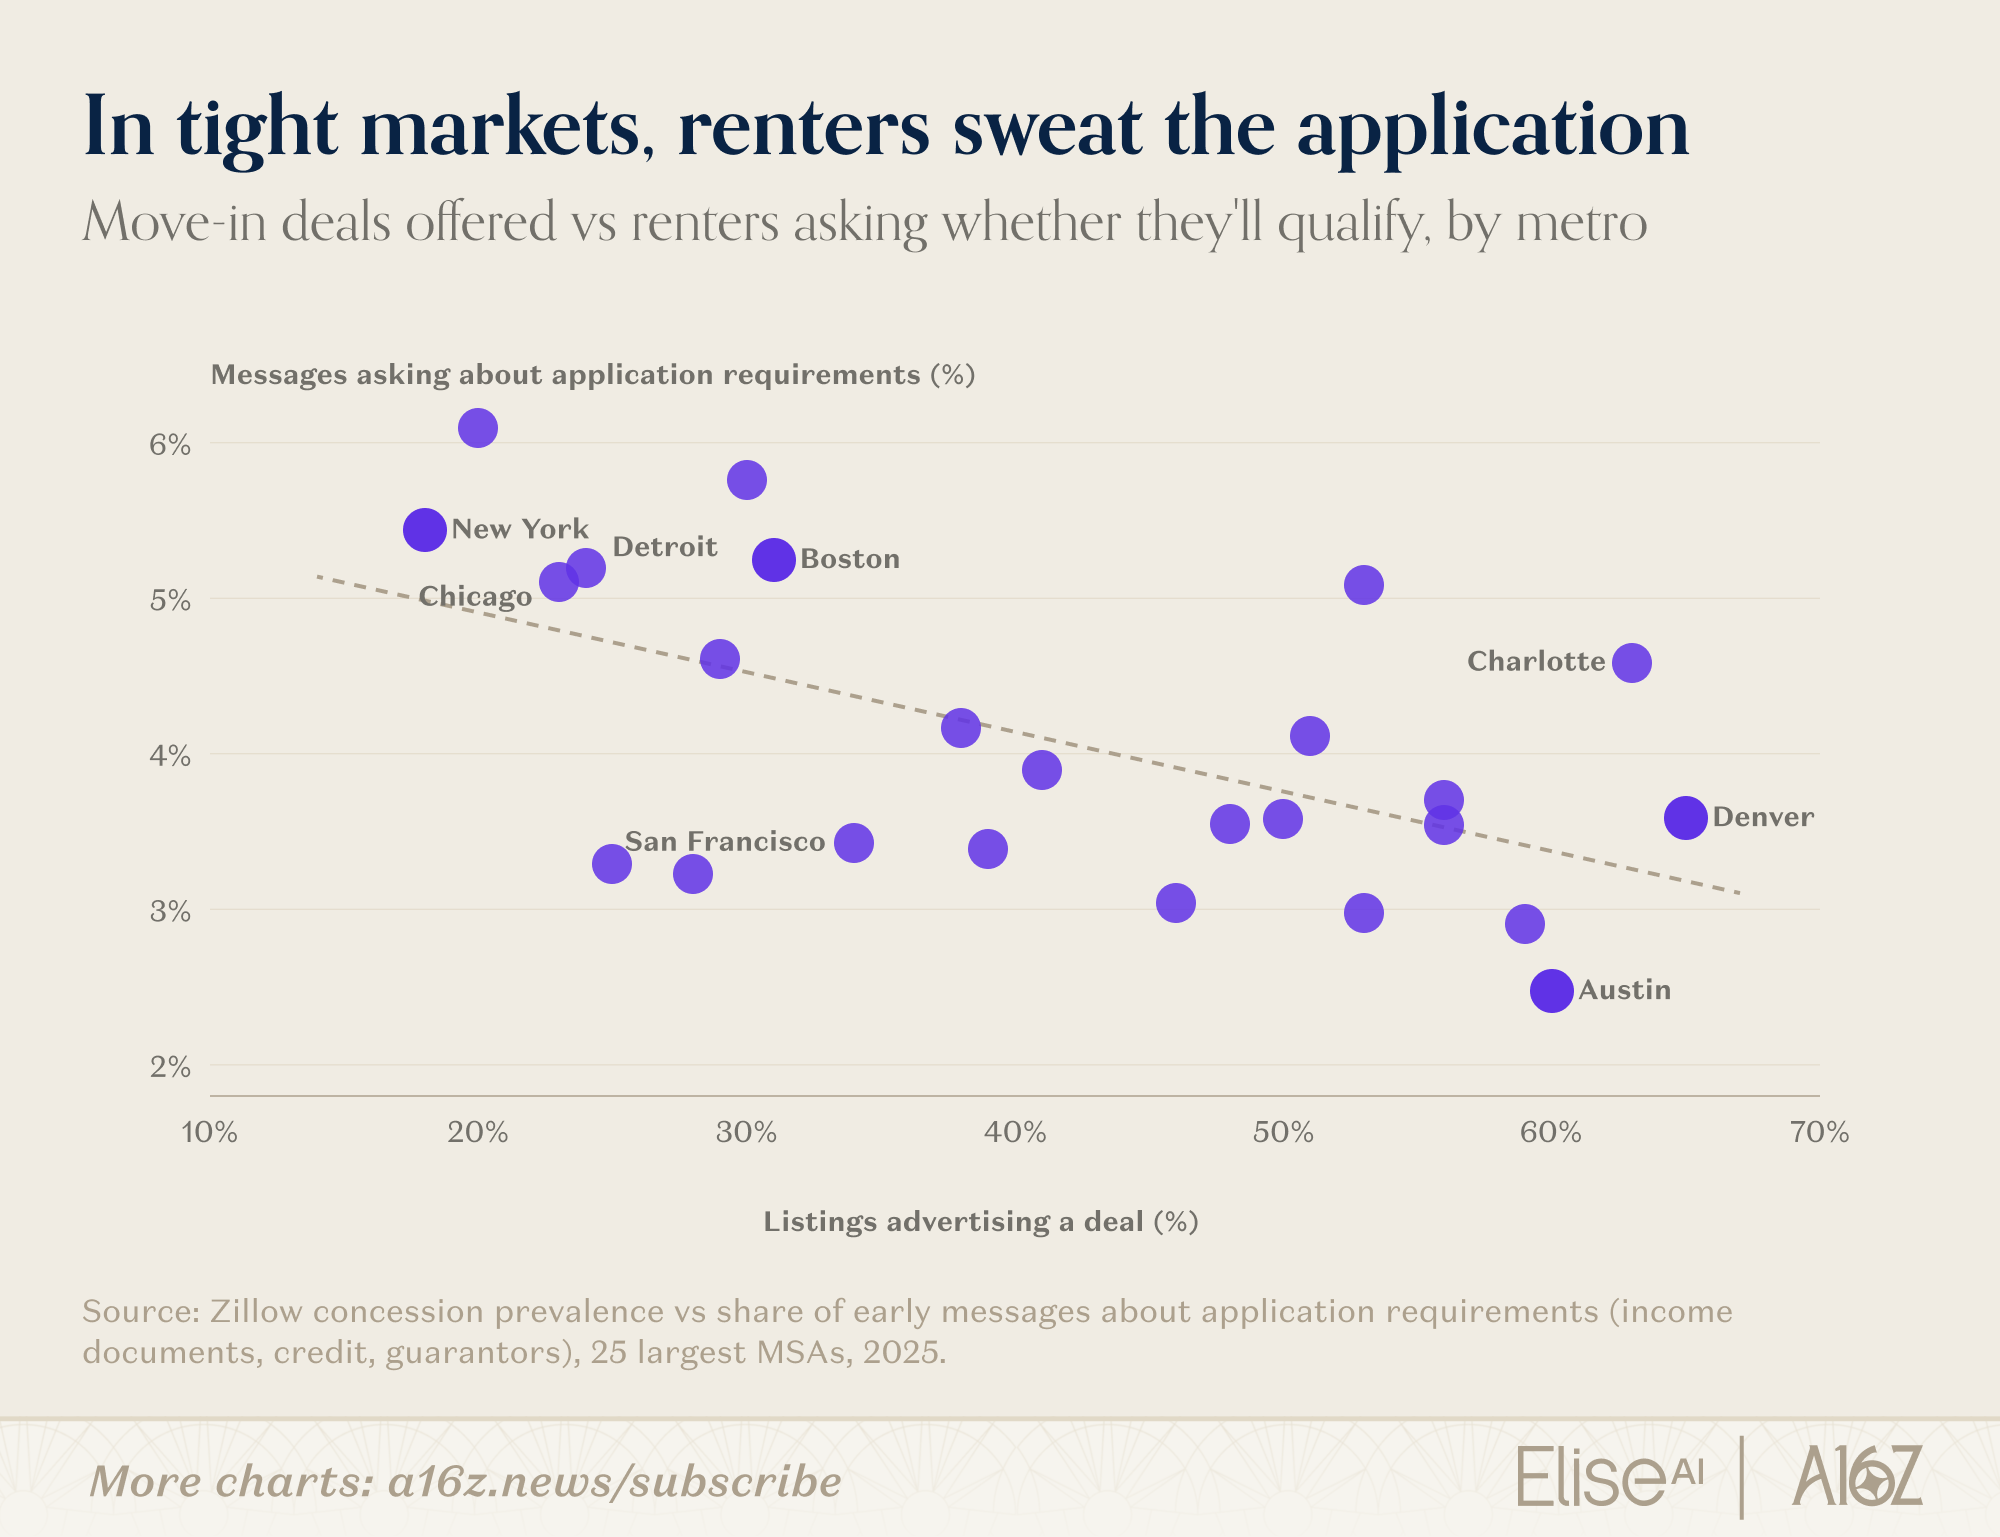
In tight markets, renters do not just ask what an apartment costs. They ask whether they will qualify for it. This may be the purest expression of rent anxiety in the whole dataset: the fear isn’t just price. It is the audition (and the rejection). Question intensity isn’t limited to just price. In fact, inquisitiveness is a market personality trait.
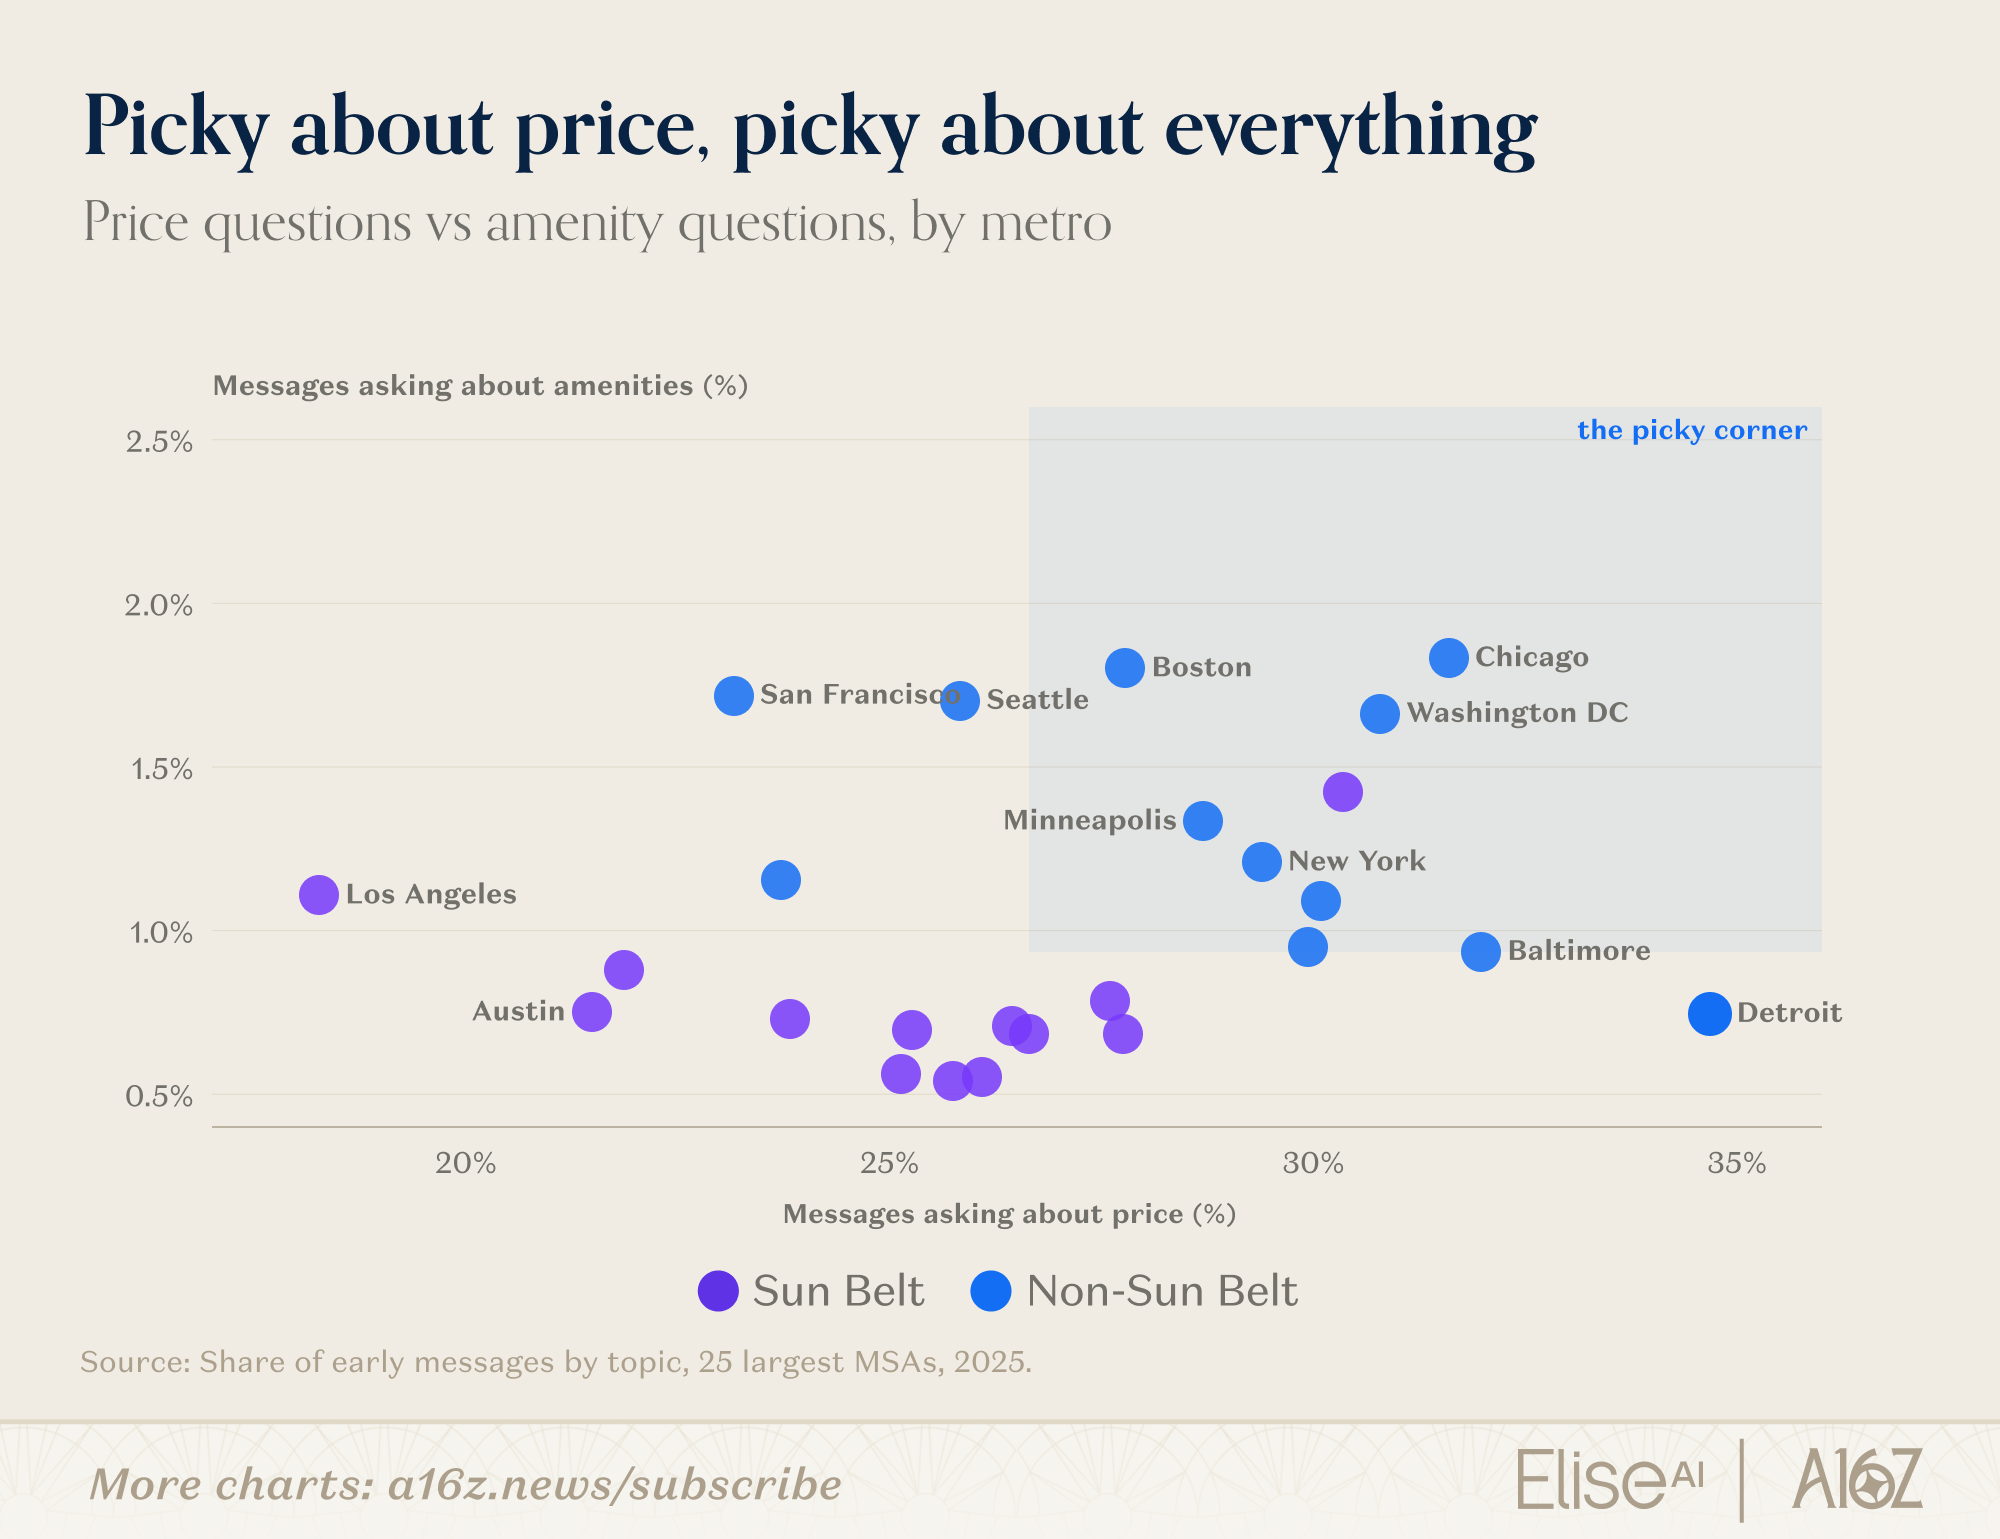
The metros that grill hardest on price also grill hardest on amenities. Interestingly, this isn’t just a graph of income. One interrogation, many subjects, and the intense corner of the chart is almost entirely non-Sun Belt.
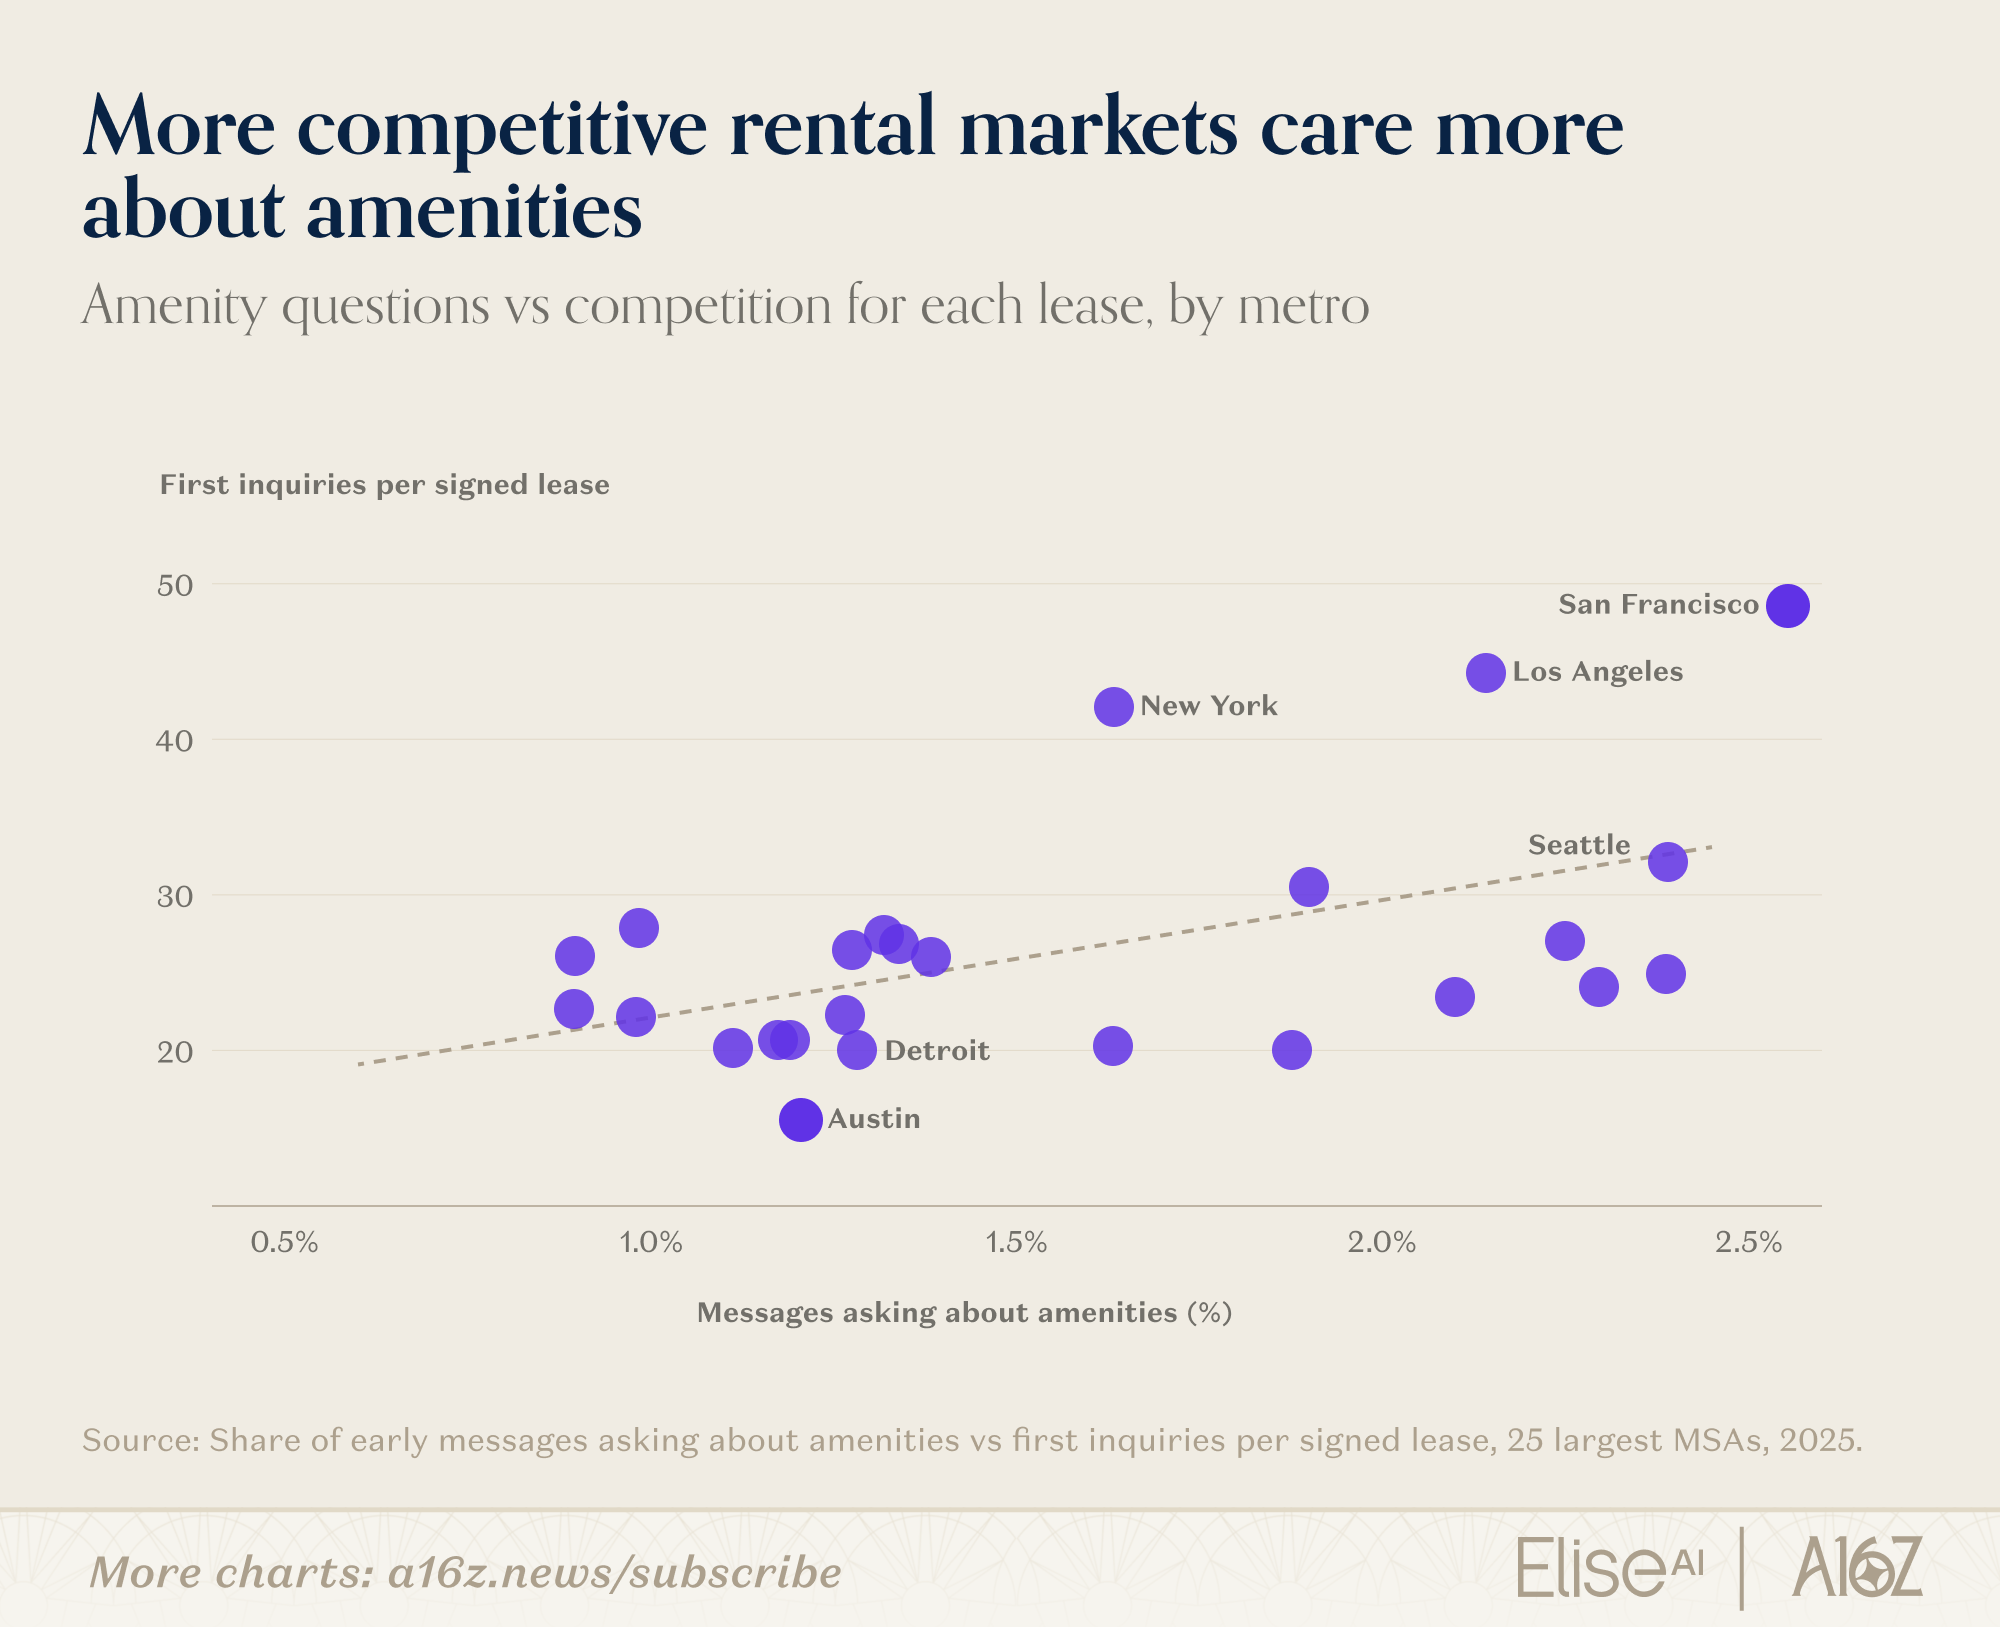
Amenity questions carry their own surprising signal: the metros asking most about gyms, pools, and rooftops are the metros stacking the most inquiries behind each signed lease. Asking about the pool is not idle browsing. You could read it as value-checking, making sure an expensive apartment earns its rent, but the pattern tracks competition, not price: in crowded markets, renters ask everything up front because they may not get a second conversation.
Before moving in, renters ask about the gym, the pool, and the rooftop. But, once they move in, conversations become about what goes wrong.
EliseAI powers maintenance workflows for apartment buildings (fielding requests like work orders, in industry speak), which makes this dataset a running census of what actually breaks in American apartments. When shit goes wrong, well … shit goes wrong. Plumbing, together with appliances and HVAC, makes up nearly half of all maintenance.
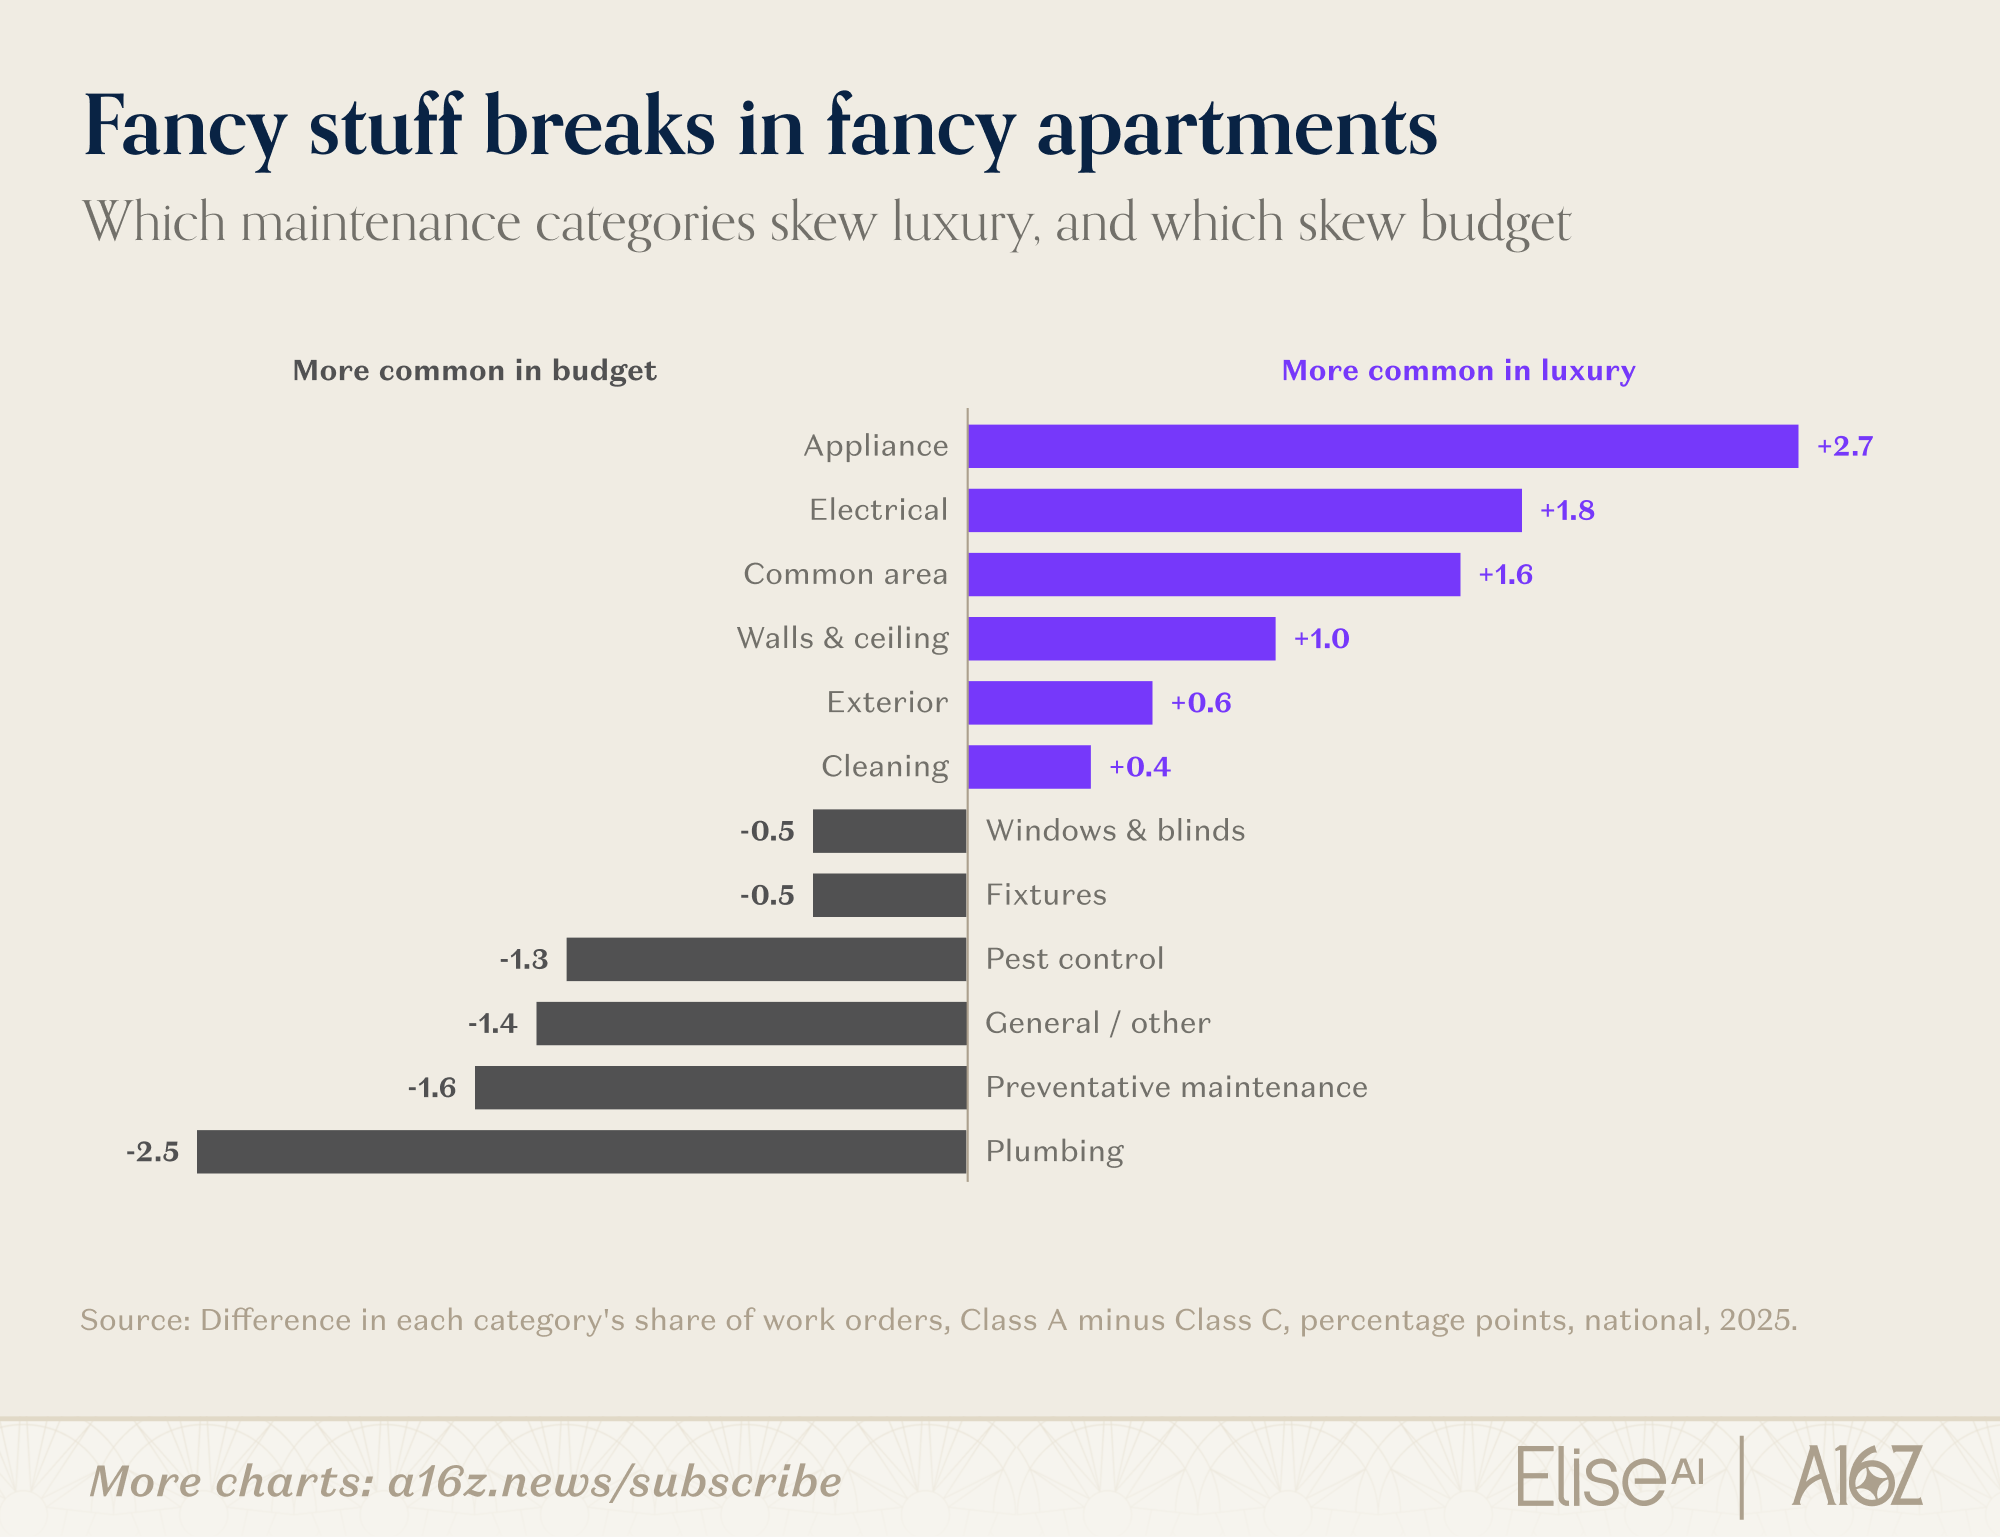
Breaking things even has class personalities. Luxury buildings log more appliance, electrical, and common-area tickets. Budget buildings log more pipes and pest control.
One more cut before the finale: loyalty. Once renters get in the door, who stays?
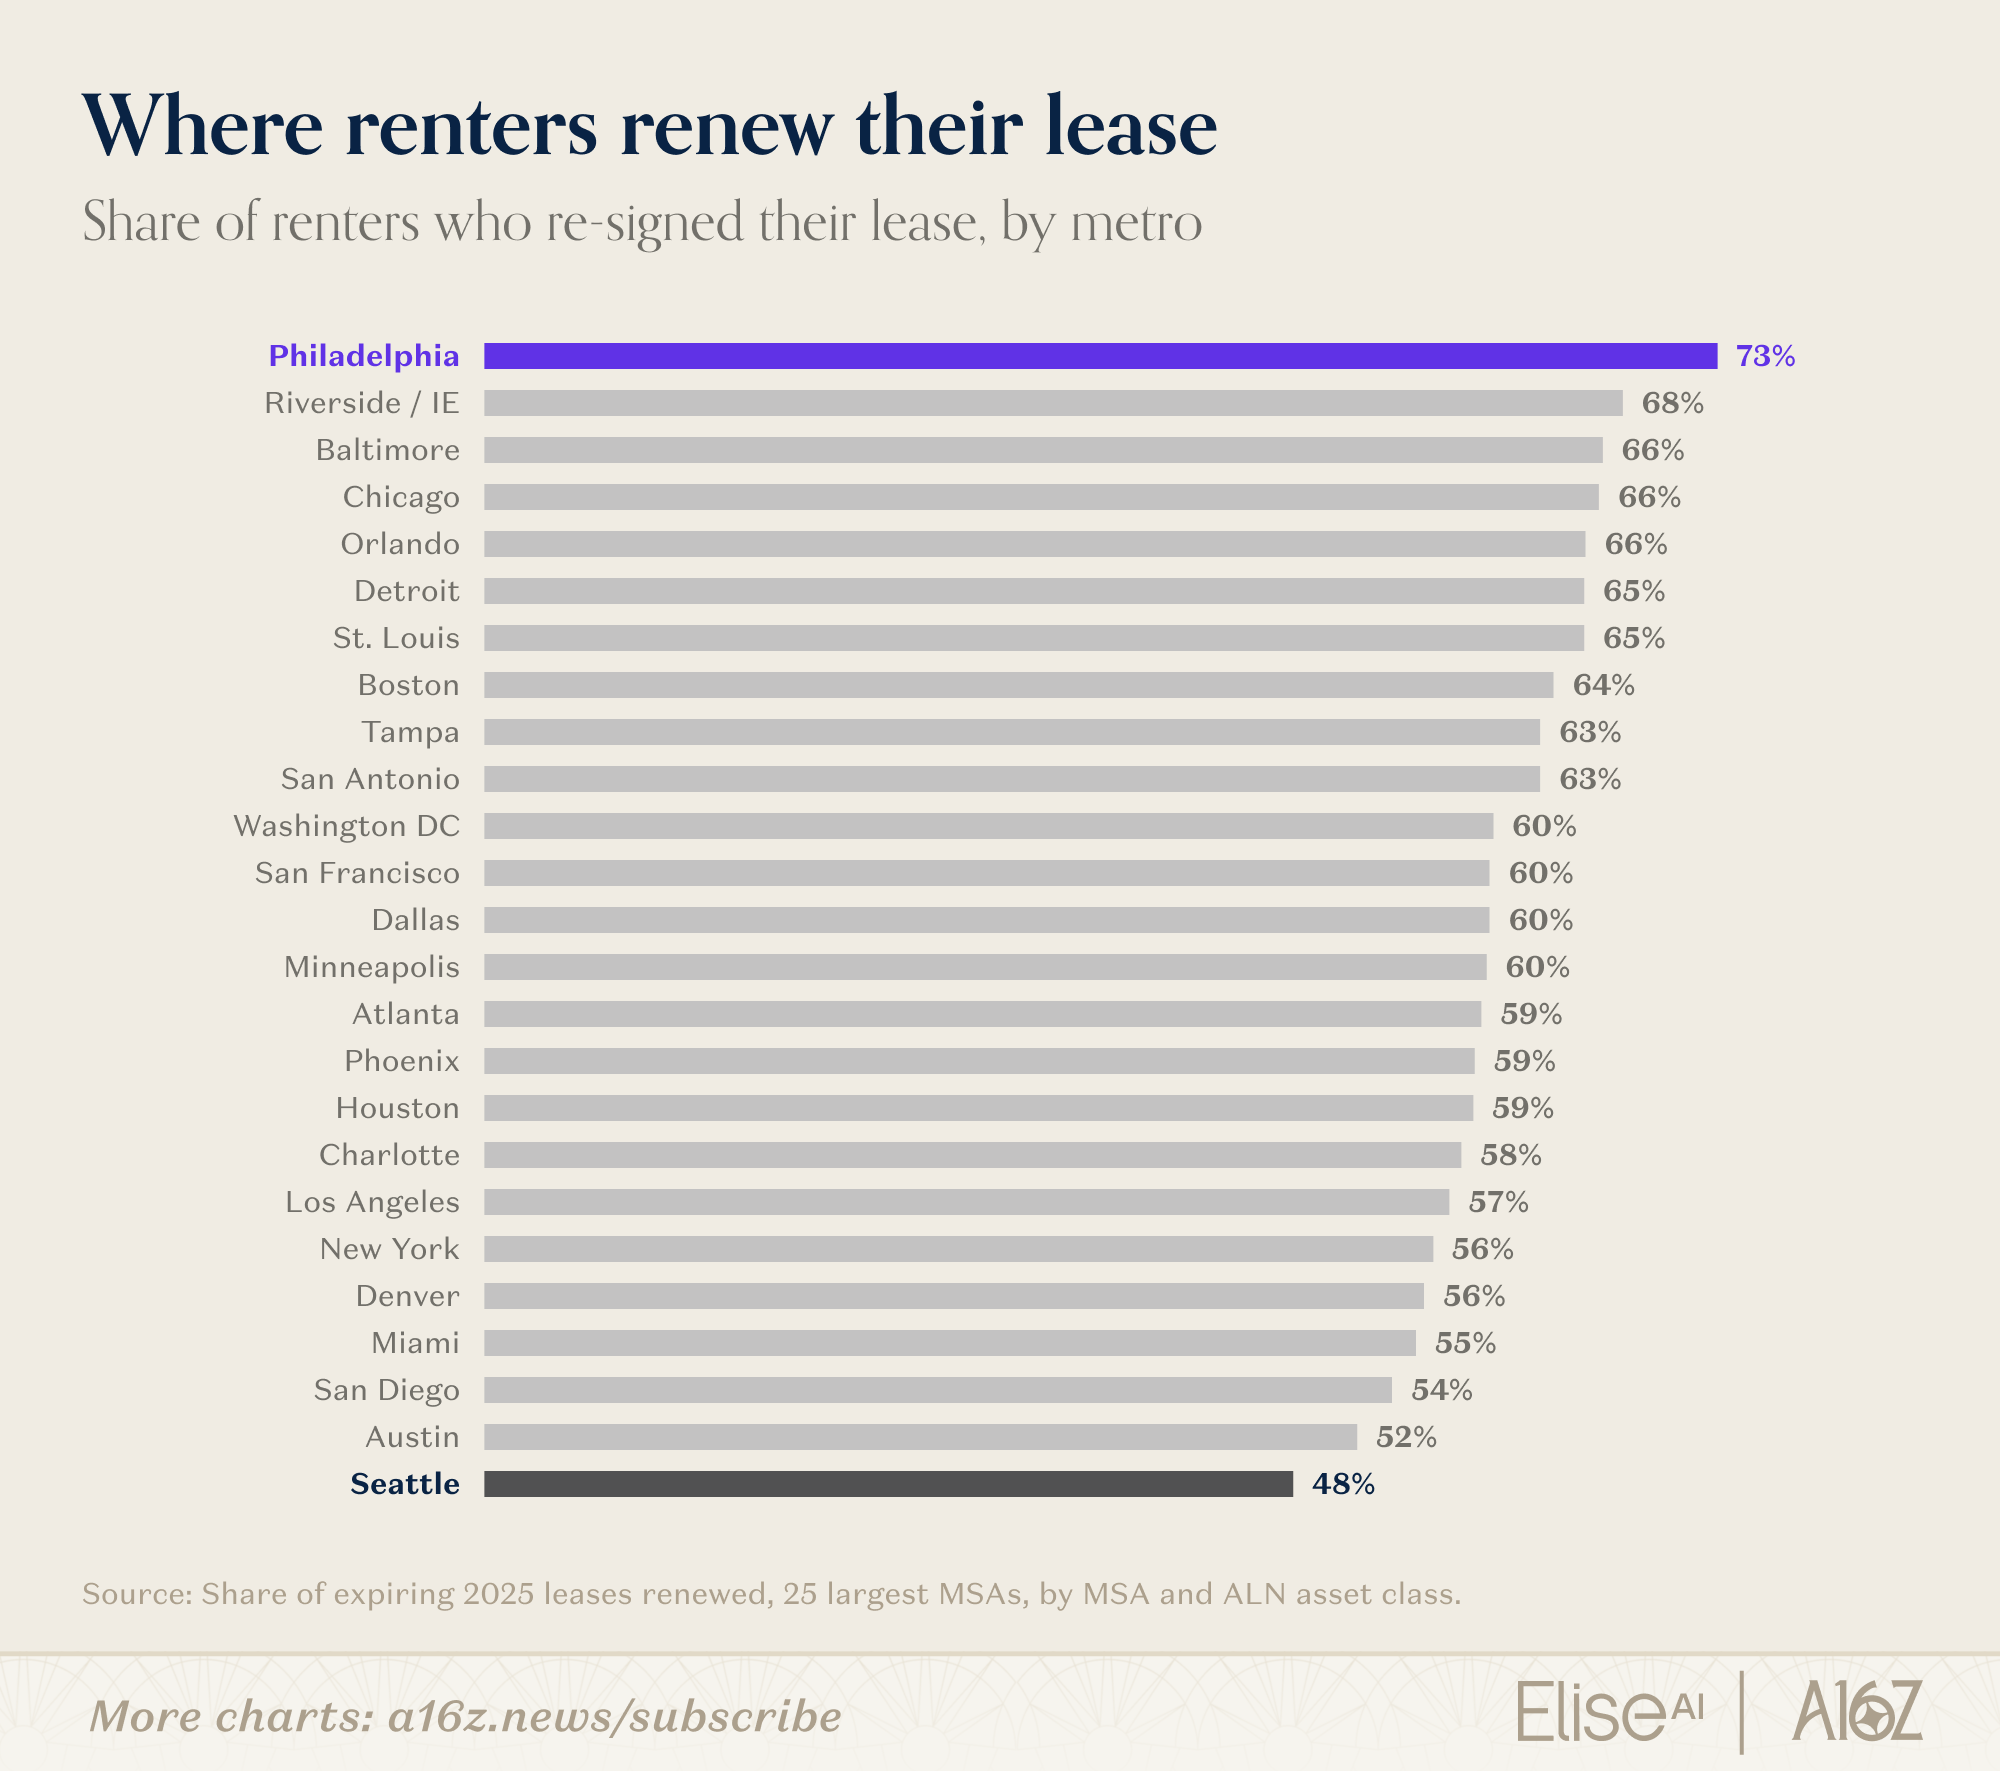
Notice that the anxious Northeast and Midwest metros cluster near the top of the loyalty table. Renewal rates also climb down the price ladder, from 57% in Class A to 63% in Class C. The renters who fought hardest to get an apartment (and a deal) hold on to it most. Anxiety and loyalty are partially two sides of the same coin.
So the market is anxious, crowded, leaky, awake past midnight, and, once settled, loyal. That’s one story. Here’s the other: how AI, quietly and quickly, started changing that entire search.
The data suggests that this is one of the clearest examples of the general public embracing AI in a major life decision, and doing it at scale. EliseAI now powers renter interactions for roughly one in six U.S. rental apartments and has engaged tens of millions of unique renters through those conversations over the past few years.
As a16z GP, Alex Immerman put it, “Finding a home is high-stakes, deeply personal, and often stressful. The strongest evidence of AI adoption is what people actually trust AI to help them do. This data shows millions of renters using AI to ask questions, compare options, and navigate the process of finding a home. The richness of these increasingly multi-channel conversations shows how quickly comfort and trust are growing. It’s exciting to see AI meet people where they are and deliver genuine value in the life decisions that matter most.”
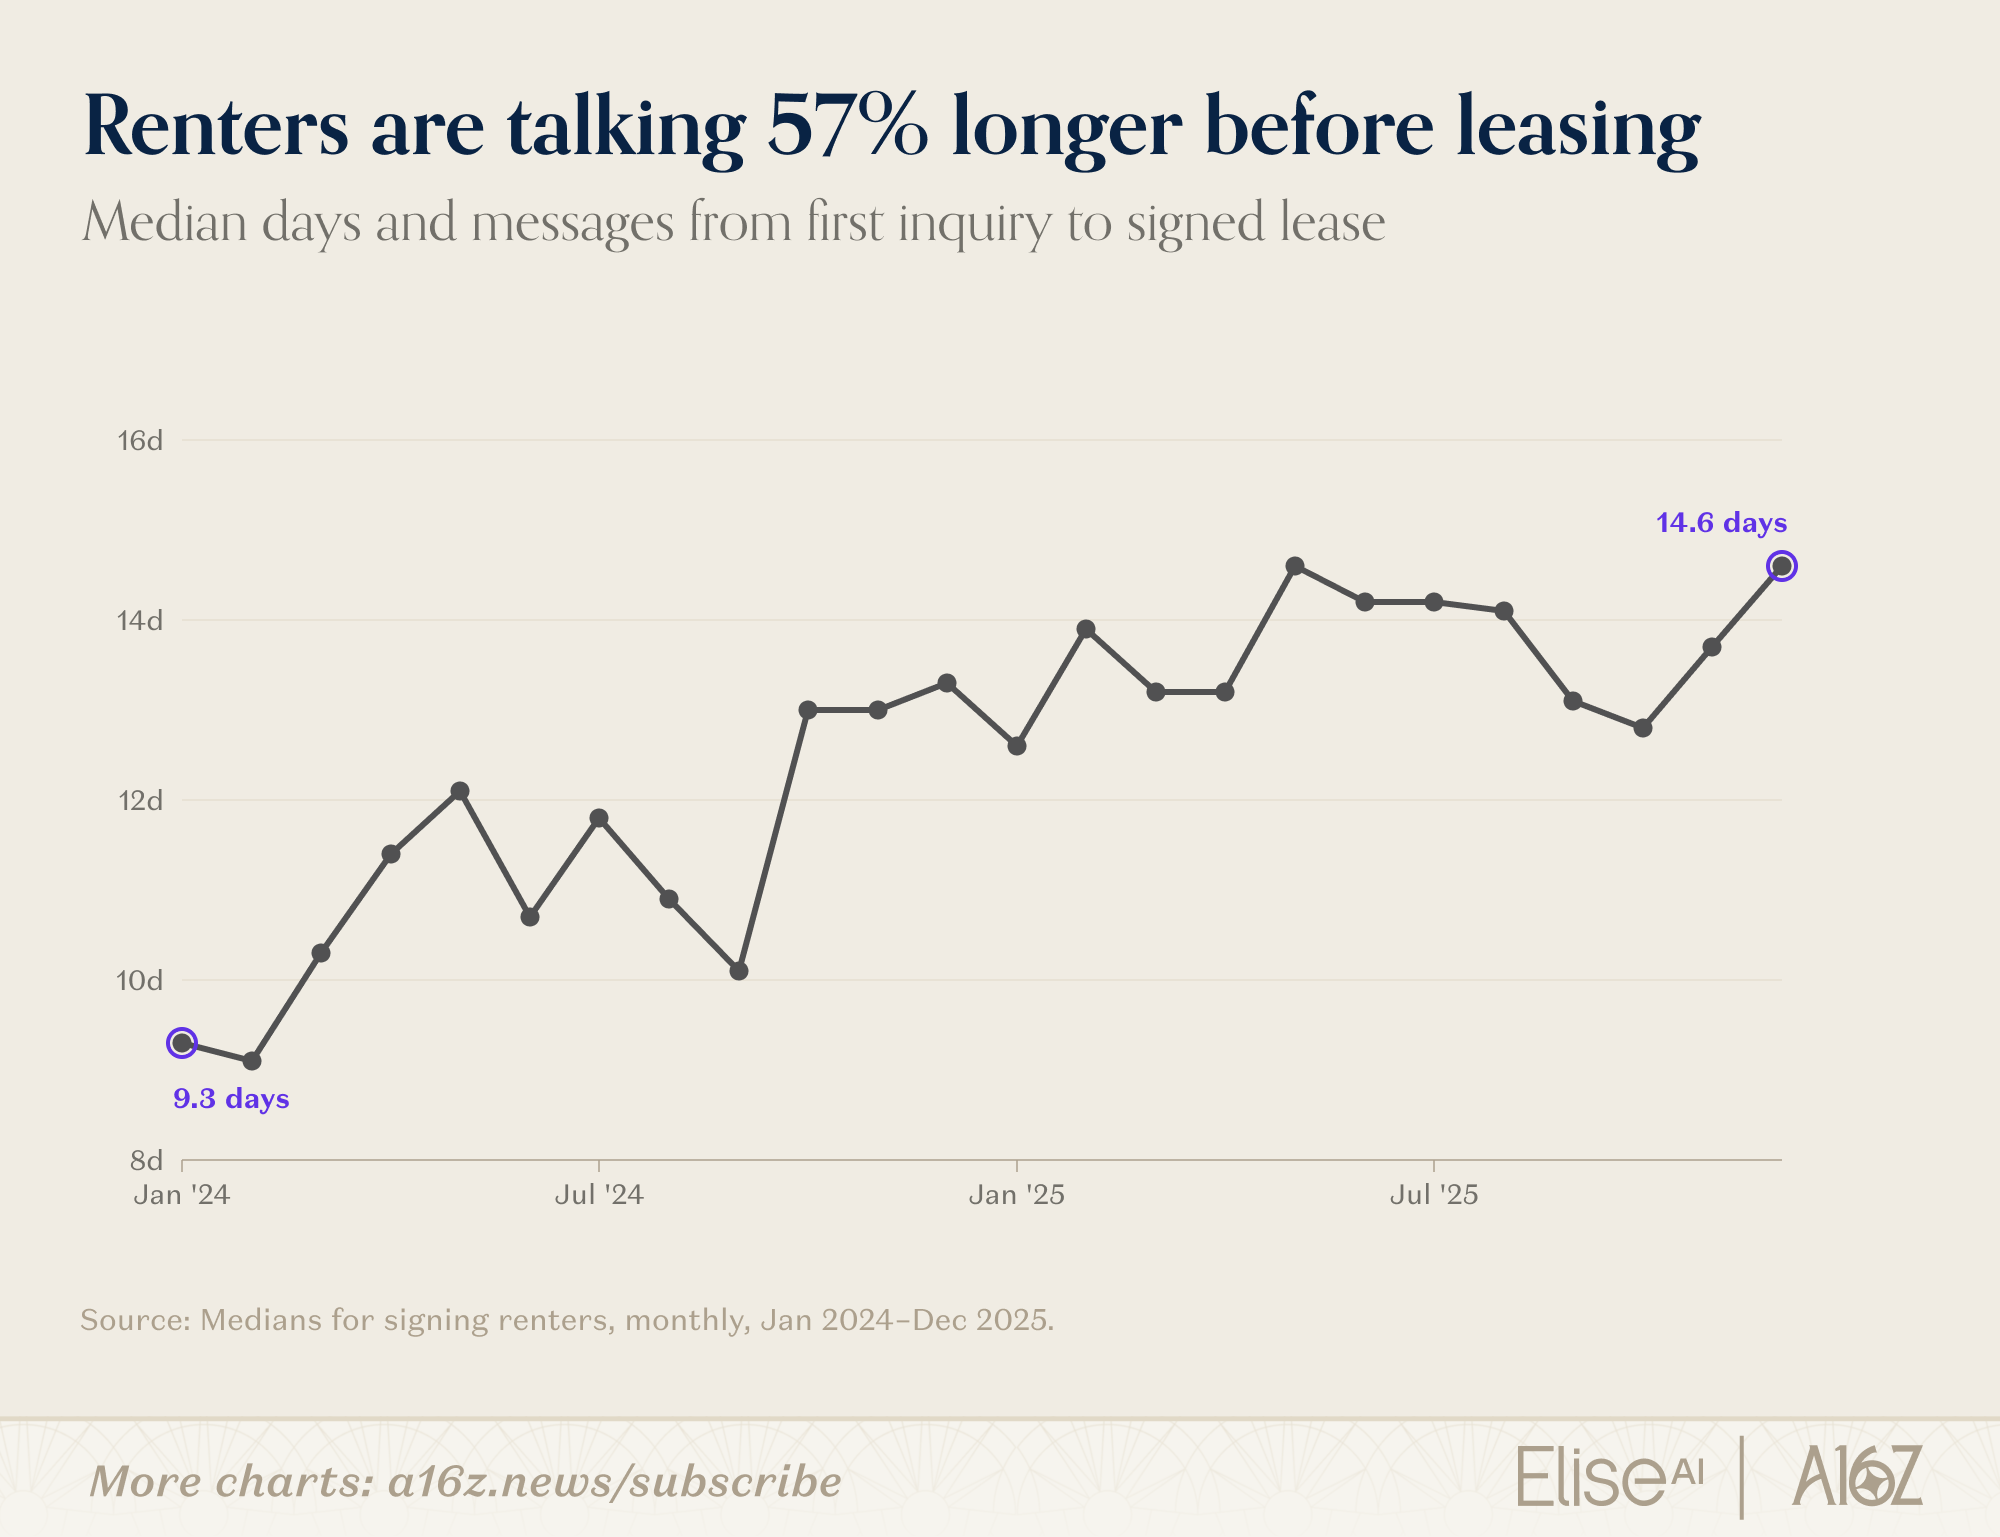
That growing comfort shows up in the shape of renter conversations. AI is making them longer, richer, and available across channels—including voice. In early 2024, the median journey from first message to signed lease ran about 9 days and 3 messages. By late 2025: 14 to 15 days, and 7 messages. More conversations give renters more chances to ask, compare, and clarify before committing. Renting an apartment is becoming less like a transactional purchase and more like a correspondence, with more questions and more comparison along the way.
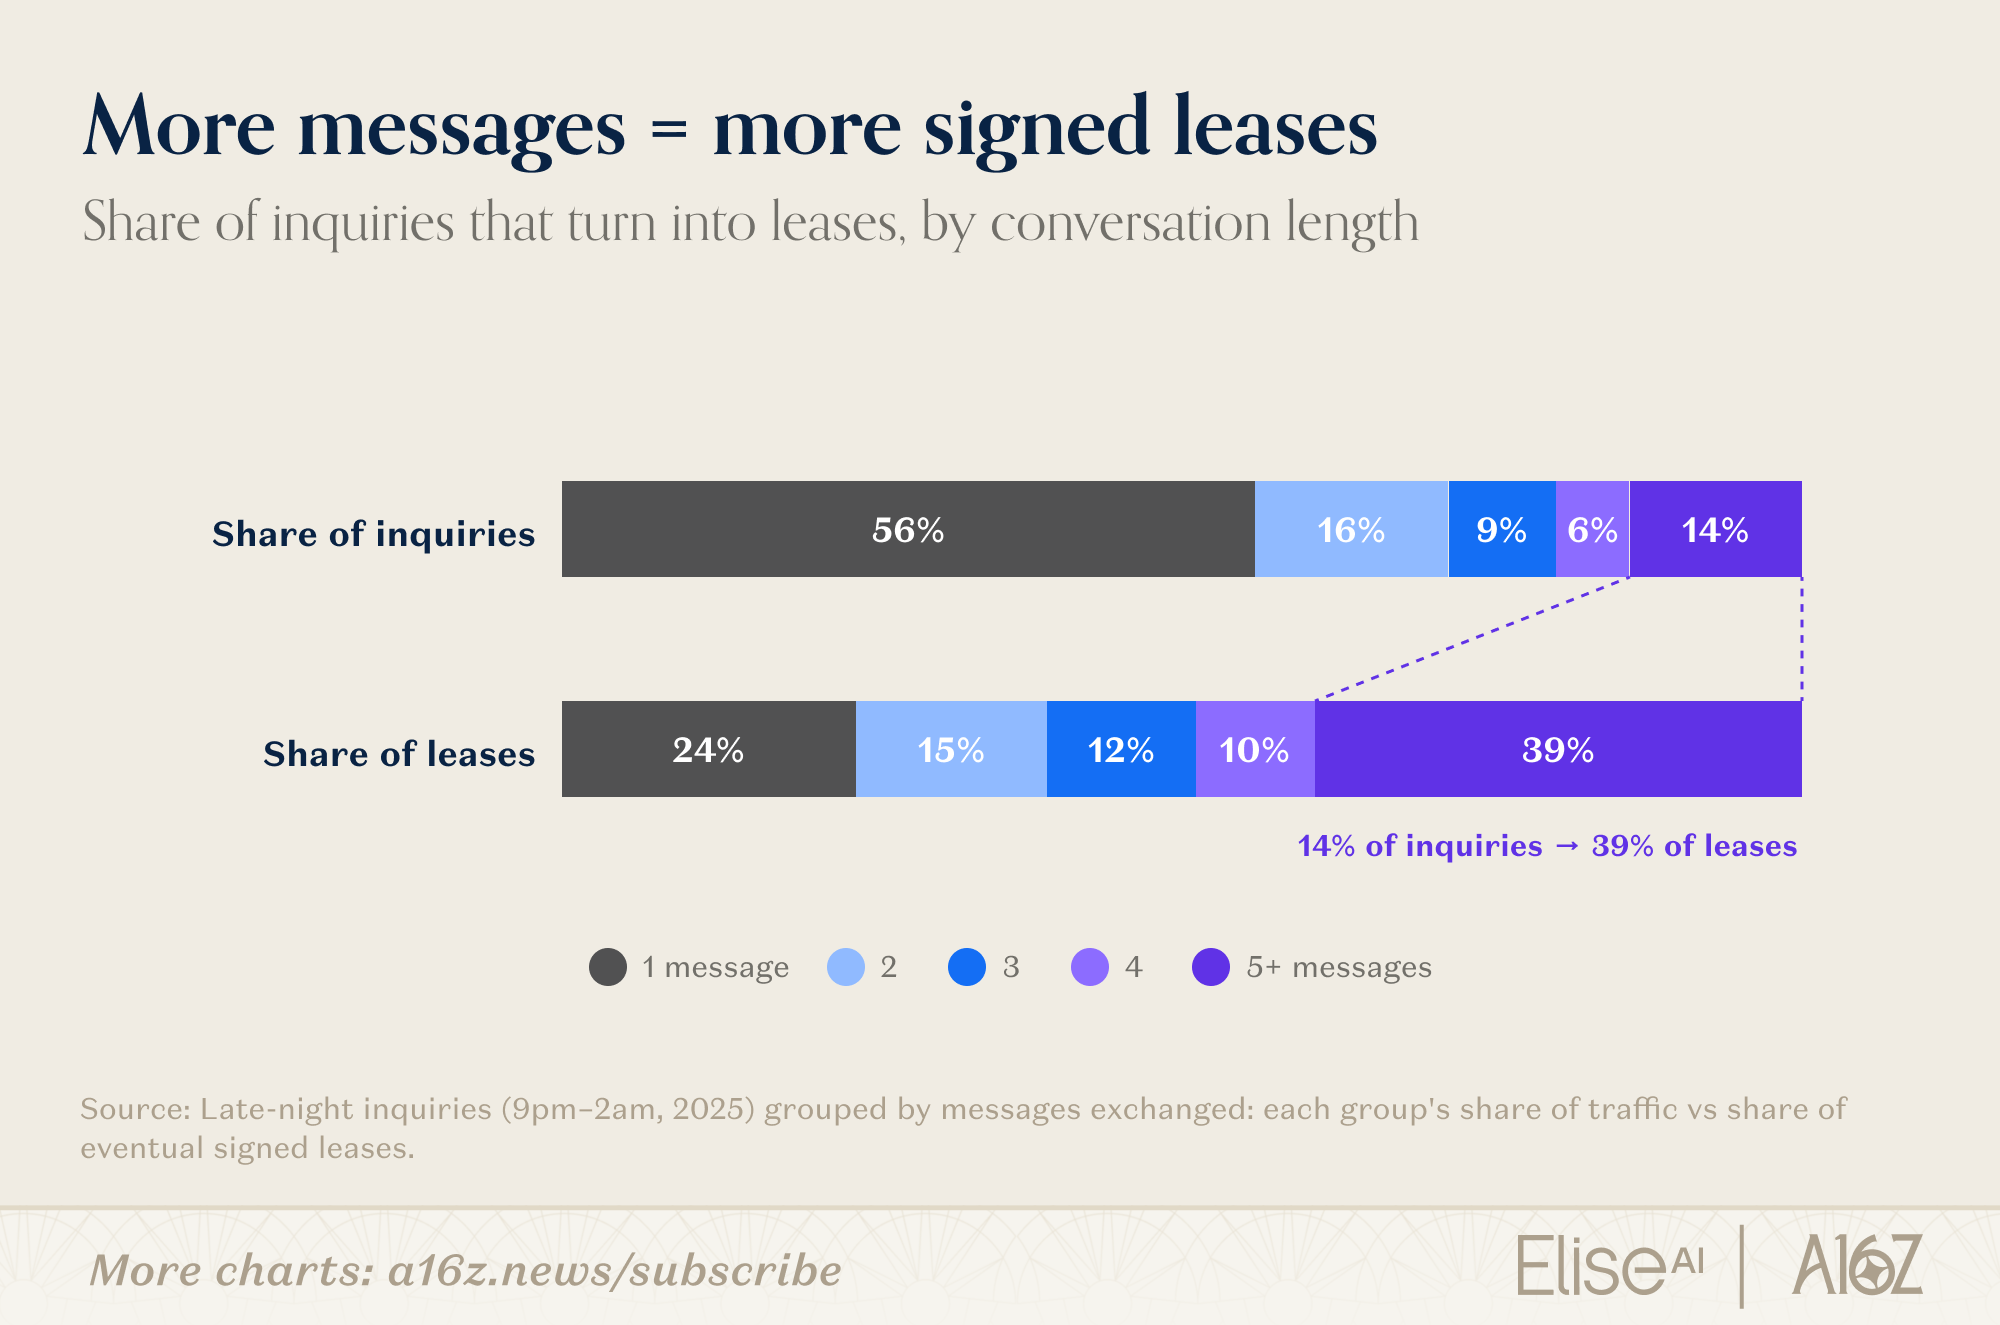
Those extra conversations matter: the talkers are the signers. Most inquiries stop after a single message, and on sheer volume still produce a quarter of the leases. But the conversations that reach five or more messages make up 14% of traffic and 39% of its leases. Depth is how the crowd gets sorted, and someone, or some system, has to be available to do the sorting.
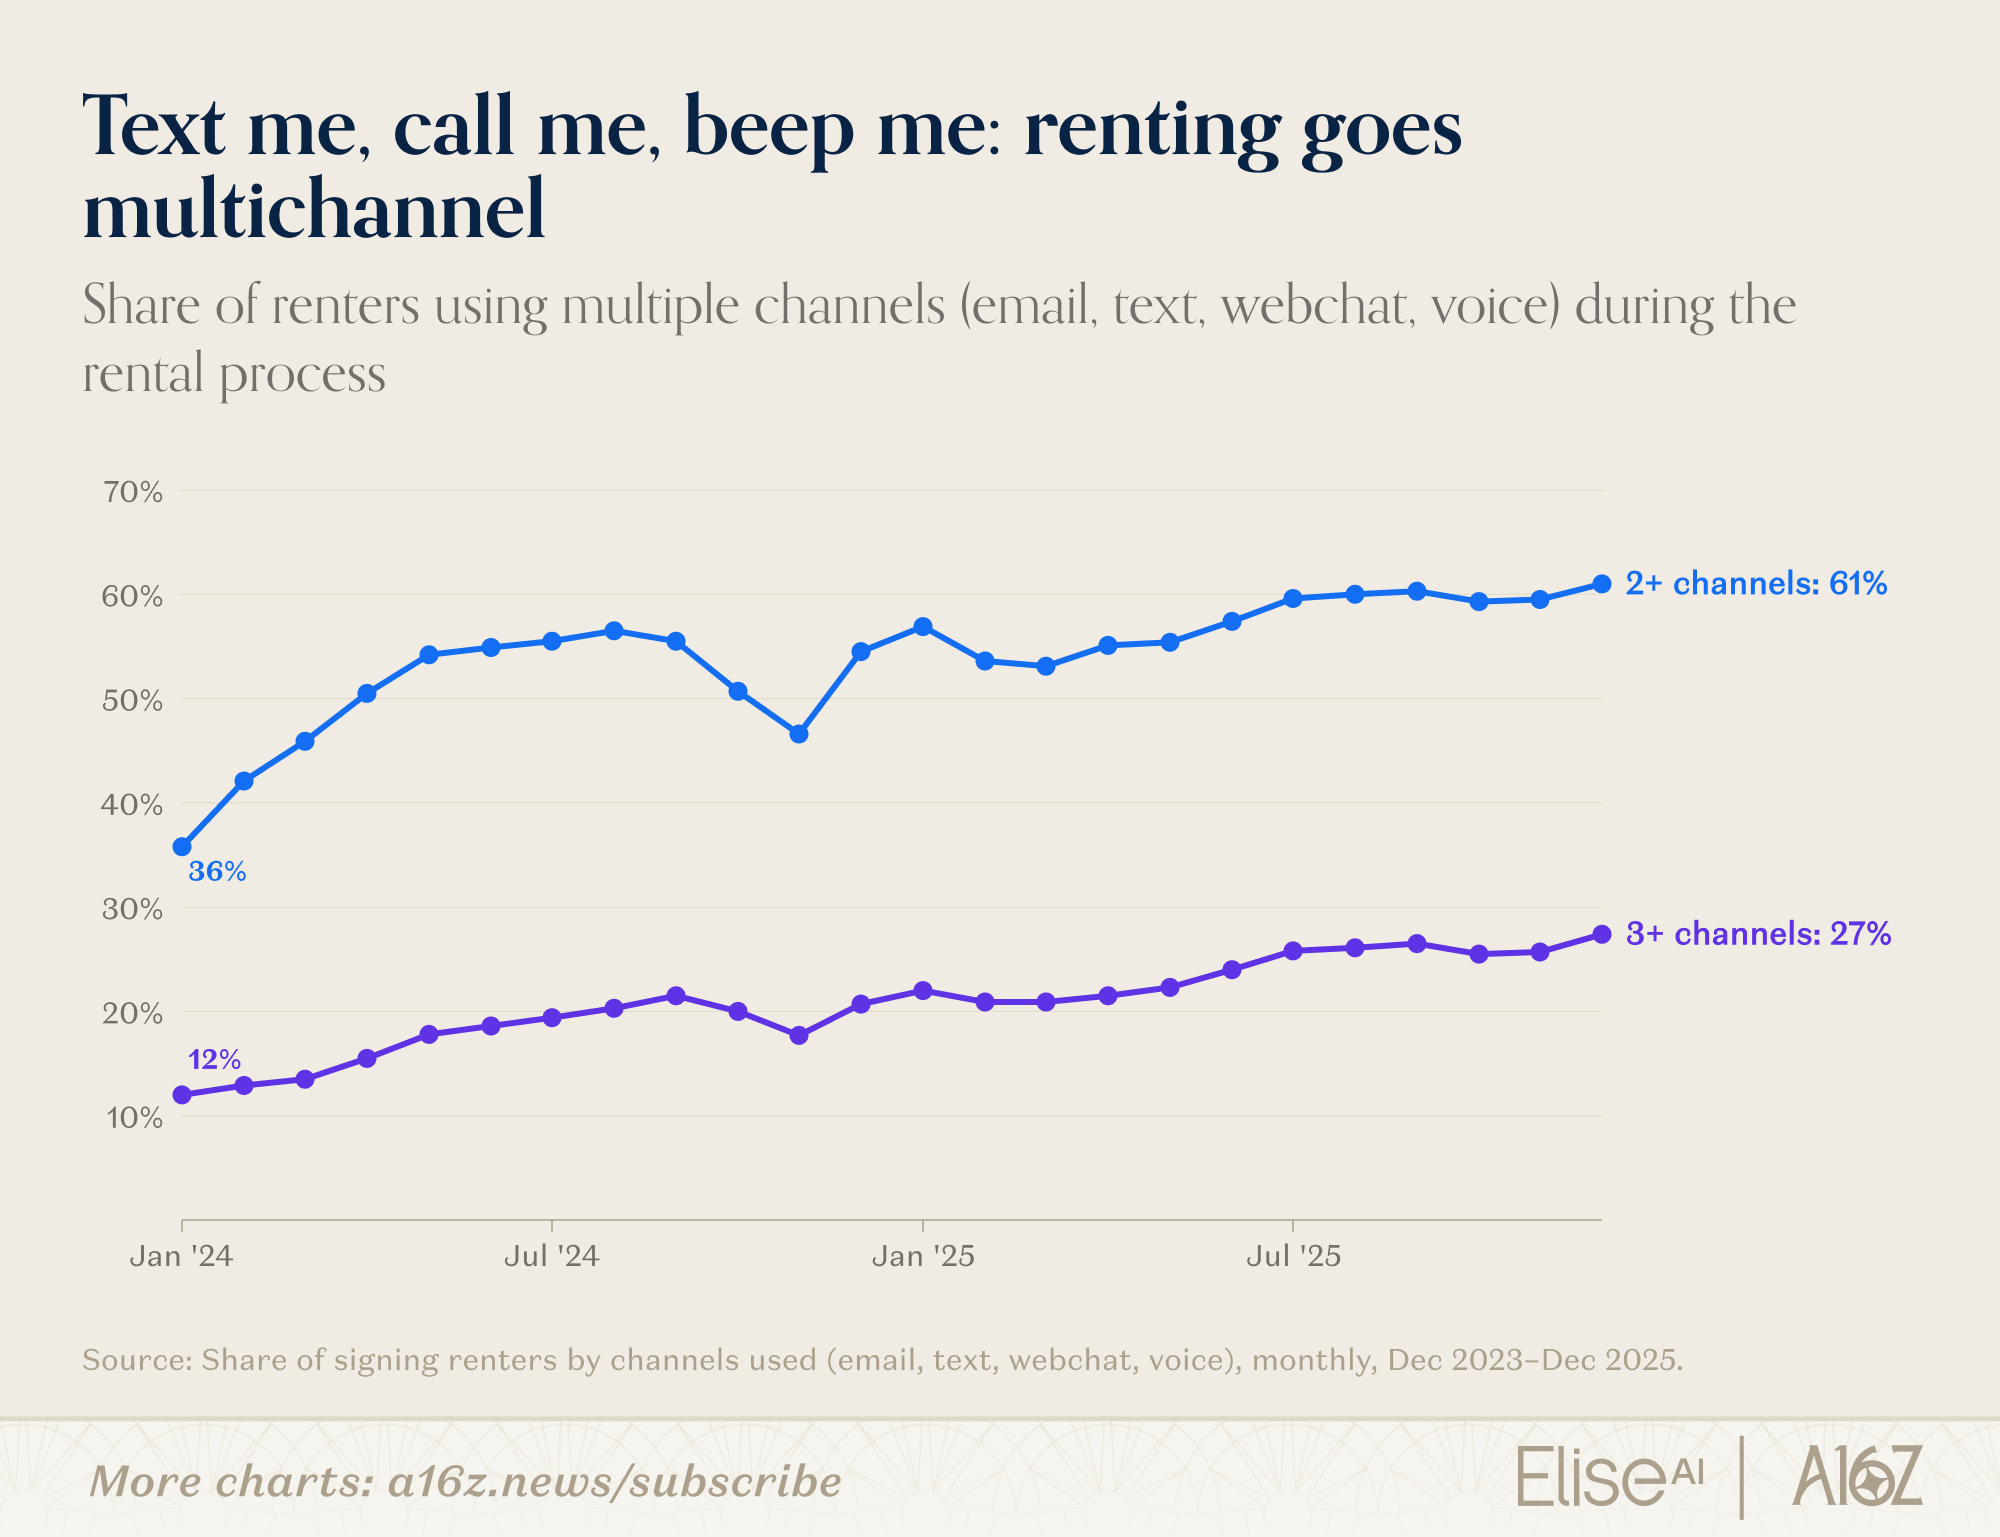
The conversation is also spreading out. Two years ago, roughly a third of signing renters had used more than one channel along the way. Now it is 61%, spanning email, text, webchat, and voice, and journeys touching three or more channels have doubled. AI is allowing your lease to move the way the rest of your life does: across every app on your phone, with the thread still intact.
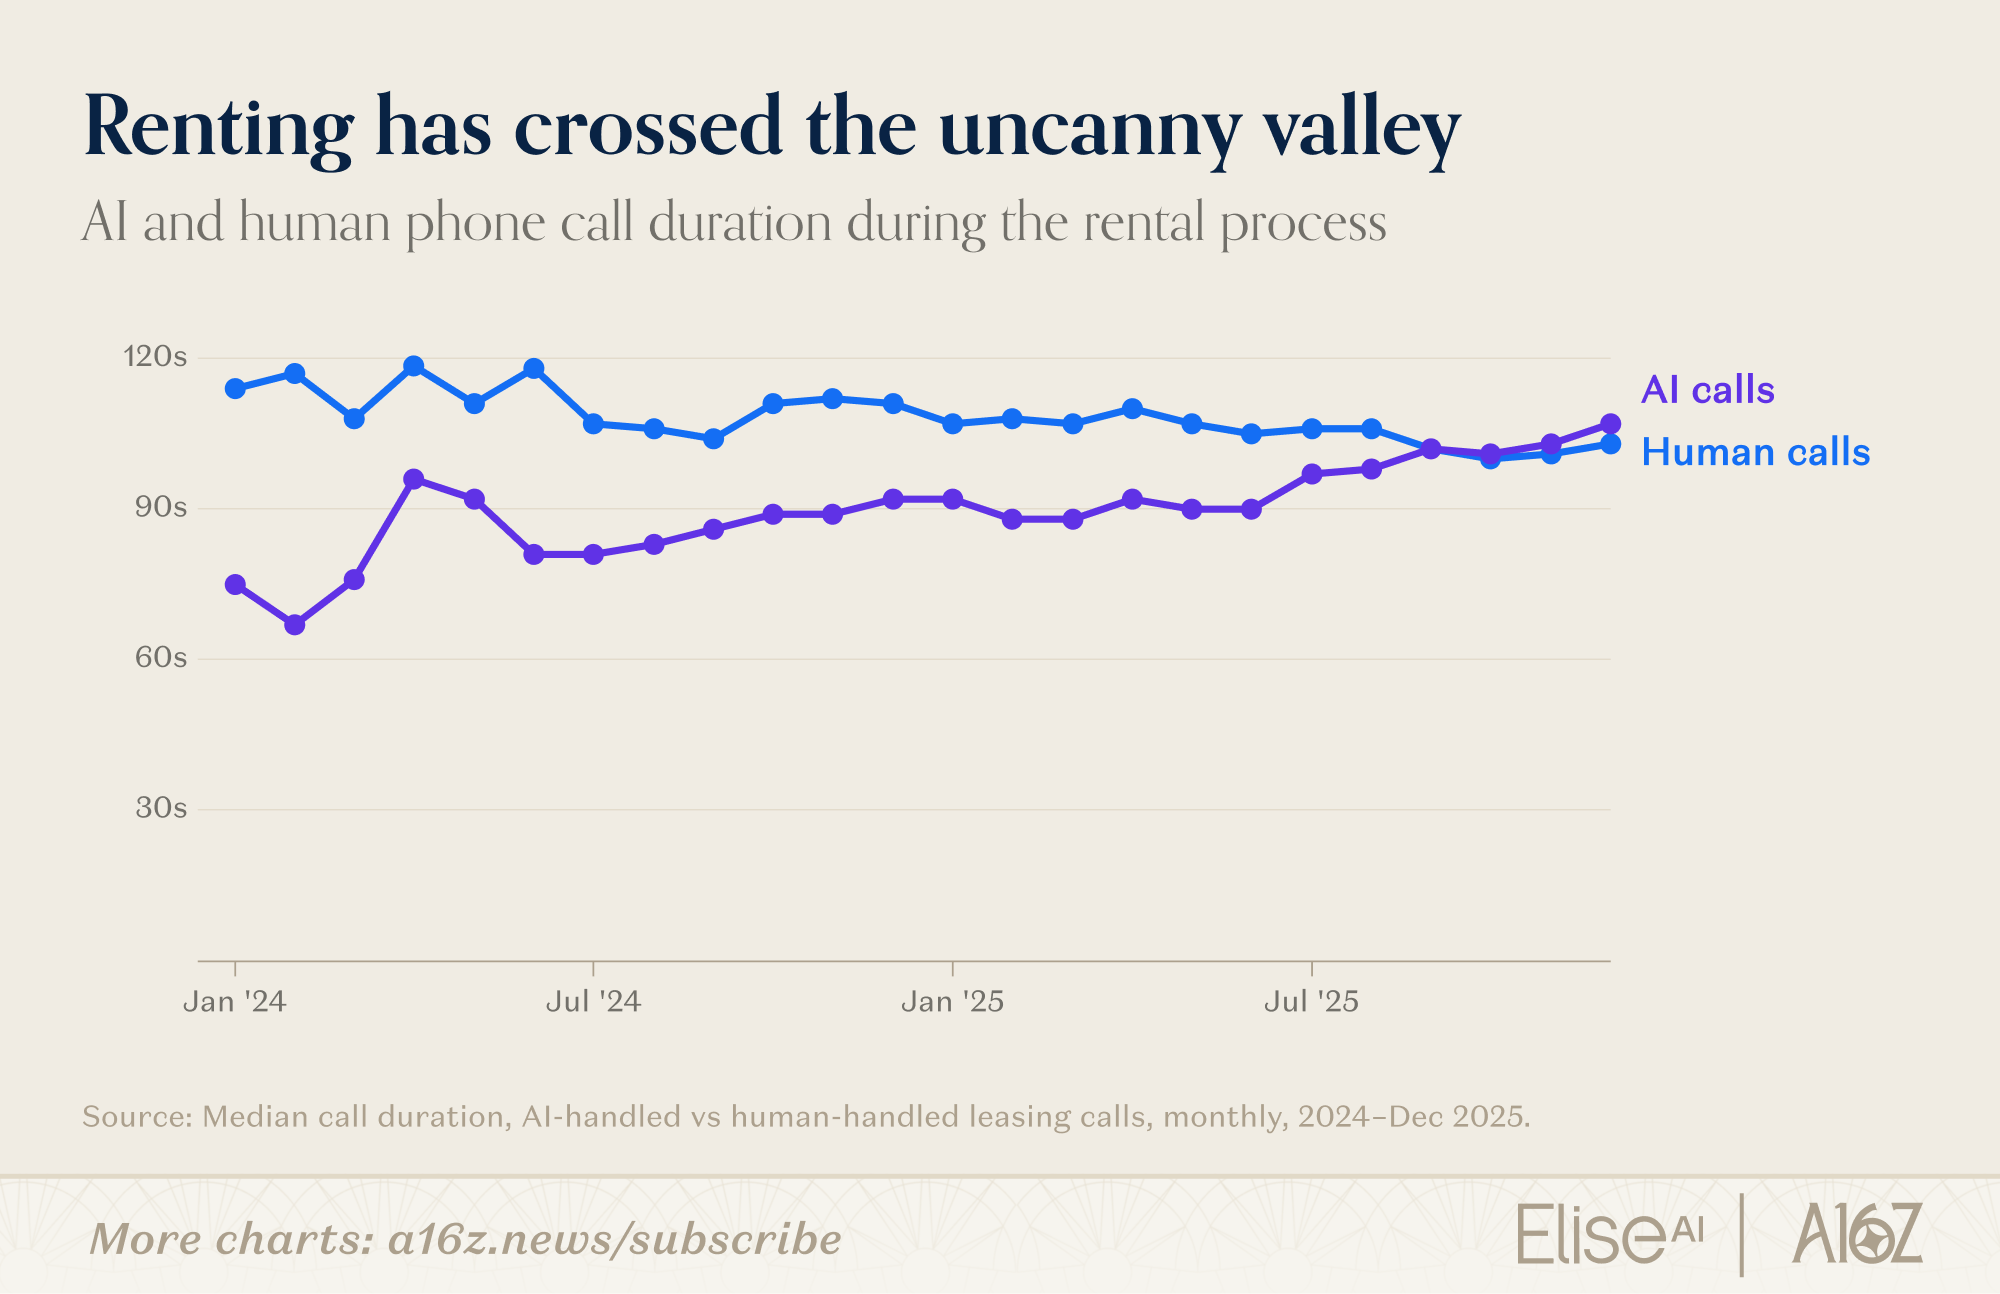
So much for the uncanny valley. In mid-2023, the median AI-handled call lasted 46 seconds, roughly the time it takes to recite office hours. By late 2025, AI calls run as long as human ones, about a minute and forty seconds each. The AI that greeted you can now actually carry the conversation.
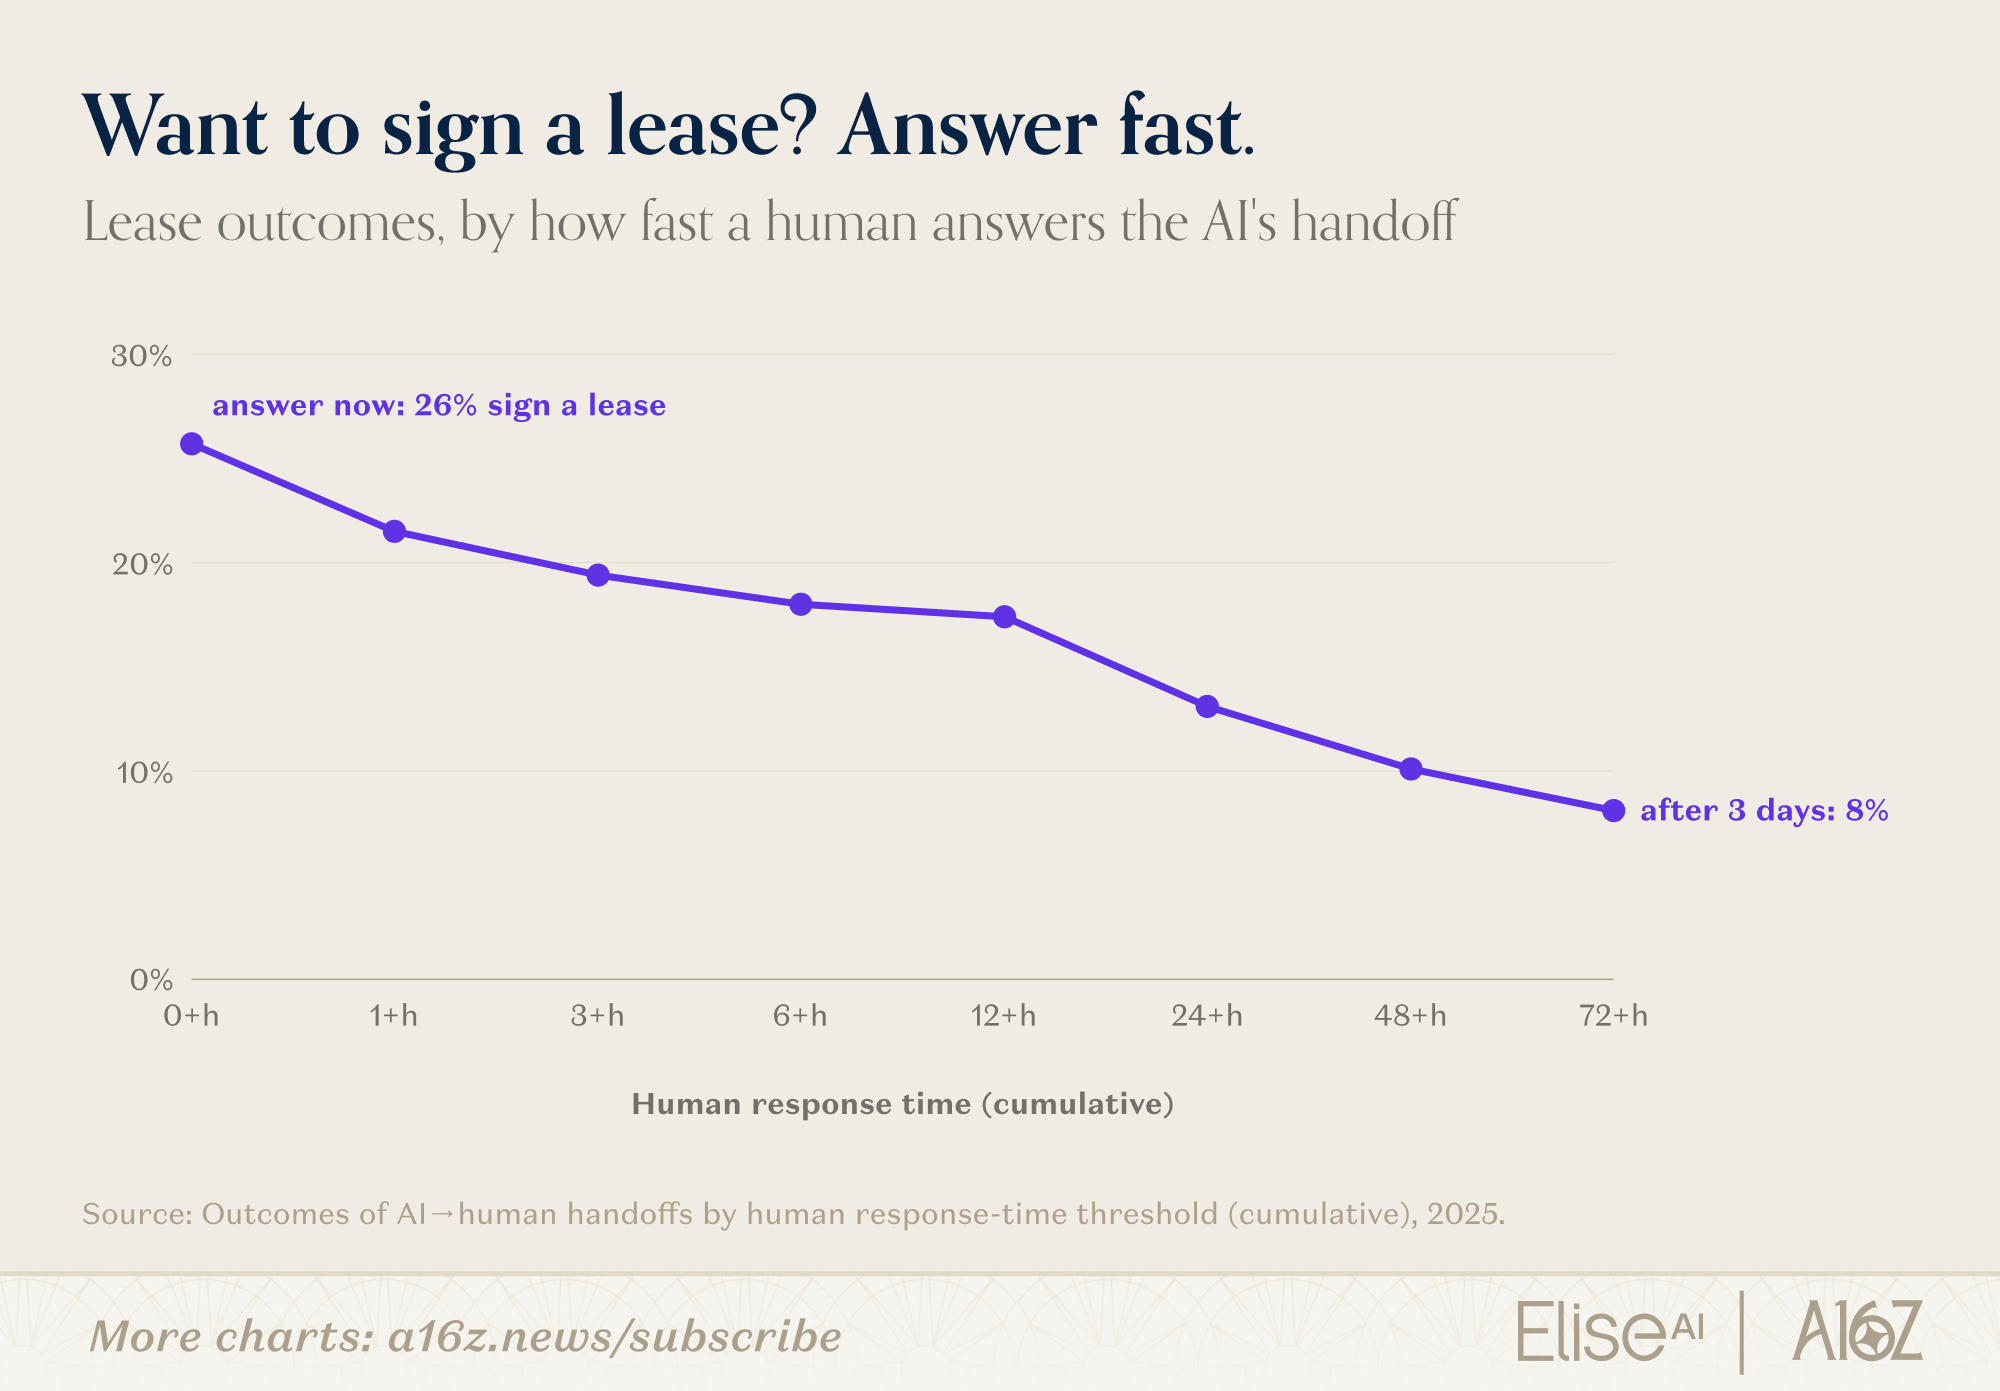
None of this removes people from the loop. By handling the volume of routine questions, scheduling, and follow-up, AI gives leasing teams more capacity to step in when a conversation needs a person. What happens next is the sharpest conversion lever in the dataset: answer that handoff immediately, and 26% of those prospects still sign a lease. Let it sit for three days, and you’re left with less than a third of that. The clock decides who signs. Great property managers matter, and AI helps make sure they are available when it matters most.
Which brings us back to where every renter’s story begins: waiting to hear back.
As renting has become more stressful, renters have gravitated toward AI as the fastest, lowest-friction way to get at correct answers.
For a century, the rental market has been measured from the supply side: what got built, what got listed, what got charged. The demand side was 46 million households talking, asking, deciding, one conversation at a time. What emerges from that side of the ledger is a renter more anxious than the vacancy numbers suggest, and considerably more comfortable turning to AI than anyone might have guessed.
Headline numbers suggest rental market pressures are easing. The conversations say renters are still waiting to feel it. At least now, someone is there to answer.


This newsletter is provided for informational purposes only, and should not be relied upon as legal, business, investment, or tax advice. Furthermore, this content is not investment advice, nor is it intended for use by any investors or prospective investors in any a16z funds. This newsletter may link to other websites or contain other information obtained from third-party sources - a16z has not independently verified nor makes any representations about the current or enduring accuracy of such information. If this content includes third-party advertisements, a16z has not reviewed such advertisements and does not endorse any advertising content or related companies contained therein. Any investments or portfolio companies mentioned, referred to, or described are not representative of all investments in vehicles managed by a16z; visit https://a16z.com/investment-list/ for a full list of investments. Other important information can be found at a16z.com/disclosures. You’re receiving this newsletter since you opted in earlier; if you would like to opt out of future newsletters you may unsubscribe immediately.
What was the impact of reimplementing border enforcement and encouraging self-deportations beginning in January 2025? I would assume it was a massive boon to supply?
Rent anxiety is on the rise, with good reason. Nothing is affordable anymore. According to 2026 data from Hemlane: “From January to May 2026, national rent delinquency rose from 9.33% to 11.09%, driven by a significant acceleration in Q2 (increasing by 1.14 percentage points in April and 0.63 percentage points in May).”