

A Primer on Factory Economics for Startups
The "Factory-is-the-Product" Model in Venture-Backed Manufacturing


America | Tech | Opinion | Culture | Charts


There is a type of company, particularly in hardware-related domains, where a core piece of the company’s advantage is not just what they make, but how they make it. The popular term for these kinds of companies is “The Factory is the Product”, and these companies have a distinct set of economic dynamics that differ substantially from both traditional manufacturing and traditional venture-backed software companies.
Over the last few years we’ve had the privilege of partnering with companies and founders making drone motors, robot actuators, PCBs, industrial systems, aerospace parts, battery packs, avionics components, and more, but the common product between them all is the production capacity to make these products at volume. They aren’t building widgets that happen to need manufacturing, or designing products that get handed off to contract manufacturers. They are developing novel production processes where the manufacturing technology itself is the core IP – where the factory is the product.
As more founders start companies that not only design novel products and systems, but also build and scale the manufacturing capacity to produce those systems, understanding these dynamics will be essential for founders, operators, and capital allocators in and around these businesses. Moreover, as the companies currently building novel hardware and electronics products move from prototyping to production, a mastery of factory economics becomes a skillset more ubiquitously required across the startup ecosystem.
This post is intended as a primer for the product-minded startup founder navigating the transition from a product company to a ‘factory-is-the-product’ company. We will cover basic manufacturing economics, operational metrics, and capital strategy for venture-backed companies that intend to grow along this ‘factory-is-the-product’ pattern. These metrics are important as under the “factory-is-the-product” thesis, they are where the gains driven by internal software and physical tools will show up. Much of this will be familiar for operators in manufacturing roles, but as the manufacturing function grows across the startup ecosystem, we hope a primer like this will prove useful for new entrants.
What Is a Factory-Is-The-Product Company?
We use the term “factory-is-the-product” to refer to a type of company where the methods by which they produce their products is as much of a core part of the company’s product and moat as the end product itself.
A concept originally used to describe Tesla, it now can apply to a variety of companies like Hadrian, Senra Systems, and Podium Automation. And it’s not just limited to companies building aerospace or industrial products. Consider, for instance, Zellerfeld, a company that makes 3D printed footwear, but whose edge as a business comes from substantial advances in manufacturing technology and operations.
This pattern of company spans markets from aerospace to consumer electronics to chemicals and beyond. Consider electronics manufacturers integrating novel robot learning methods for assembly tasks; tier 1 aerospace suppliers building internal tools spanning software and machines to produce parts better, faster, and cheaper; battery cell manufacturers developing new chemistries and cell architectures; biomanufacturing companies scaling fermentation or cell culture processes; or materials companies producing carbon fiber, specialty polymers, or engineered proteins. In each case, the company’s defensibility comes from being able to manufacture something that others cannot, at a cost, quality, or scale that creates durable competitive advantage. The manufacturing capability and competency is the moat.
In the rest of this article, we’ll discuss the following dimensions to a “factory-is-the-product” company.
Basic economics: an overview of the fundamental elements of factory economics, namely costs, yields, learning curves, and capacity.
Manufacturing metrics: understanding how business-level financial metrics and operational metrics and indicators fit together
Capital structure: an outline of different considerations in a ‘factory-is-the-product’ startup’s capital strategy.
Basic Economics
Costs
Costs are one of the most basic considerations when it comes to the economics of manufacturing anything. Factory costs decompose into several distinct categories, each with different scaling properties and strategic implications.
Variable costs scale roughly linearly with production volume:
Direct materials: the bill of materials (BOM) for each unit. This is often the largest single cost component and typically ranges from 30-70% of total unit cost at scale.
Direct labor: production workers whose time scales with output. In highly automated facilities this may be small; in labor-intensive processes it can be 15-30% of costs.
Consumables: process chemicals, gases, lubricants, and other materials consumed in production but not embedded in the final product.
Variable utilities: the marginal energy, water, and waste treatment associated with each unit.
Fixed costs are incurred regardless of production volume:
Depreciation: the amortization of capital equipment and facilities. This is often the dominant fixed cost in capital-intensive manufacturing.
Fixed labor: engineering, maintenance, quality, and management staff whose headcount doesn’t scale linearly with volume.
Facilities: rent or building depreciation, baseline utilities, insurance, property taxes.
Overhead absorption: corporate allocations, IT systems, regulatory compliance.
Semi-variable costs have both fixed and variable components:
Maintenance: some maintenance is calendar-driven (fixed), some is usage-driven (variable).
Quality and testing: some testing is per-unit, some is per-batch or per-time-period.
Yield loss: scrap and rework have variable material costs but often fixed root causes.
The ratio of fixed to variable costs (operating leverage) is important. High fixed cost structures (typical of capital-intensive manufacturing) mean that unit economics improve dramatically with volume, but also that underutilization carries major risks. A factory running at 50% utilization doesn’t have 50% of the profit of one running at 100%. It likely has negative profit, because the fixed costs are spread over half the units.
Yield
Yield is what remains following a cascade of losses through your process, and understanding the structure of that cascade is essential for improving yield. It deserves a closer look in this primer because it has the highest leverage on factory economics.
Incoming quality yield: the fraction of raw materials that meet spec. Poor incoming quality creates downstream yield losses that are often hard to trace back.
First-pass yield (FPY): the fraction of units that pass through each process step without rework. For a multi-step process, overall FPY is the product of step-level FPYs. A 10-step process where each step has 95% FPY has an overall FPY of only 60%.
Rework yield: the fraction of first-pass failures that can be successfully reworked. Rework is expensive (typically 2-5x the cost of doing it right the first time) but often still better than scrap.
Final test yield: the fraction of completed units that pass final inspection and test. Late-stage failures are the most expensive because they’ve accumulated the most value-add.
Field return rate: the fraction of shipped units that come back as warranty claims or customer complaints. This is yield from the customer’s perspective, and it has both direct costs (replacement, repair) and indirect costs (reputation, customer relationships).
The economic impact of yield goes beyond the direct cost of scrapped materials. Consider a factory with:
70% overall yield
$50 in materials per unit started
$30 in conversion cost (labor + overhead) per unit started
1,000 units started per week
This factory produces 700 good units per week at a materials cost of $50,000 and conversion cost of $30,000. The effective cost per good unit is $114.29 — not $80. The 30% yield loss creates a 43% cost premium.
Now consider a competitor with 90% yield, with the same materials and same conversion cost. This competitor produces 900 good units from the same inputs, at an effective cost of $88.89 per good unit. The 20-point yield advantage creates a $25.40/unit cost advantage, a difference material to the relative positioning of each company in a competitive market.
There are a few more concepts related to yield that are important to address here.
Rolled throughput yield (RTY) is the probability that a unit passes through the entire process without any defect or rework. It’s calculated as the product of first-pass yields at each step:
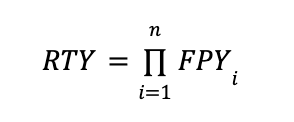
RTY is almost always lower than final yield (because rework can recover units) but is a better indicator of process health.
Defects per million opportunities (DPMO) normalizes yield to account for process complexity. A product with 100 opportunities for defects and 99% yield has a DPMO of 10,000.
Cost of quality (COQ) quantifies the total economic impact of quality issues:
Prevention costs: training, process design, supplier qualification
Appraisal costs: inspection, testing, audits
Internal failure costs: scrap, rework, downtime
External failure costs: warranties, returns, reputation damage
The leverage from yield improvement includes both direct savings (less scrap, less rework) and indirect savings (less inspection needed, lower warranty costs).
Yield learning dynamics follow a characteristic pattern. New processes start with low yield (often 50-70%) and improve rapidly as obvious failure modes are identified and addressed. Yield then enters a phase where improvement slows and requires more sophisticated tools: statistical process control, designed experiments, failure analysis. Mature processes may spend years improving from 95% to 98% yield.
The rate of yield improvement is often more important than current yield. A factory at 75% yield improving 5 points per quarter will outcompete one stuck at 85%.
Learning Curves
Wright’s Law is an observation that the labor hours required to produce a given product declines predictably as cumulative production increases. It originates from the finding that for each doubling in aircraft production, the labor time needed to produce a new aircraft dropped by 20%. This observation, though directionally intuitive, has proven remarkably robust across industries and products (with varying reductions in labor time needed).
This relationship can be expressed as:
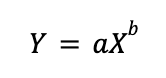
Where:
Y is the average cost (or time) to produce the Xth unit
a is the cost (or time) to produce the first unit
b is log(learning rate) / log(2)
The learning rate refers to the percentage cost reduction for each doubling of cumulative production. An 80% learning curve means costs fall to 80% of their prior level with each doubling (a 20% reduction).
The learning curve is driven by several distinct things happening:
Labor efficiency: workers get faster with practice.
Process optimization: engineers identify and eliminate bottlenecks.
Yield improvement: failure modes are understood and addressed.
Design for manufacturing: product designs evolve to be easier to produce.
Supplier development: vendors improve their processes and reduce prices.
Economies of scale: larger volumes enable automation and better fixed cost absorption.
For factory-as-product companies, the learning curve is central to strategy. Your competitive position depends on your current position on the curve (cumulative production to date), your learning rate (how fast you descend), and your ability to finance the journey.
A company that has produced 1 million units is likely at substantial cost disadvantage to one that has produced 10 million units. But a company that has produced 10 million units can be caught by a competitor with a steeper learning curve or access to capital that allows it to accumulate production faster.
Capacity and Bottlenecks
A factory’s capacity is determined by its bottleneck — the constraining resource that limits overall throughput. The capacity of the system can be considered the capacity of its bottleneck, and improving anything other than the bottleneck doesn’t improve the system.
Nameplate capacity is the theoretical maximum output if everything runs perfectly. It’s almost never achieved in practice.
Demonstrated capacity is what the factory has actually sustained over a meaningful period. This is the only number that matters for planning.
Effective capacity accounts for planned downtime (maintenance, changeovers, holidays) and represents achievable sustained output.
The relationship between these numbers is your Overall Equipment Effectiveness (OEE):
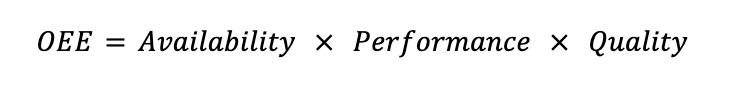
Where:
Availability = (Scheduled Time - Downtime) / Scheduled Time
Performance = (Actual Output × Ideal Cycle Time) / Operating Time
Quality = Good Units / Total Units
OEE decomposition reveals where a manufacturing operation is losing capacity:
Low availability suggests targeting maintenance, changeover reduction, supply chain reliability.
Low performance suggests addressing equipment speed issues, minor stops, slow cycles.
Low quality suggests targeting yield, scrap, and rework.
For factory-as-product companies, understanding your bottleneck evolution is critical. Early on, the bottleneck might be a single specialized piece of equipment. As you solve that constraint, the bottleneck shifts. Your capital deployment strategy should follow the bottleneck.
Manufacturing Metrics
A Hierarchy of Metrics
Manufacturing metrics exist in a hierarchy. Higher-level metrics are outcomes, and lower-level metrics are drivers, resulting in a cascade of metrics that go from financial outcomes to operational outcomes to process drivers to root cause indicators. Managing a factory effectively requires understanding both and knowing which to focus on.
1. Financial outcomes
Gross margin
Unit cost (COGS per unit)
Factory-level EBITDA
2. Operational outcomes
Yield (overall and by stage)
Throughput (units per time period)
Quality (defect rates, customer returns)
Delivery (on-time, in-full)
3. Process drivers
OEE components (availability, performance, quality)
Cycle times by operation
First-pass yield by process step
Scrap and rework by failure mode
4. Root cause indicators
Equipment-specific uptime and fault codes
Process parameter distributions (Cp, Cpk)
Incoming material quality metrics
Environmental conditions
This cascade is particularly important for new, venture-backed manufacturers, as a key part of many of these companies is their ability to build internal software tools that make their operation better on some dimension. A key part of this software is observability, and this cascade outlines the metrics that need to be monitored. Most early stage companies have reporting on the first two categories of metrics, but diagnosing and solving problems with the latter two categories is where the most gains can be made; however, monitoring these metrics requires investment in internal data infrastructure.
Cycle Time and Throughput
Two of the key operational metrics to understanding a given company’s manufacturing operation are cycle time and throughput.
Cycle time is the total elapsed time from start to finish for a unit or batch. It includes:
Processing time (value-added)
Queue time (waiting for equipment or operators)
Move time (transportation between operations)
Setup time (changeovers and calibration)
Wait time (batching, curing, testing holds)
In many factories, processing time is a small fraction of total cycle time — often less than 10%. The rest is waiting.
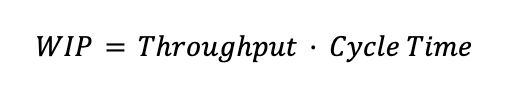
Where WIP is work-in-progress inventory. This relationship means cycle time reduction directly reduces working capital requirements.
Takt time is the rate at which you need to produce to meet demand:
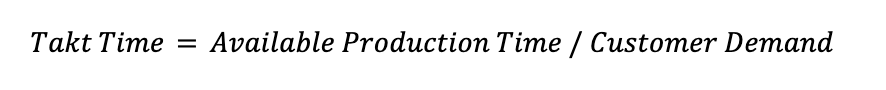
If your process cycle time exceeds takt time, you can’t meet demand without parallel capacity. If it’s well under takt time, you may have excess capacity or batching opportunities.
Bottleneck analysis identifies the constraining operation. Methods include:
Utilization analysis: The highest-utilized resource is typically the bottleneck.
Queue observation: WIP accumulates upstream of the bottleneck.
Capacity analysis: Compare theoretical capacity at each step.
Debottlenecking (adding capacity at the constraint) is often the highest-ROI capital investment in an operating factory.
Capital Structure
The Capital Stack
Factory-as-product companies require substantial capital, but not all capital is appropriate for all uses. The capital stack should be structured to match capital characteristics to funding needs.
Equity, particularly venture capital, has the highest cost of capital, but is also the most flexible and risk-tolerant. For early stage factories, this is often a significant portion of capital raised, typically used for:
R&D and process development
First-of-a-kind equipment and facilities
Working capital during ramp
Operating losses during learning curve descent
Strategic optionality
Venture debt extends runway and reduces dilution but adds repayment obligations. It is most appropriate for:
Milestone-based bridges to next equity round
Equipment purchases with clear payback
Growth capital when metrics are proven
Not appropriate for R&D risk or unproven processes
Equipment financing and leasing is collateralized by the equipment itself. It is most appropriate for:
Standard equipment with secondary market value
Production capacity expansion
Replacing depreciated equipment
Preserves equity for higher-risk uses
Asset-backed lending collateralizes inventory and receivables. It is most appropriate for:
Working capital financing
Seasonal demand fluctuations
Only available with stable, predictable operations
Project finance and infrastructure debt finances discrete projects with predictable cash flows. It is most appropriate for:
New factories with contracted offtake
Expansion of proven production lines
Requires demonstrated unit economics and long-term contracts
Government incentives (grants, tax credits, subsidized loans) represent concessionary capital with various strings attached.
Matching Capital to Risk
The art of capital structure is matching capital with appropriate risk tolerance to the risks inherent in different activities.
Technology risk (will the process work?): equity only.
Scale-up risk (will it work at volume?): primarily equity, potentially some venture debt if milestones are clear.
Execution risk (can we operate efficiently?): mix of equity and debt, shifting toward debt as operations mature.
Market risk (will customers buy at target prices?): project finance with offtake contracts, government incentives for strategic technologies.
Financial risk (can we service our obligations?): depends on predictability of cash flows and asset values.
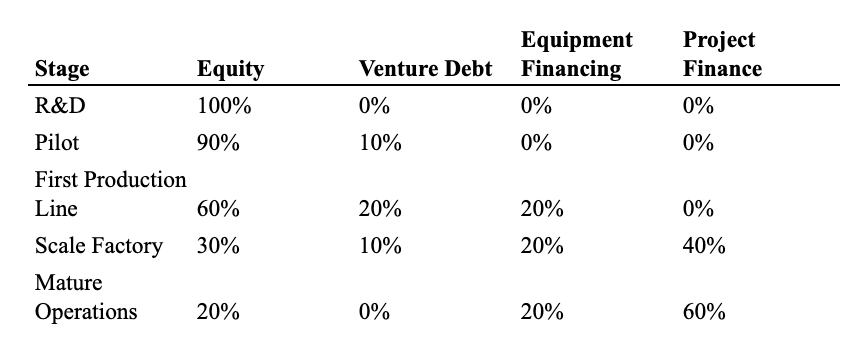
The optimal capital structure evolves as the company matures. An illustrative example of the capital progression:
Cash Conversion Cycles
Working capital requirements are often underestimated by factory startups. The cash conversion cycle measures how long cash is tied up in operations:
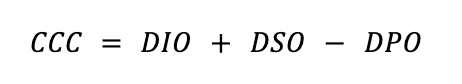
Where:
DIO = Days Inventory Outstanding
DSO = Days Sales Outstanding
DPO = Days Payables Outstanding
For a factory with 60 days of inventory, 45 days receivables, and 30 days payables, CCC = 75 days. If the factory runs at $10M/month in costs, it needs $25M in working capital just to fund operations.
Working capital requirements scale with revenue. As you grow, you need more inventory, more receivables financing, and more operating cash. This is where startups sometimes stumble: they raise enough to build the factory but not enough to fill it with WIP and carry receivables.
Asset-based lending can help, but requires mature operations and predictable inventory values. Early-stage factories often need to fund working capital with equity.
Debt Capacity and Covenant Structures
Lenders assess factory companies on several dimensions:
Asset coverage: what can be liquidated to repay the loan? Equipment loans typically require a multiple of coverage of loan value by appraised equipment value.
Cash flow coverage: can operating cash flow service debt? Consider requirements around EBITDA / Interest and EBITDA / Debt Service.
Liquidity: is there sufficient cash buffer? Minimum liquidity covenants often require some number of months of operating expenses.
Operational milestones: for project finance, lenders may require demonstrated yield levels, production rates, or customer acceptances before funding draws.
Covenant structures for factory companies can include:
Minimum revenue or production thresholds
Maximum capital expenditure limits
Milestone-based funding draws
Cash sweep provisions
Sponsor support requirements
Negotiating covenant packages requires understanding both lender requirements and operational realities. Covenants that are too tight create refinancing risk; covenants that are too loose reduce access to capital.
Modeling the Factory
A robust factory financial model would capture the following. Of course, at early stages many of these details will be unknown, and heavily dependent on assumptions that can be revisited as the company begins manufacturing.
Capital expenditure schedule
Equipment lead times
Installation and qualification timelines
Phased capacity additions
Contingency (typically 15-25% for first-of-kind)
Ramp profile
Production ramp rate (constrained by yield learning and market demand)
Yield trajectory over time
Staffing ramp (often leads production ramp)
Unit economics evolution
BOM cost trajectory (volume discounts, supplier development)
Conversion cost evolution (learning curve, automation)
Yield improvement assumptions
Working capital build
Inventory policy (raw materials, WIP, finished goods)
Payment terms (customer and supplier)
Operating cash buffer
Financing structure
Equity rounds (amount, timing, valuation assumptions)
Debt facilities (amount, availability, covenants)
Government incentives (timing, conditions)
The output should be a month-by-month cash flow showing:
Total capital required to reach cash flow breakeven
Peak cash need and timing
Sensitivity to key assumptions (yield, ramp rate, pricing)
Covenant compliance under stress scenarios
The Discipline of Factory Economics
Building a factory-as-product company is one of the most challenging undertakings in business. It combines the technical difficulty of developing novel processes, the financial complexity of capital-intensive operations, and the organizational challenge of scaling from R&D to production.
The companies that succeed share several characteristics:
Intellectual honesty about metrics: they know their true costs, their real yields, their actual capacity. They don’t hide behind favorable definitions or optimistic assumptions.
Capital structure discipline: they match capital to risk, preserve equity for genuine uncertainty, and aggressively move expenses to lower-cost financing as operations mature.
Obsession with the learning curve: they understand that cost competitiveness is a race, and the race goes to those who accumulate production volume fastest while maintaining steep learning rates.
Operational excellence as strategy: they recognize that the factory is the product, and therefore operational improvement is not a back-office function but the core strategic activity.
The economics of factories are unforgiving. Fixed costs punish underutilization. Yield losses compound through the process. Working capital requirements grow with revenue. The learning curve demands sustained investment before payoff.
But for companies that master these economics, the rewards are substantial. A factory that works — that produces at high yield, at competitive cost, at scale — is extraordinarily difficult for competitors to replicate. The combination of process IP, operational knowledge, and accumulated learning creates durable competitive advantage in a way that software moats increasingly do not.
The factory-as-product model is hard. But for the companies that get it right, it’s a compelling path to building enduring value — the factory is the product, and the factory is the moat.


This newsletter is provided for informational purposes only, and should not be relied upon as legal, business, investment, or tax advice. Furthermore, this content is not investment advice, nor is it intended for use by any investors or prospective investors in any a16z funds. This newsletter may link to other websites or contain other information obtained from third-party sources - a16z has not independently verified nor makes any representations about the current or enduring accuracy of such information. If this content includes third-party advertisements, a16z has not reviewed such advertisements and does not endorse any advertising content or related companies contained therein. Any investments or portfolio companies mentioned, referred to, or described are not representative of all investments in vehicles managed by a16z; visit https://a16z.com/investment-list/ for a full list of investments. Other important information can be found at a16z.com/disclosures. You’re receiving this newsletter since you opted in earlier; if you would like to opt out of future newsletters you may unsubscribe immediately.
 | A guest post by
|
this is “Ctrl-P” worthy
Henry Ford and W. Edwards Deming come to mind while reading this.