



We’re excited to announce that a16z is leading an investment in TypeSafe AI, the creators of Jev. Read more about why we invested in our blog post and hear from the team in our a16z Show episode.

Earlier this week, Flávio Bolsonaro secured a surprise first-round victory in the Brazilian presidential election. Or maybe it wasn’t a surprise. Charts knows next to nothing about Brazilian politics, so we really couldn’t say.
If you take a gander at the prediction markets, however, it appears as though Bolsonaro’s win was at least somewhat surprising, but not too surprising:
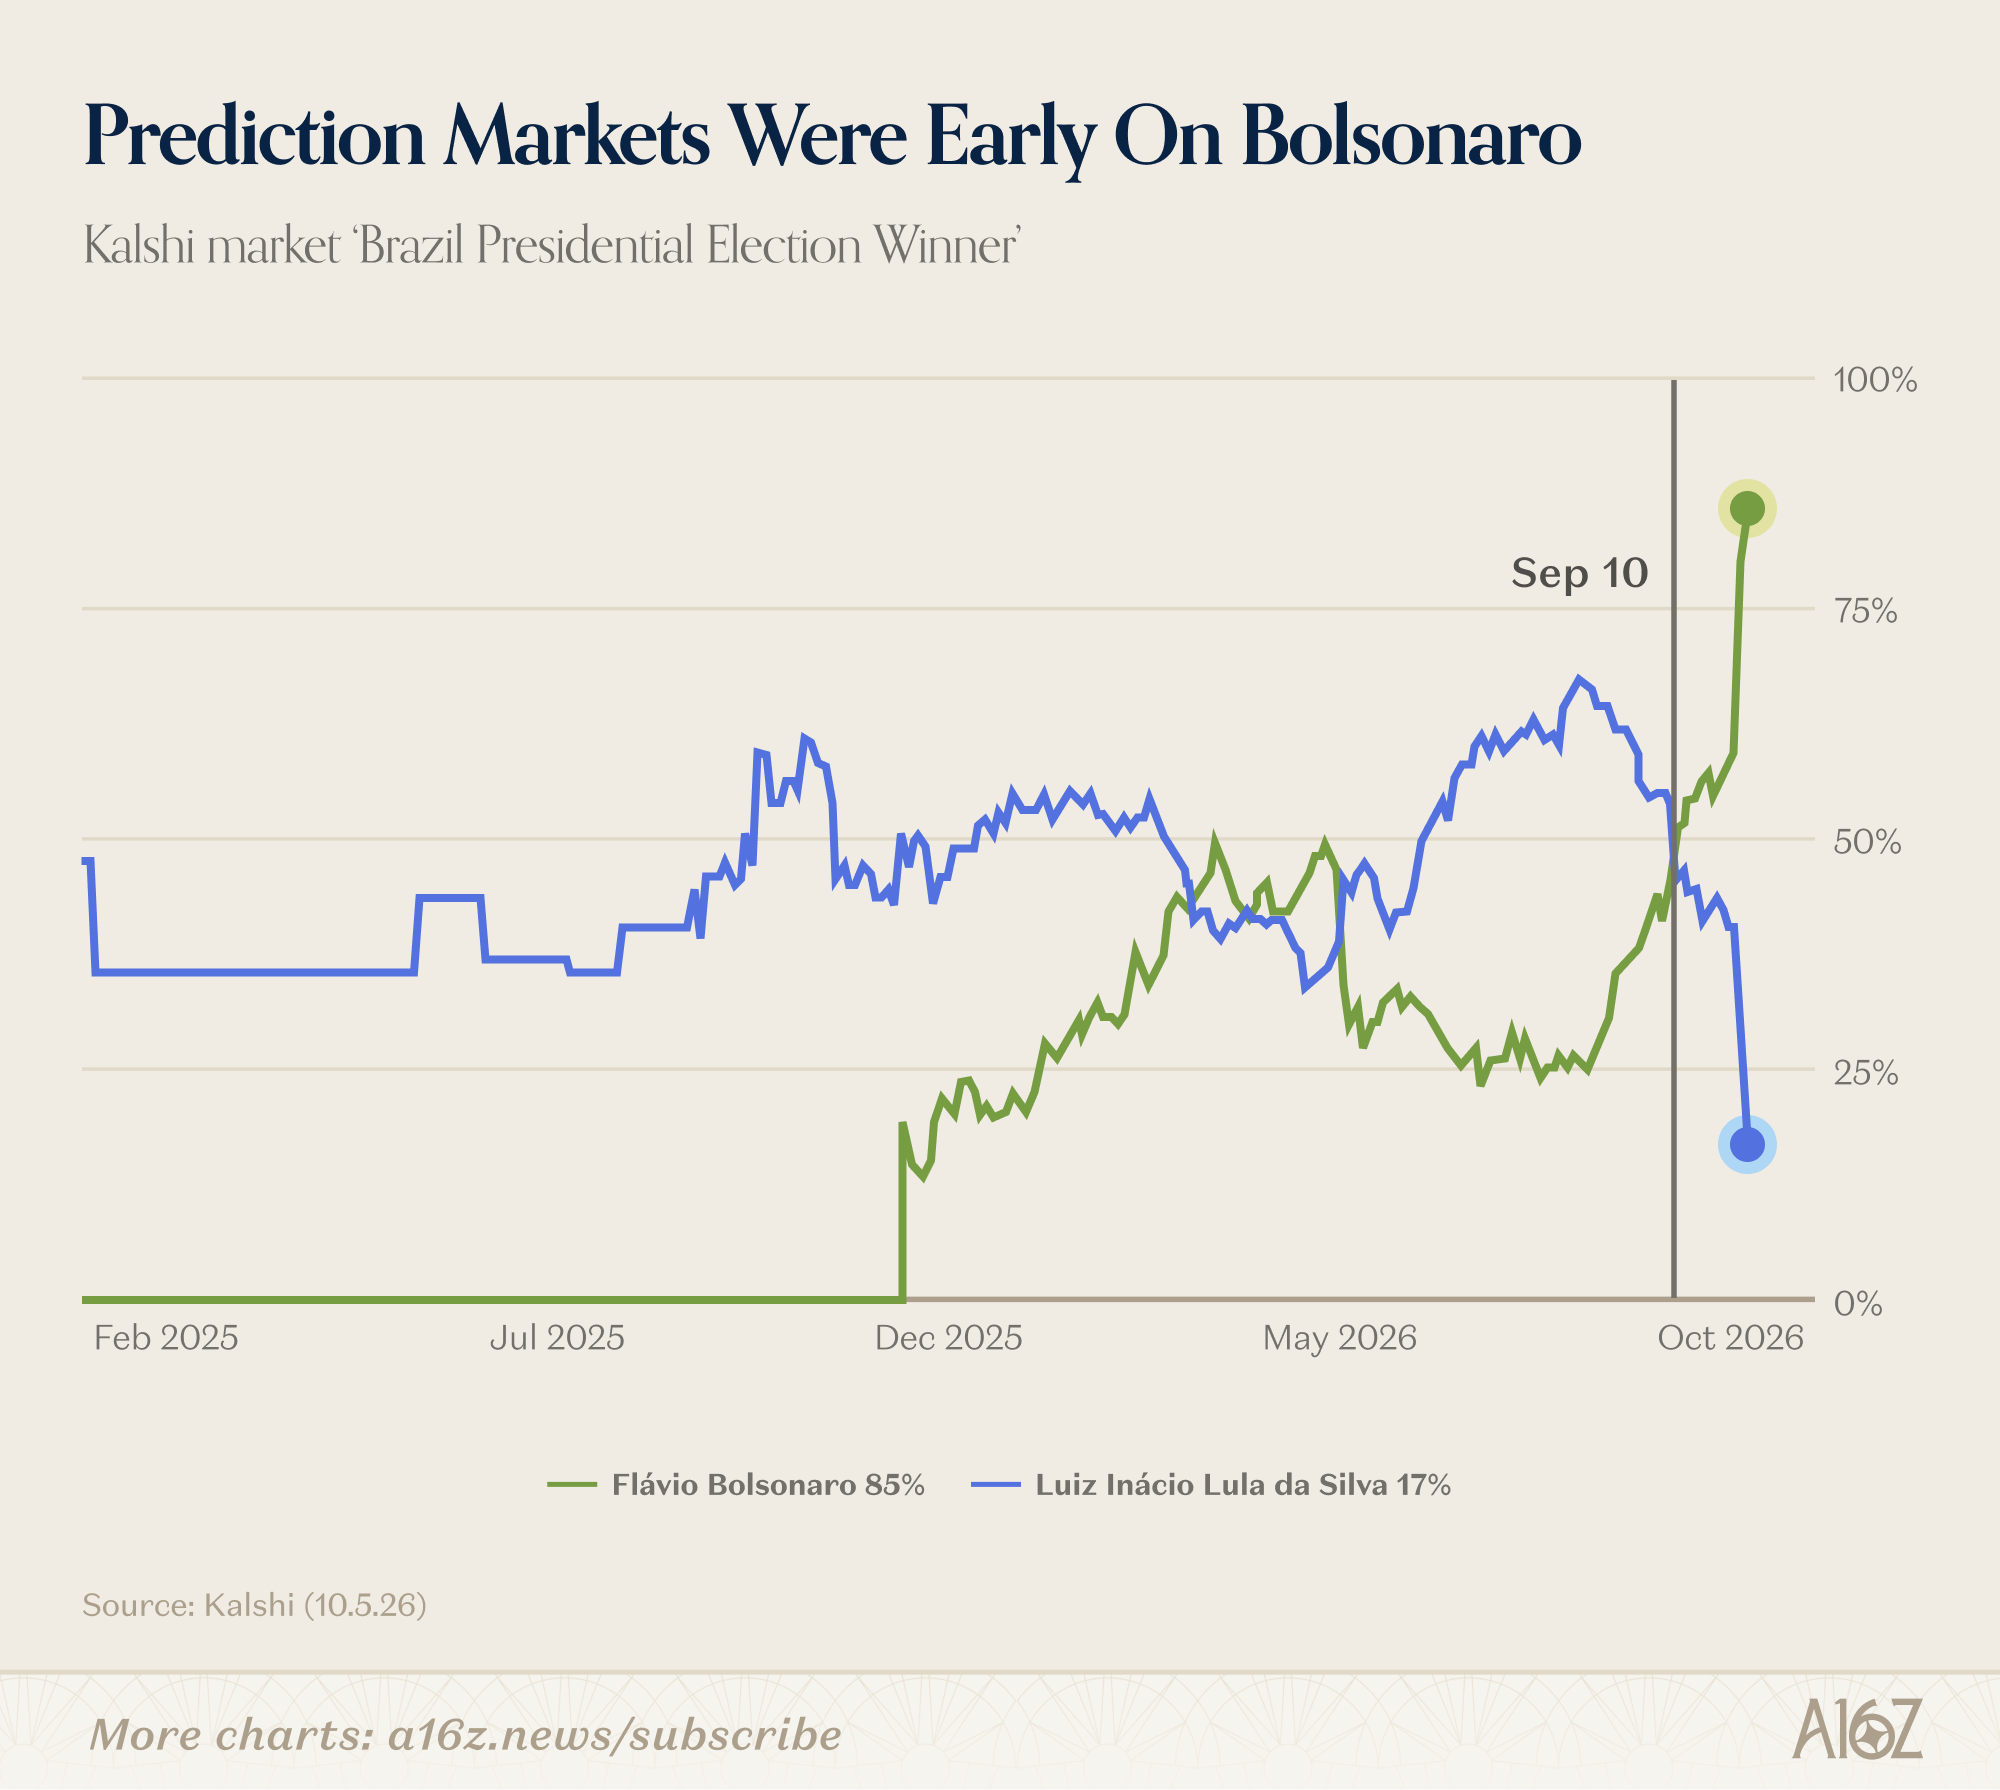
After pacing as a long shot for most of the year, odds began to turn in Bolsonaro’s favor in August, and by the second week of September, he was already the favorite. Unsurprisingly, Bolsonaro’s odds for winning the presidency have since skyrocketed, after the recent first-round win.
Whatever the surprise, prediction markets were early and right on this one by ~3 weeks. The outcome of the election is apparently consequential for financial markets too, judging by MSCI’s Brazil ETF, which jumped ~15% after the news of Bolsonaro’s first-round win. To be fair, the ETF also started climbing back in August (when Bolsonaro’s Kalshi odds began to turn), but not nearly as steeply or as uniformly. In other words, it seems fair to conclude that prediction markets had this one first.
All of this was a somewhat longwinded segue to some recent research that purports to show that prediction markets are actually pretty good at elections, or at least, they don’t demonstrate much partisan bias.
Prof. Zitzewitz published some preliminary findings in an NBER working paper that aggregated over 100 years’ worth of prediction markets (albeit with most of the sample coming recently) looking for evidence of over-pricing along various dimensions, including demographics and political affiliation. The premise of the study is that any bias would show up as outsized returns (either positive or negative) for whichever attribute(s) prediction markets systematically over- or underrated. That makes sense: if, e.g., prediction markets consistently underrate female candidates, then taking the “over” on female candidates would be a winning strategy (reflected by a positive coefficient).
As it turns out, the evidence of bias is pretty much non-existent:
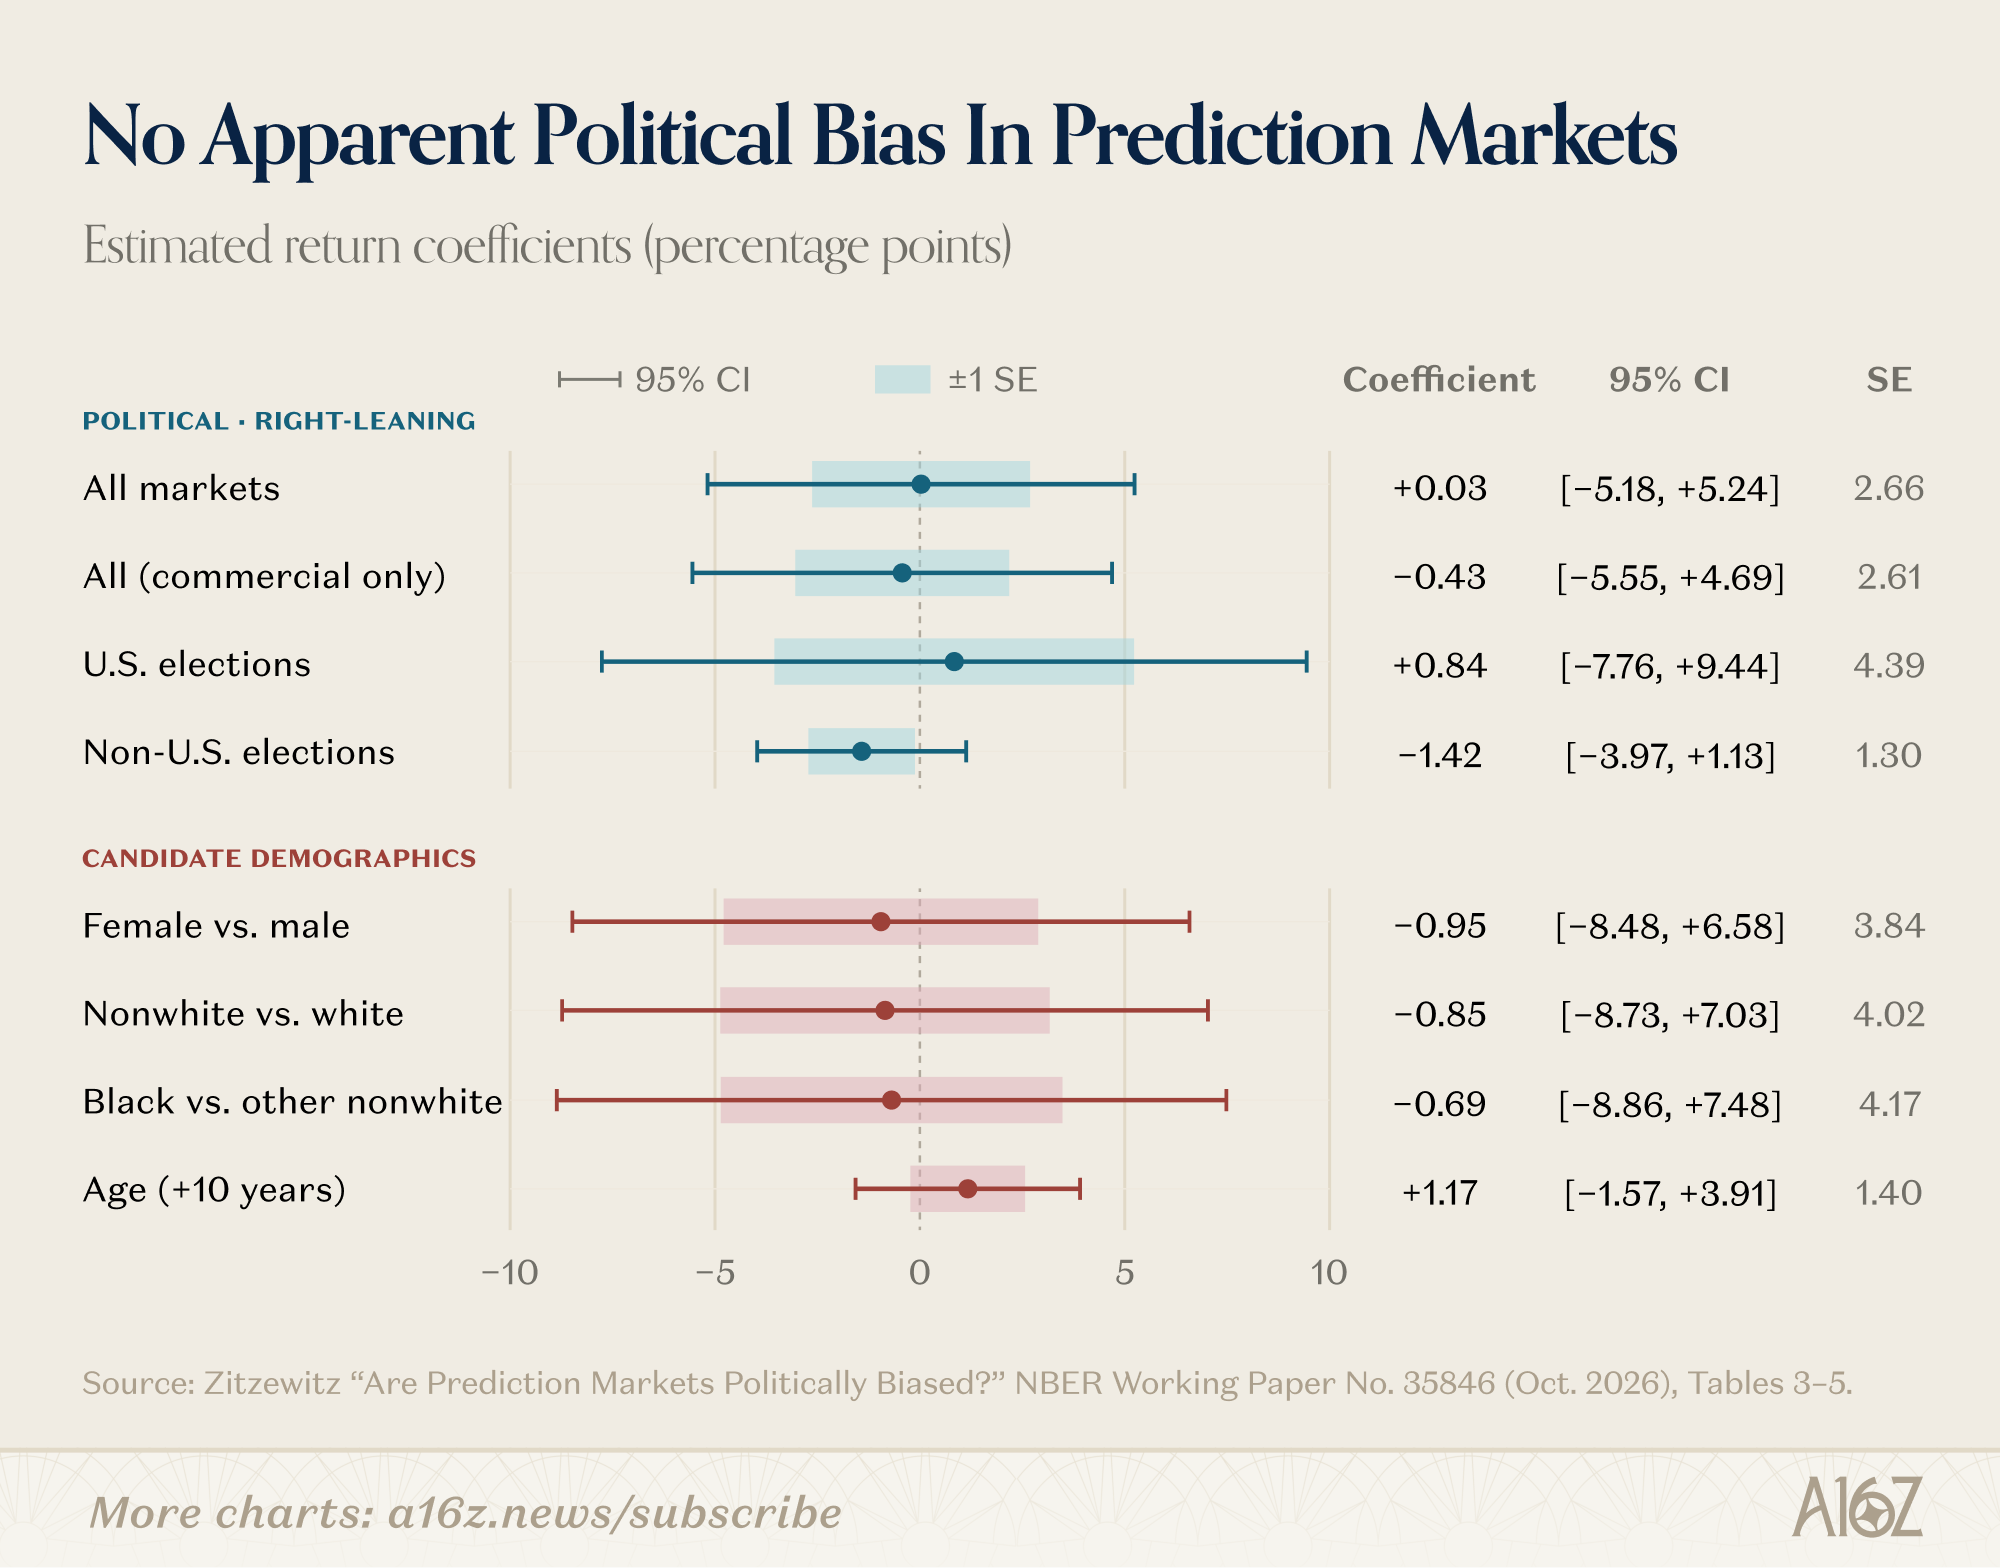
This chart summarizes a subset of the results, and among political affiliation, gender, color, or age, there is not a single dimension where the return coefficient was above or below zero by an amount that exceeded the standard error—the only exception is for non-US elections, where prediction markets appear to reflect some bias in favor of right-leaning candidates (i.e. the coefficient is negative because markets overrate their chances), albeit over a much smaller sample. Even there, however, the 95% confidence interval indicates that the bias is not statistically significant.
Elsewhere, the results suggest a small (statistically insignificant) bias in favor of women and non-white candidates, and against older candidates, but when it comes to partisanship, the coefficient is a bare 0.03.
Take that for what you will, but the results imply that when it comes to elections, prediction markets are pretty good at leaving their biases at the door.
Rule of 40 Ain’t What It Used To Be
For years, the Rule of 40 was considered a lodestar for techco performance. The idea was to create a single metric that would enable comparisons across fast-growing companies at various stages of their lifecycle, where very rapid, and very unprofitable, growth was expected early, and less rapid, but more profitable, growth was expected as companies mature.
The Rule of [X] part is determined by summing revenue growth with profit margins, and if the number was 40 or higher, you were in good shape. So a company with 100% revenue growth, and -60% margins, was still winning because 100 + (-60) = 40, i.e. Rule of 40 on the nose . . . whereas 150% growth with -150% margins, clocking in at Rule of 0, would be less impressive (despite the faster growth).
Given that Rule of 40 is supposed to be a good thing, it’s odd to see these two things happening at once: public software cos are raising their Rule of X, while multiples are in steady decline:
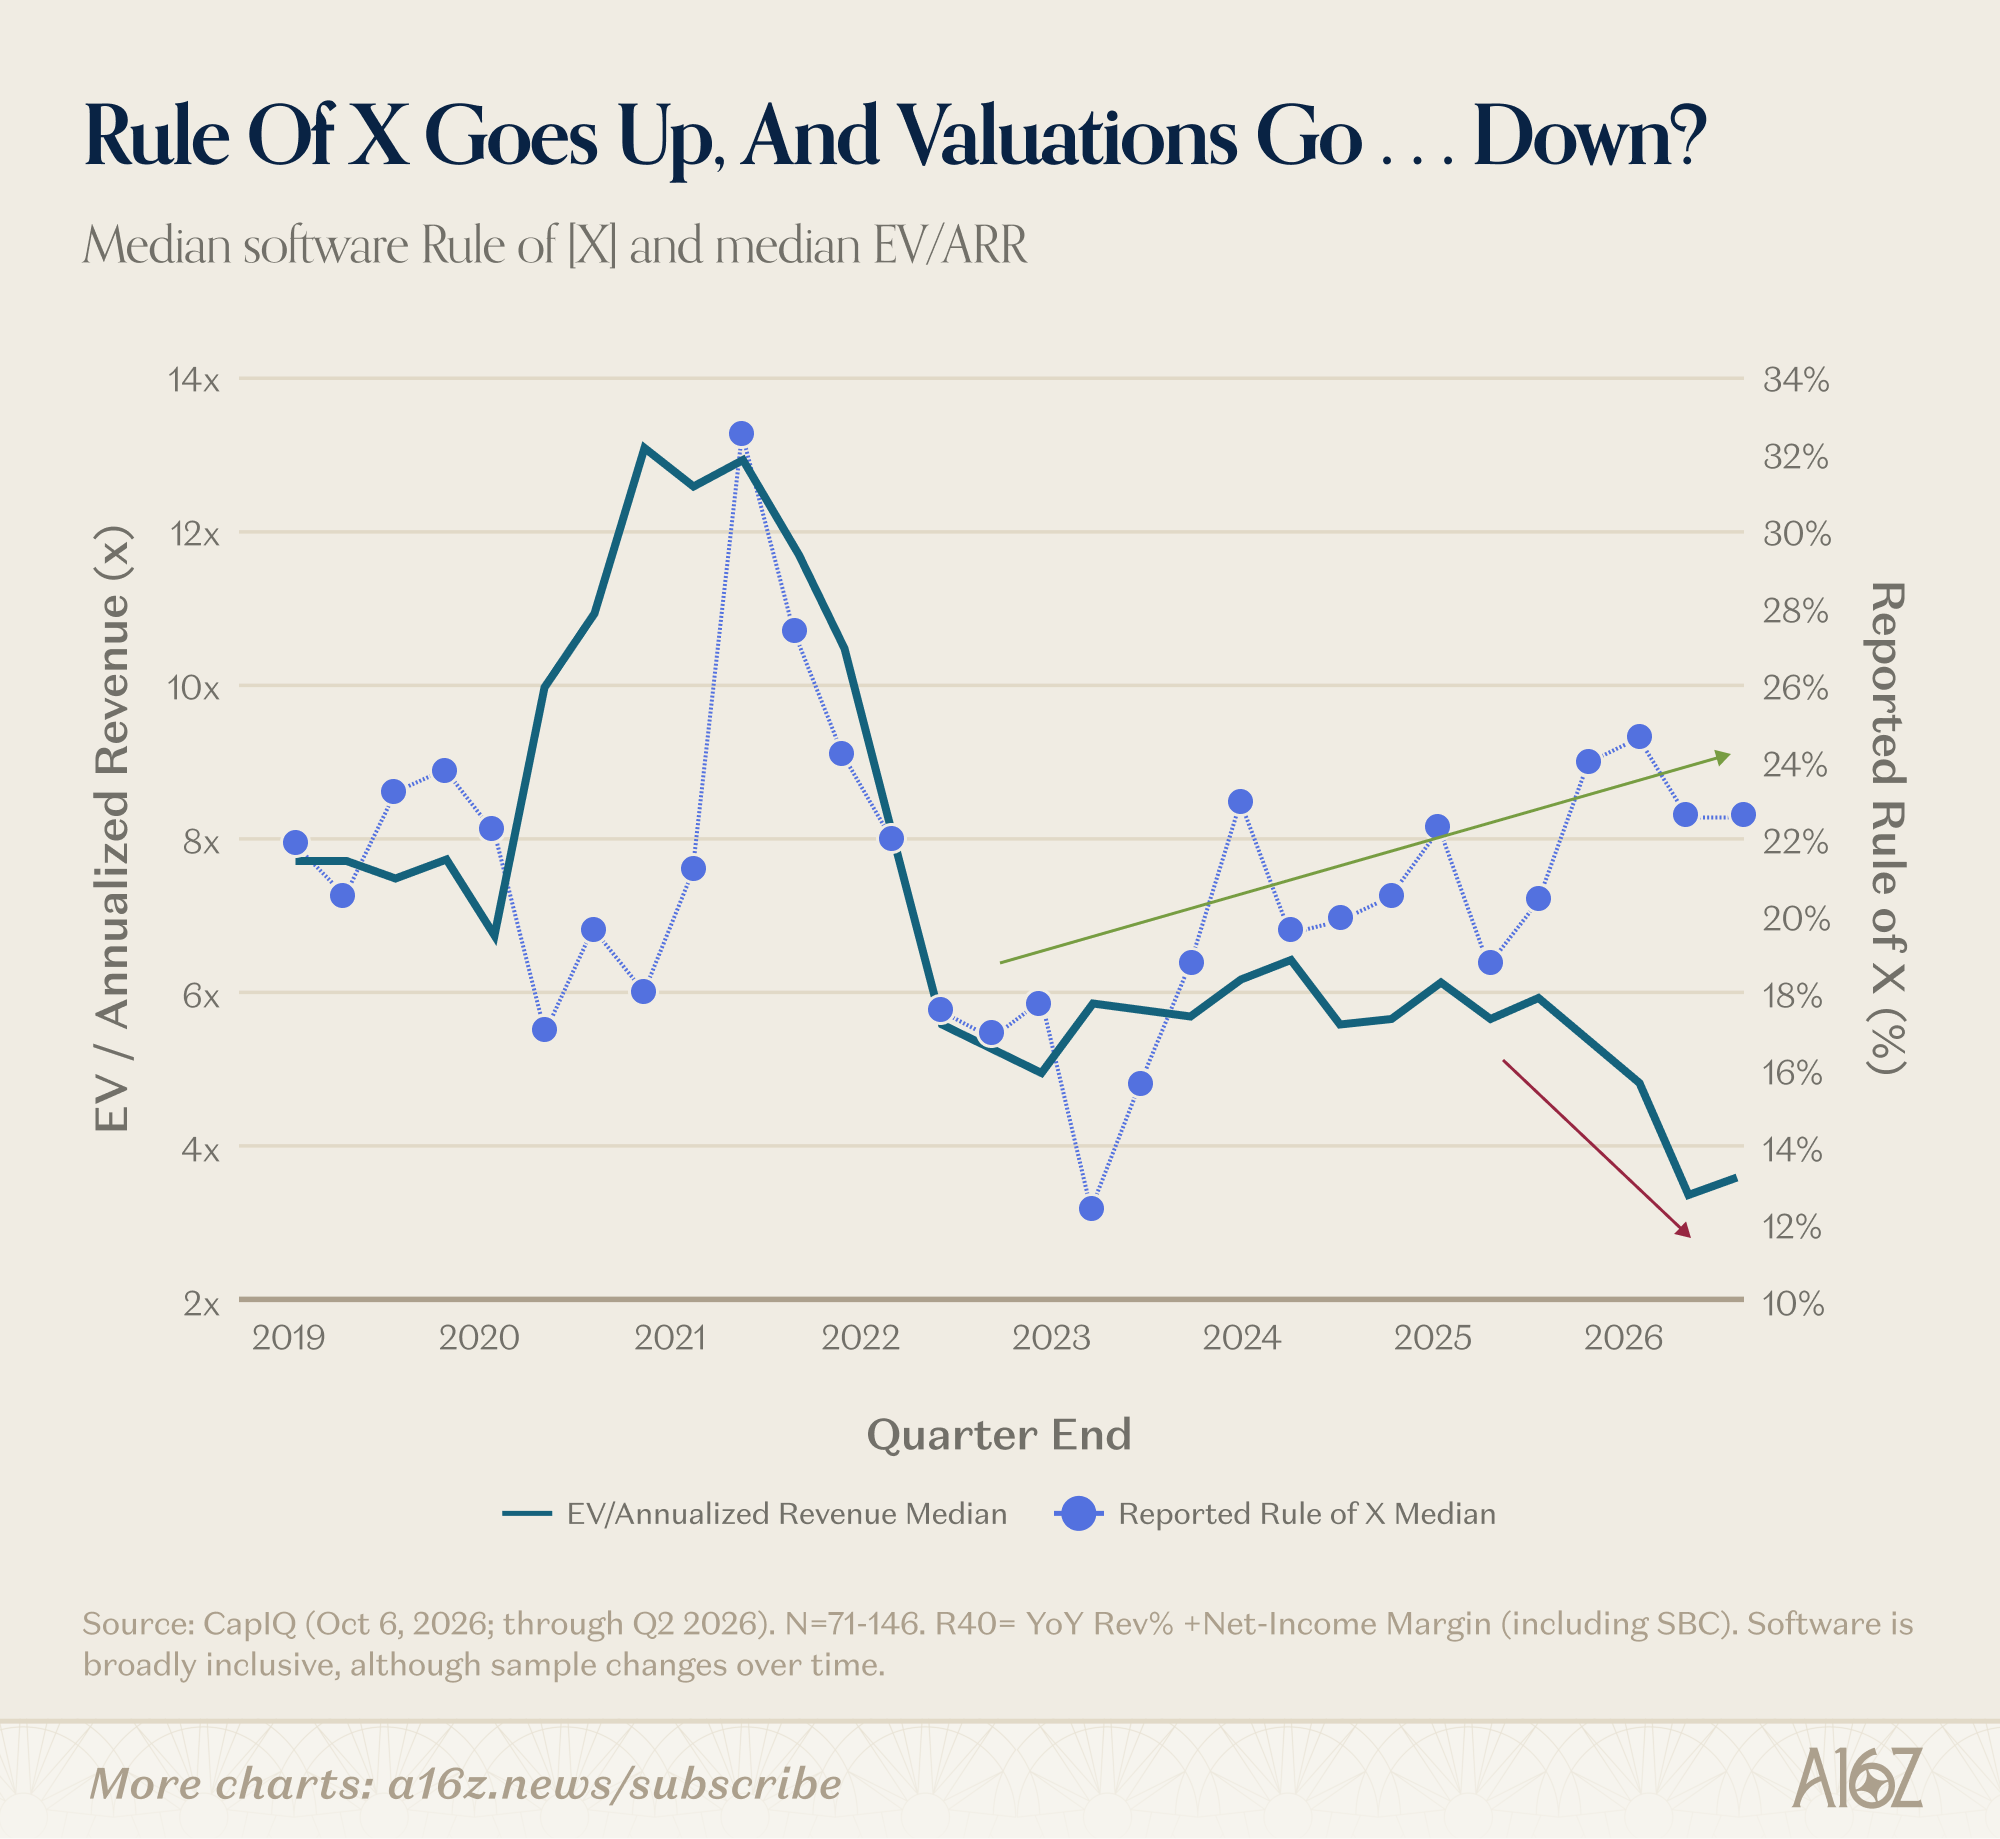
With some fits and starts, the median Rule of X for public software has risen from ~17% to ~23% over the past ~3 years, with the steepest upward inflection beginning early 2025 . . . just when revenue multiples began their precipitous decline.
Here’s another way of looking at it: the correlation between Rule of X and multiples (on a rolling basis) turned sharply south and eventually negative:
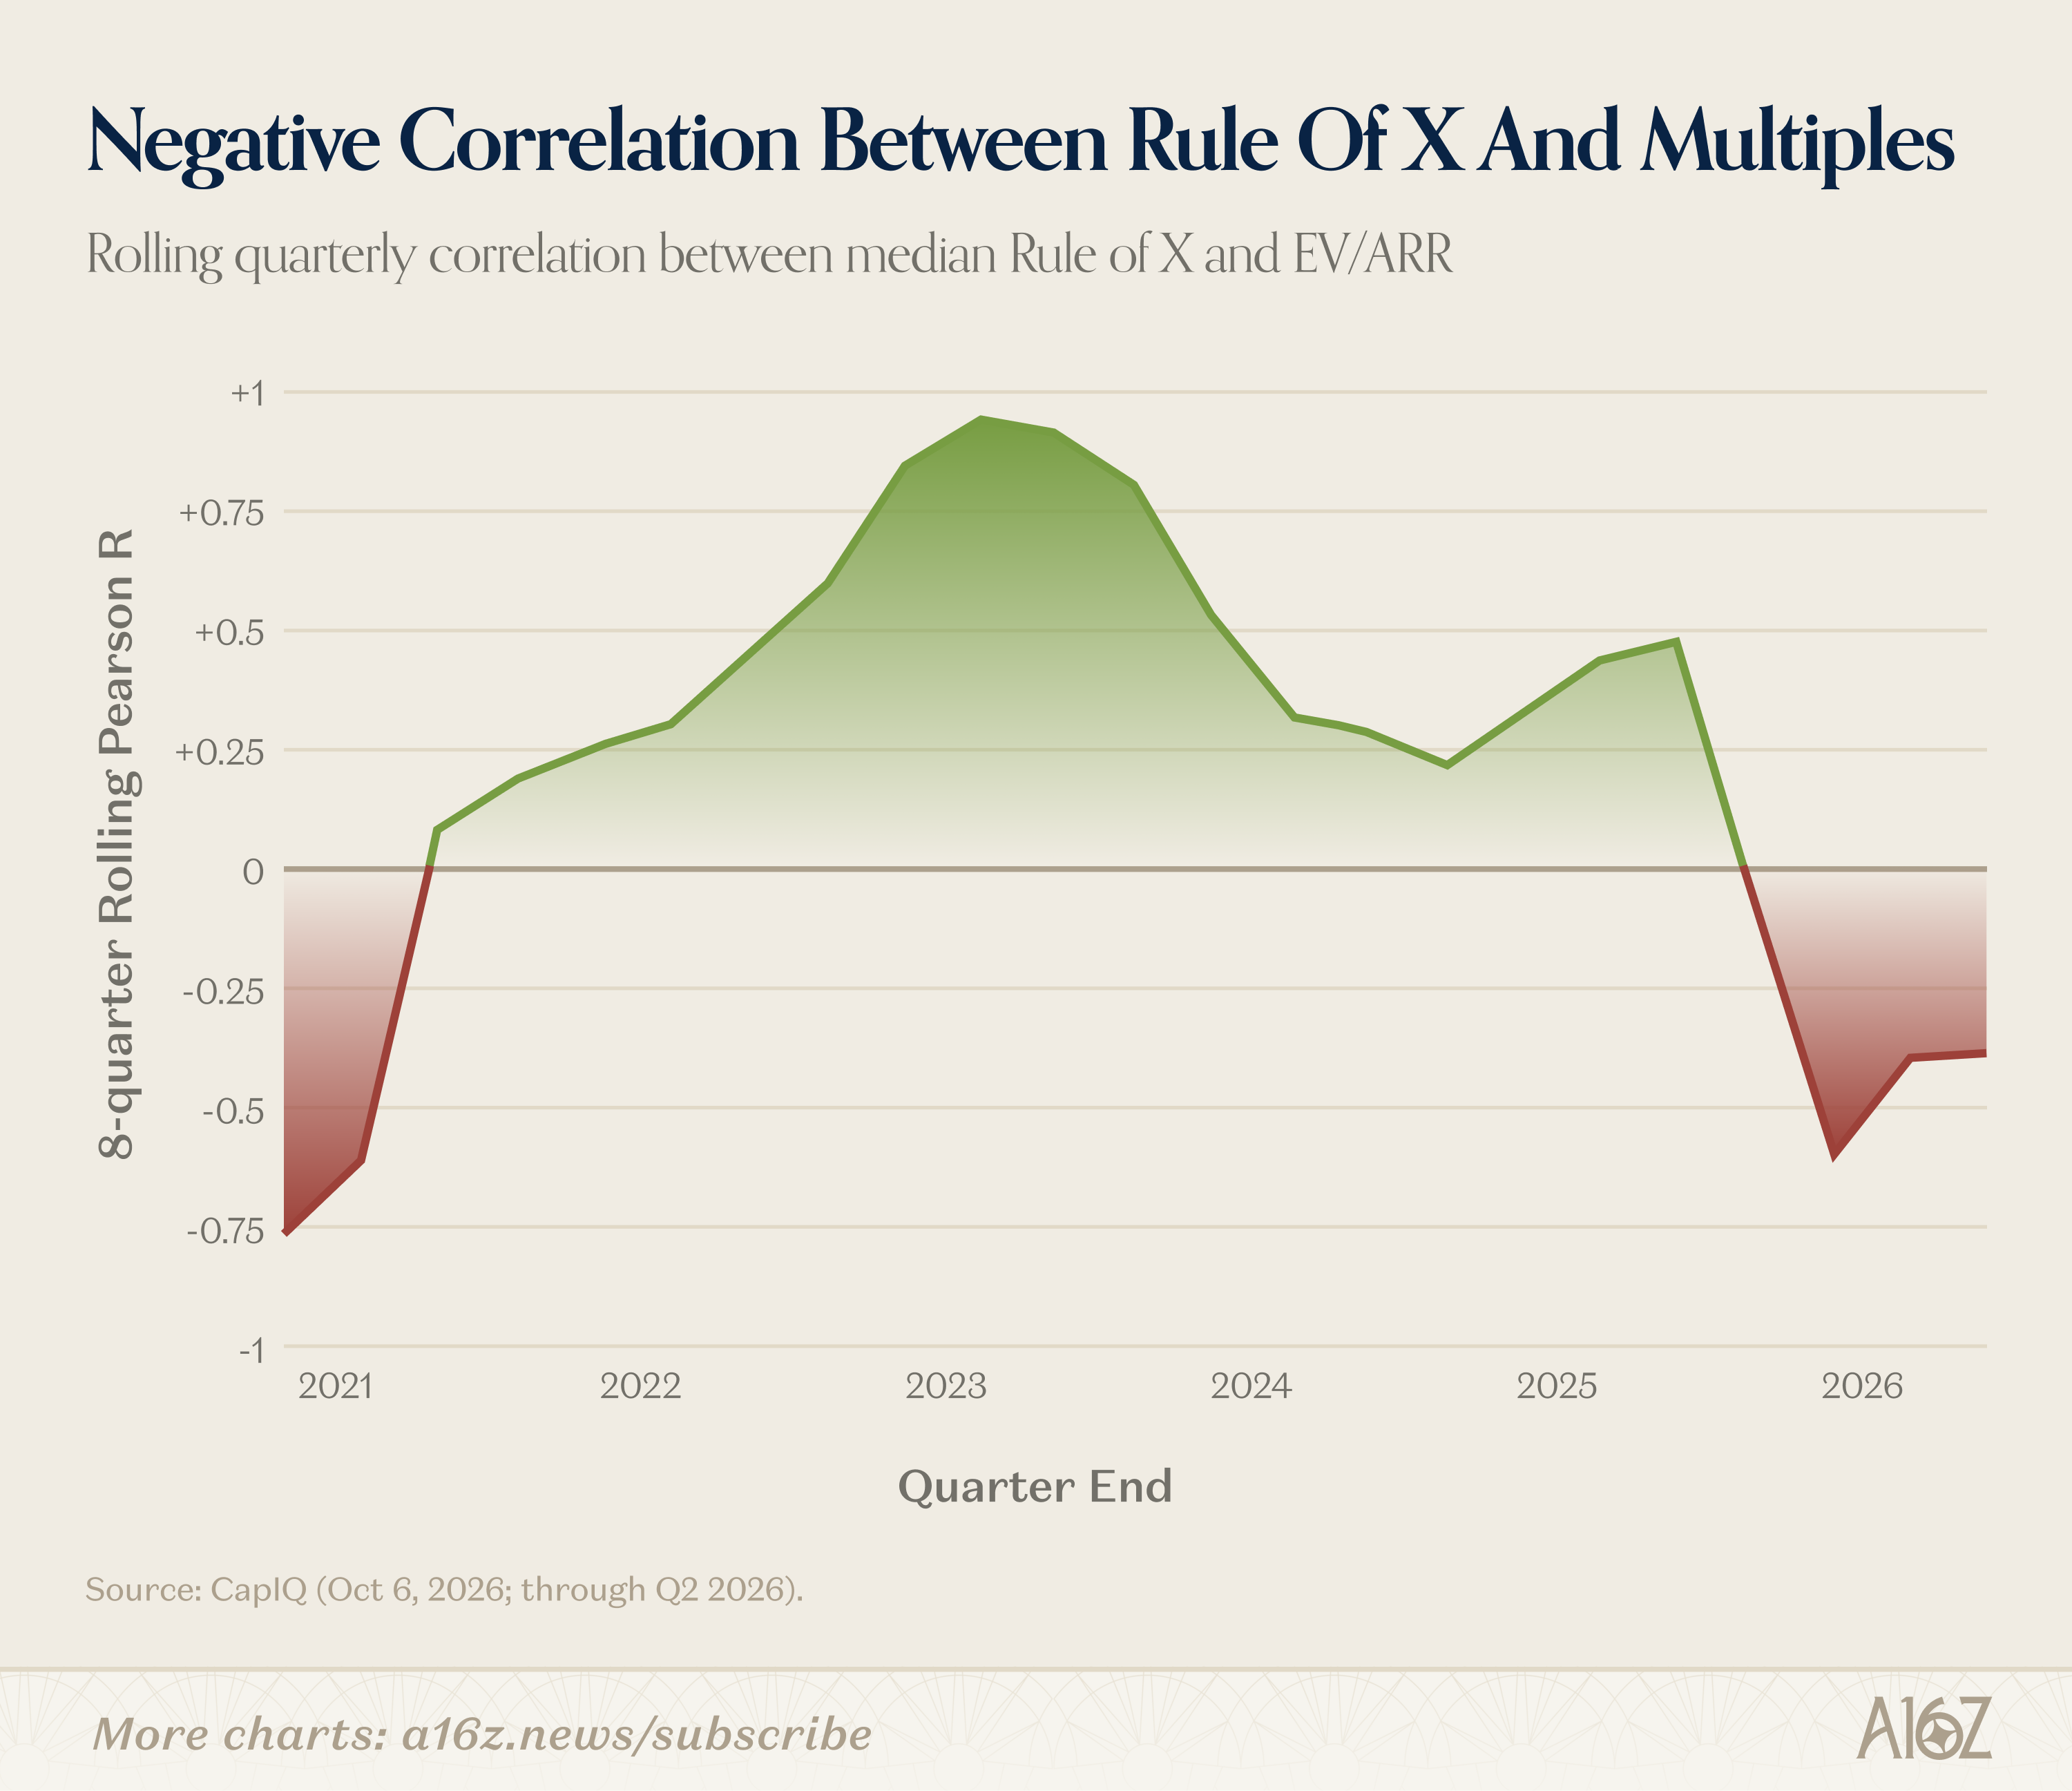
Again, it’s a weird thing. If Rule of X is a good thing, then an improving Rule of X should correspond to better multiples, and not the other way around.
So, what’s going on? The most likely explanation for why Rule of X is weakening as a signal has to do with the component parts: growth and profitability. As laid out in State of Markets, public (and private) techcos responded to post-ZIRP regime change by trading growth for profitability. What that means is that Rule of X is rising, but increased margins are doing most of the work, while growth makes a relatively smaller contribution.
But when it comes to multiples, investors put more of a premium on the latter than the former, so even if the Rule of X number is high, if growth has slowed substantially, multiples compress accordingly.
If you break techcos into their Rule of X buckets, you can see that revenue growth is just a much stronger factor than the combined Rule of X score:
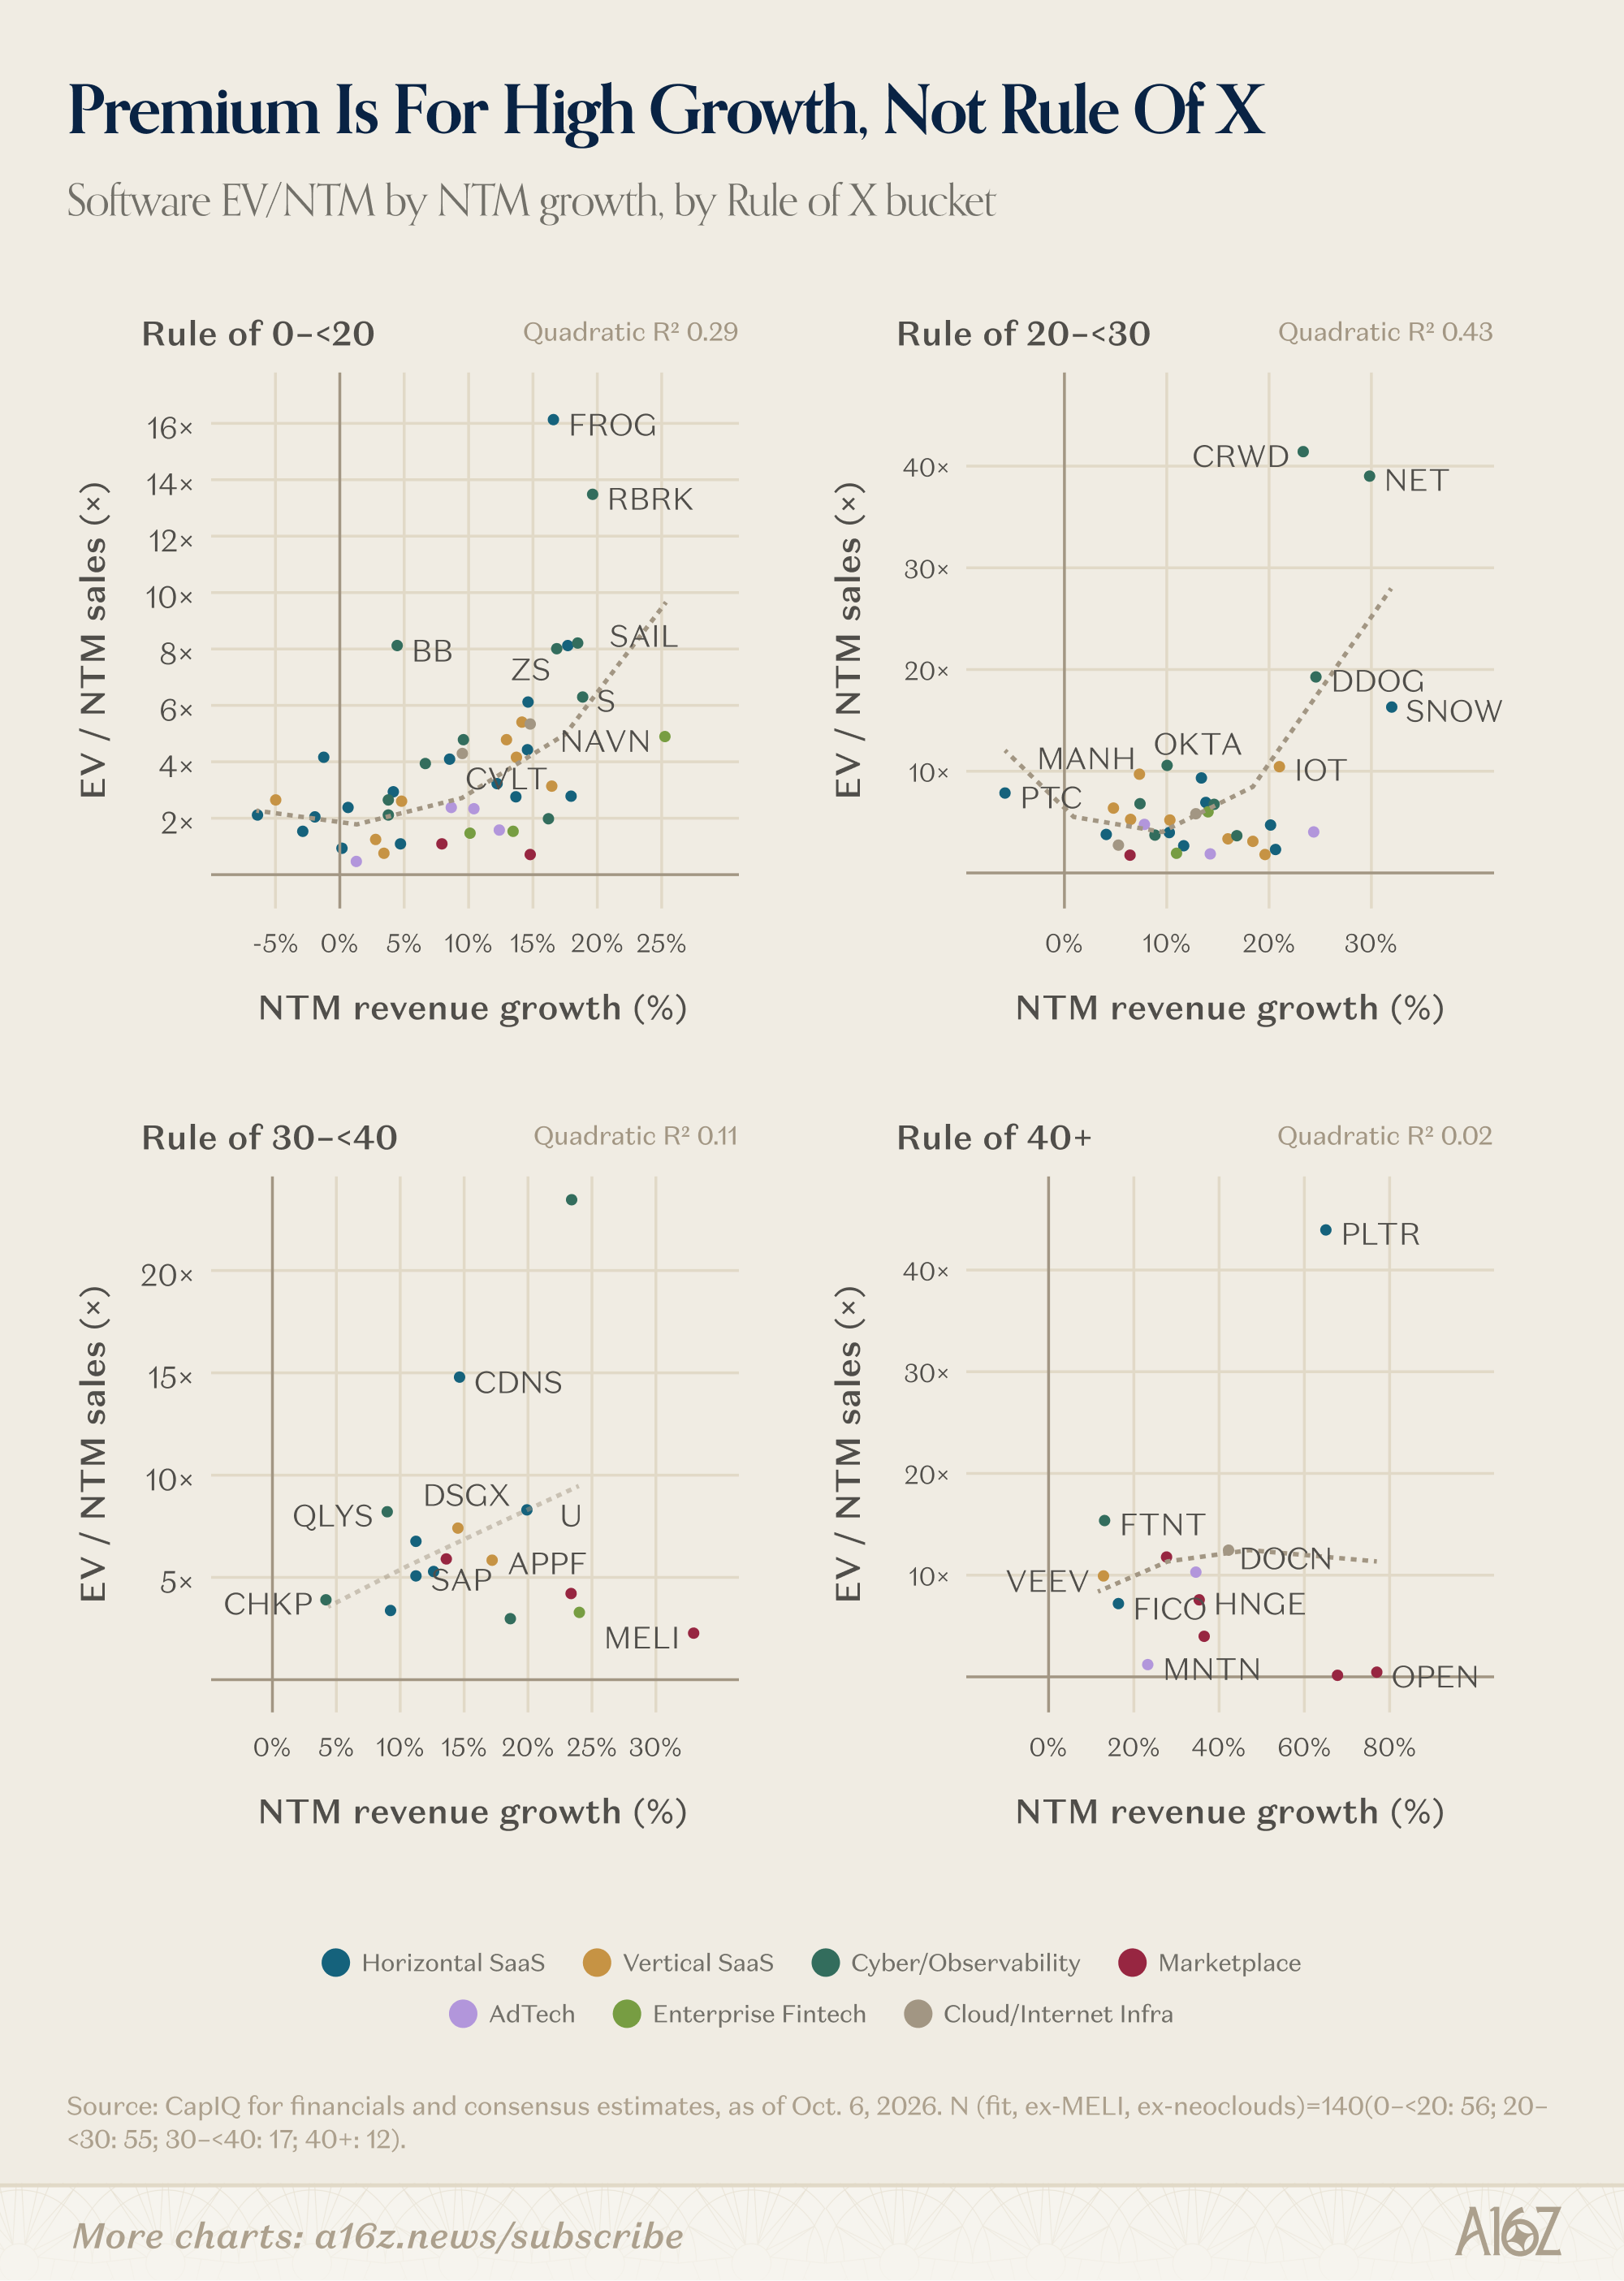
Mind the different scaling on both axes, but the general idea is pretty clear: higher growth companies tend to have higher multiples than lower growth companies with an equivalent Rule of X.
In fact, for Rule of 20 all the way to Rule of 40, most companies are clustering in the same range between 5-10x EV/NTM sales—and it’s only the fastest growers (and really the ones with perceived tailwinds at their back, i.e. cyber and observability) that fetch a premium multiple.
The point here is pretty straightforward: in this brave new world for techcos, Rule of 40 just isn’t as useful anymore as a performance benchmark. The SaaS-Prove-It regime is okay with profitability, but it really likes growth, and if you’ve got a lot of the former, but not much of the latter, then the market isn’t very impressed, Rule of X be damned. If you’ve got both, then that’s all the better, but there aren’t too many of those.
Atoms keep winning, but what about everyone else?
Speaking of performance metrics where the headline picture may be obscuring some parts of what lies below, consider the recent downturn in the breadth of positive earnings revisions:
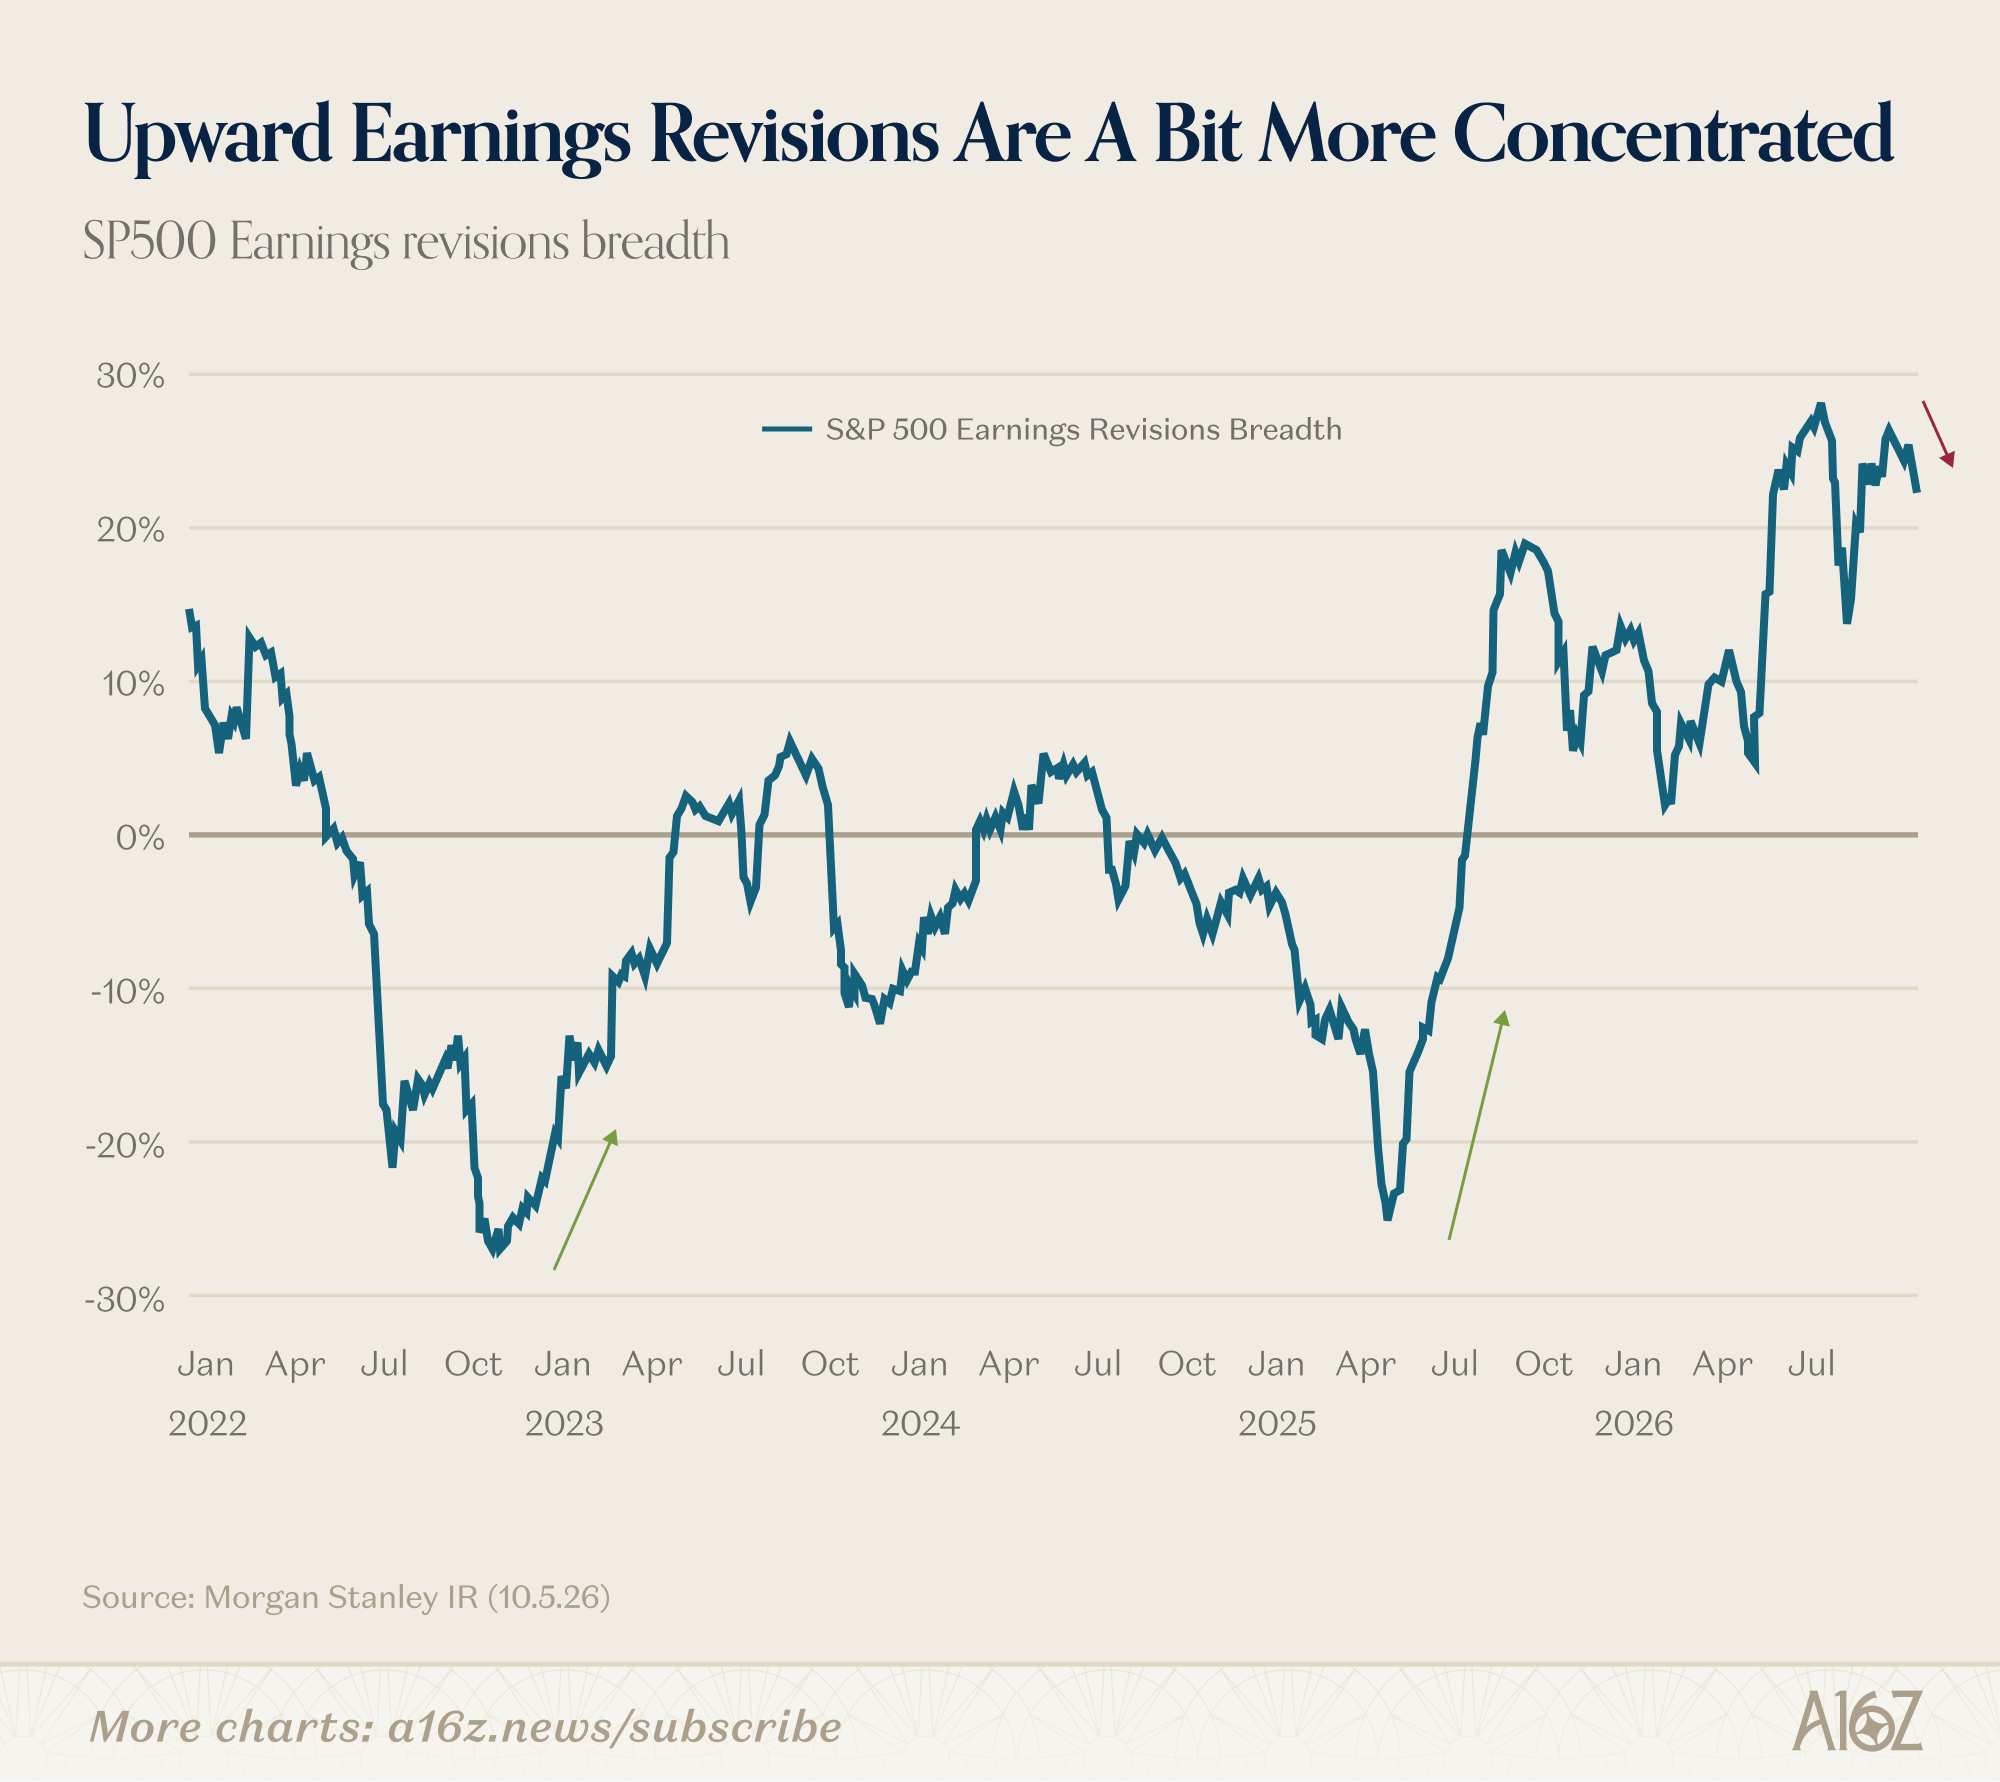
When breadth is positive (as it’s been since July of ‘25), that means earnings revisions are relatively broad-based . . . and when it’s negative, it means the good news is limited to a narrower subset of companies.
While revisions breadth is still positive, things have narrowed recently, with the implication that analyst optimism is training its fire, more so than before.
And where, might you ask, does even-more-optimism still abound? It’s really only in two sectors: energy and tech, but more specifically hardware, not software:
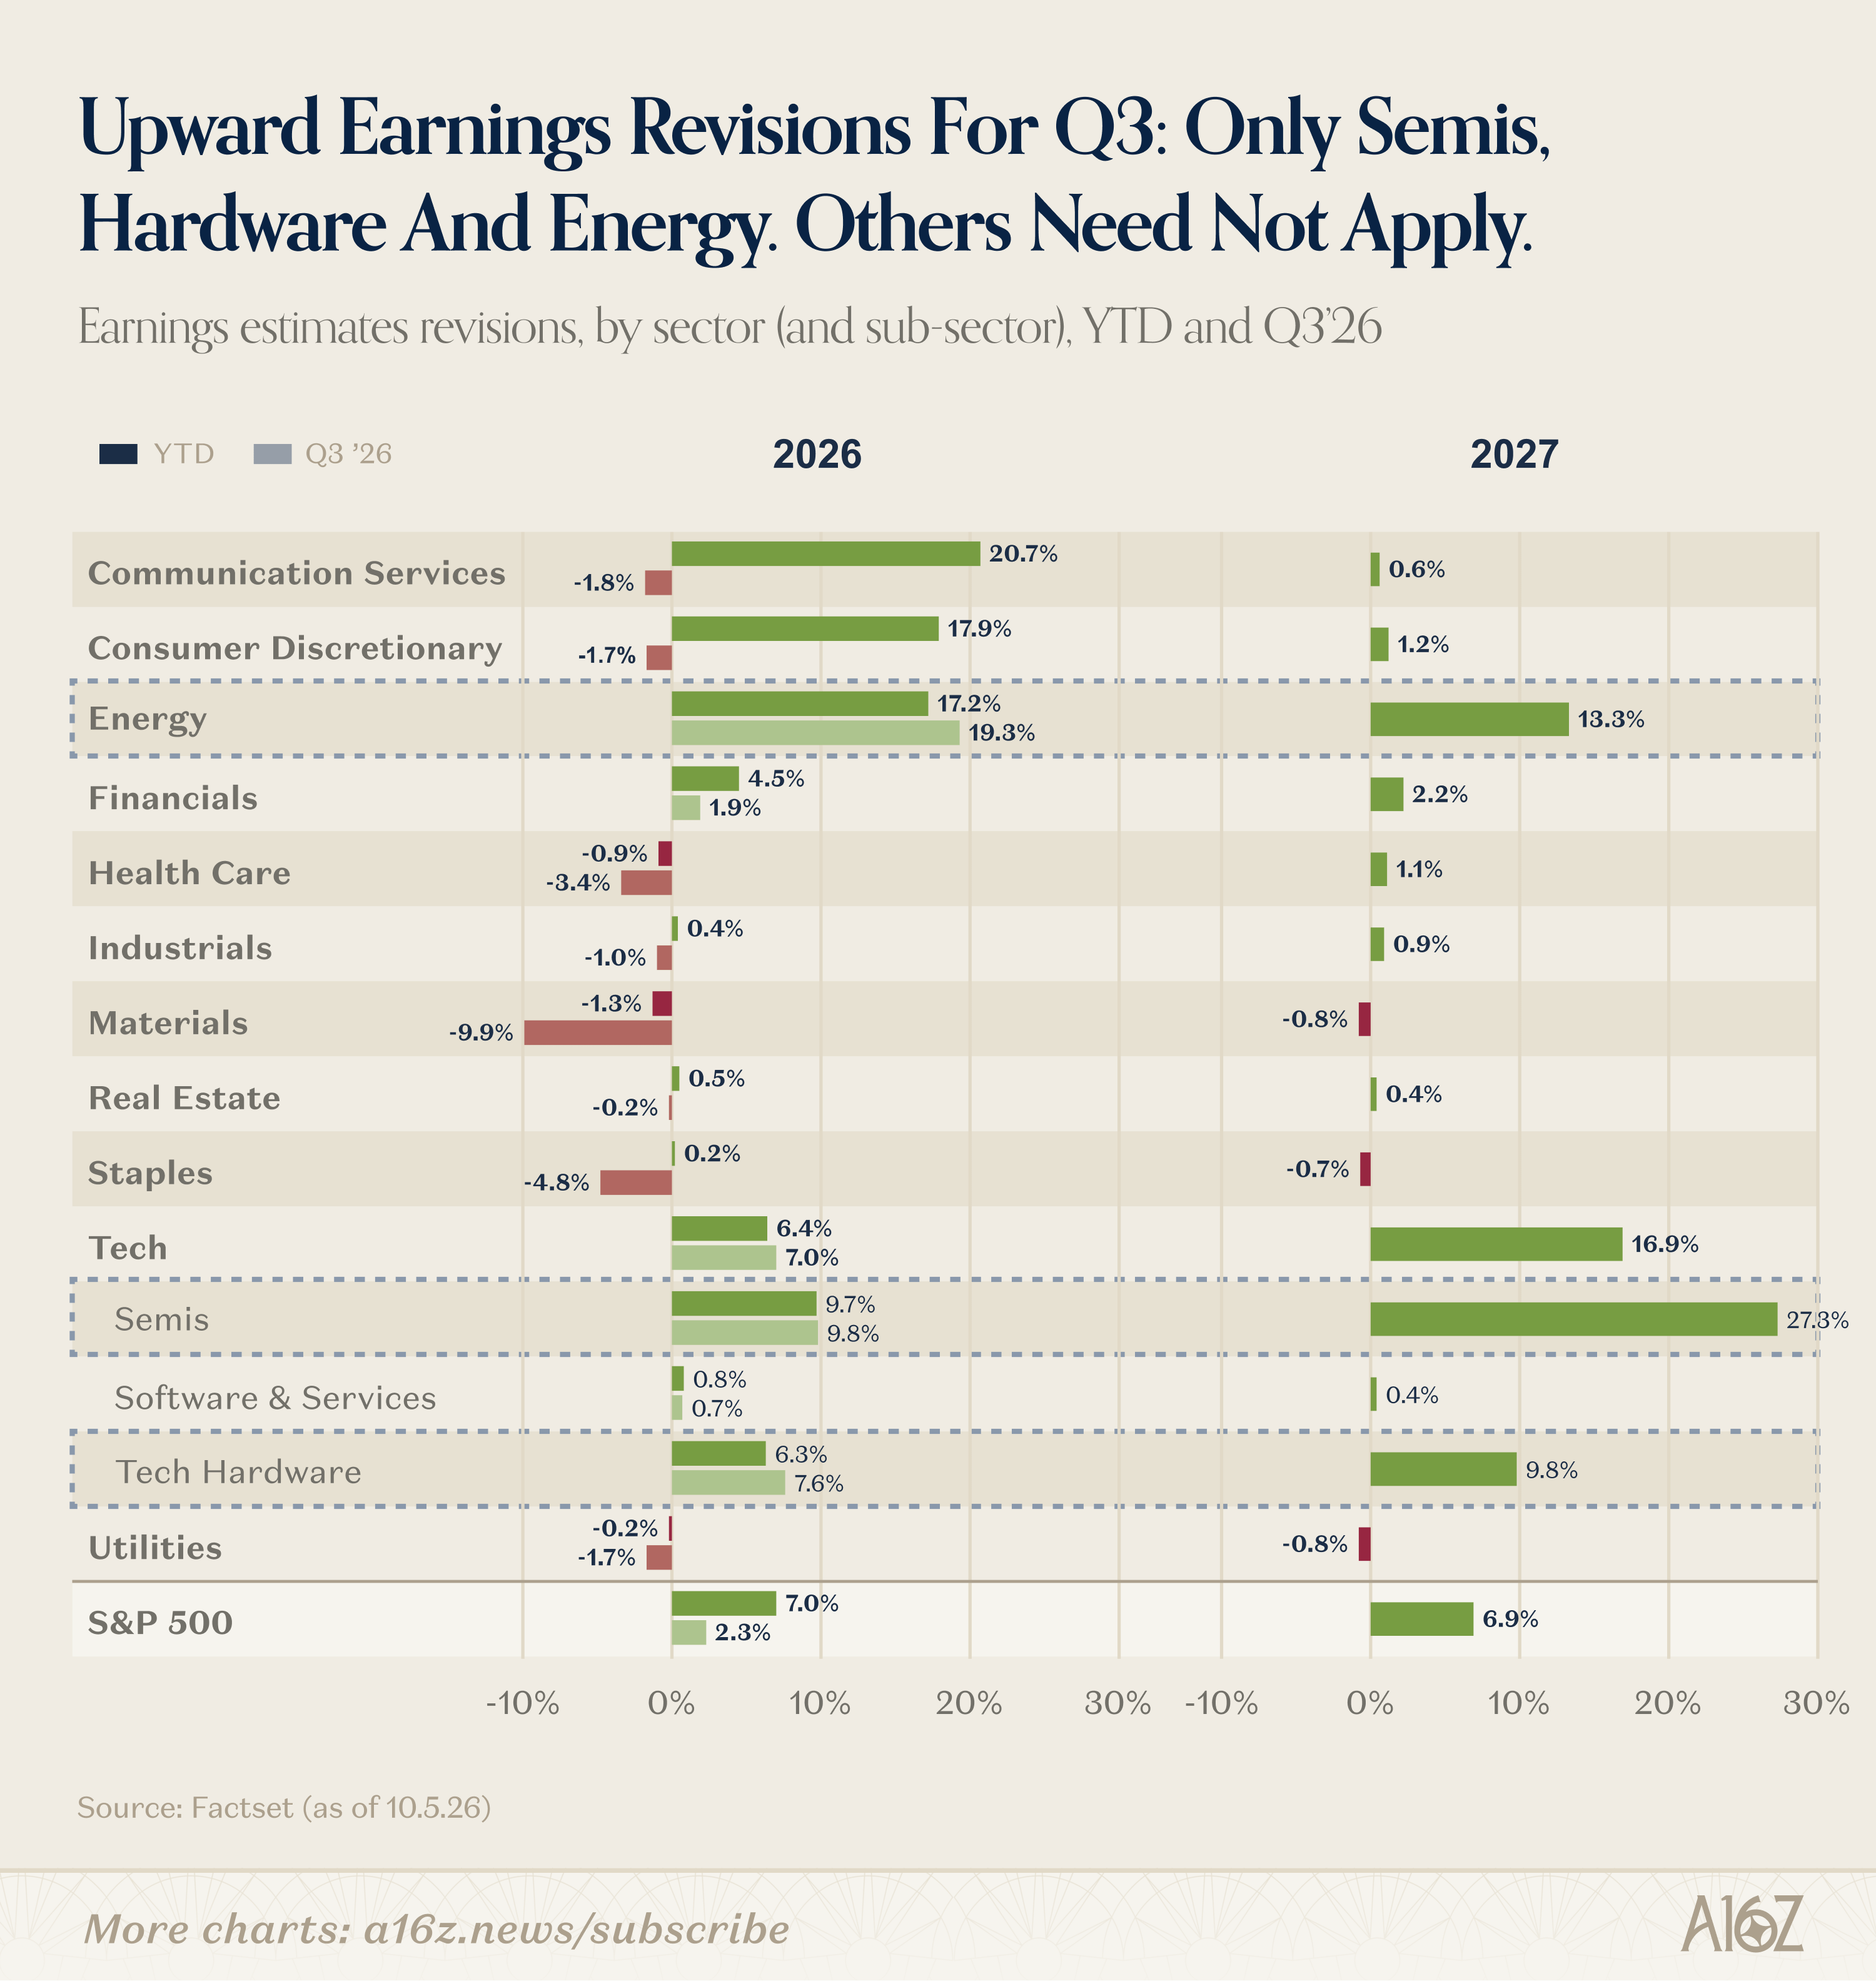
For the year, earnings revisions have been positive across the board (outside of utilities), but for Q3, the story is different: Energy improved, Tech improved—driven almost entirely by semis and hardware, with only the slightest uptick for software—and Financials improved modestly, as well, but every other sector experienced a downward revision from analysts. 2027 is a similar story: Energy, Hardware and Semis are the clear analyst winners, while the rest of the market, not so much.
In other words, expectations are that profits will continue to flow to Atoms, substantially more so than Bits.
AI capex shows no signs of slowing—if anything, the industrial backlog is increasingly broad-based:
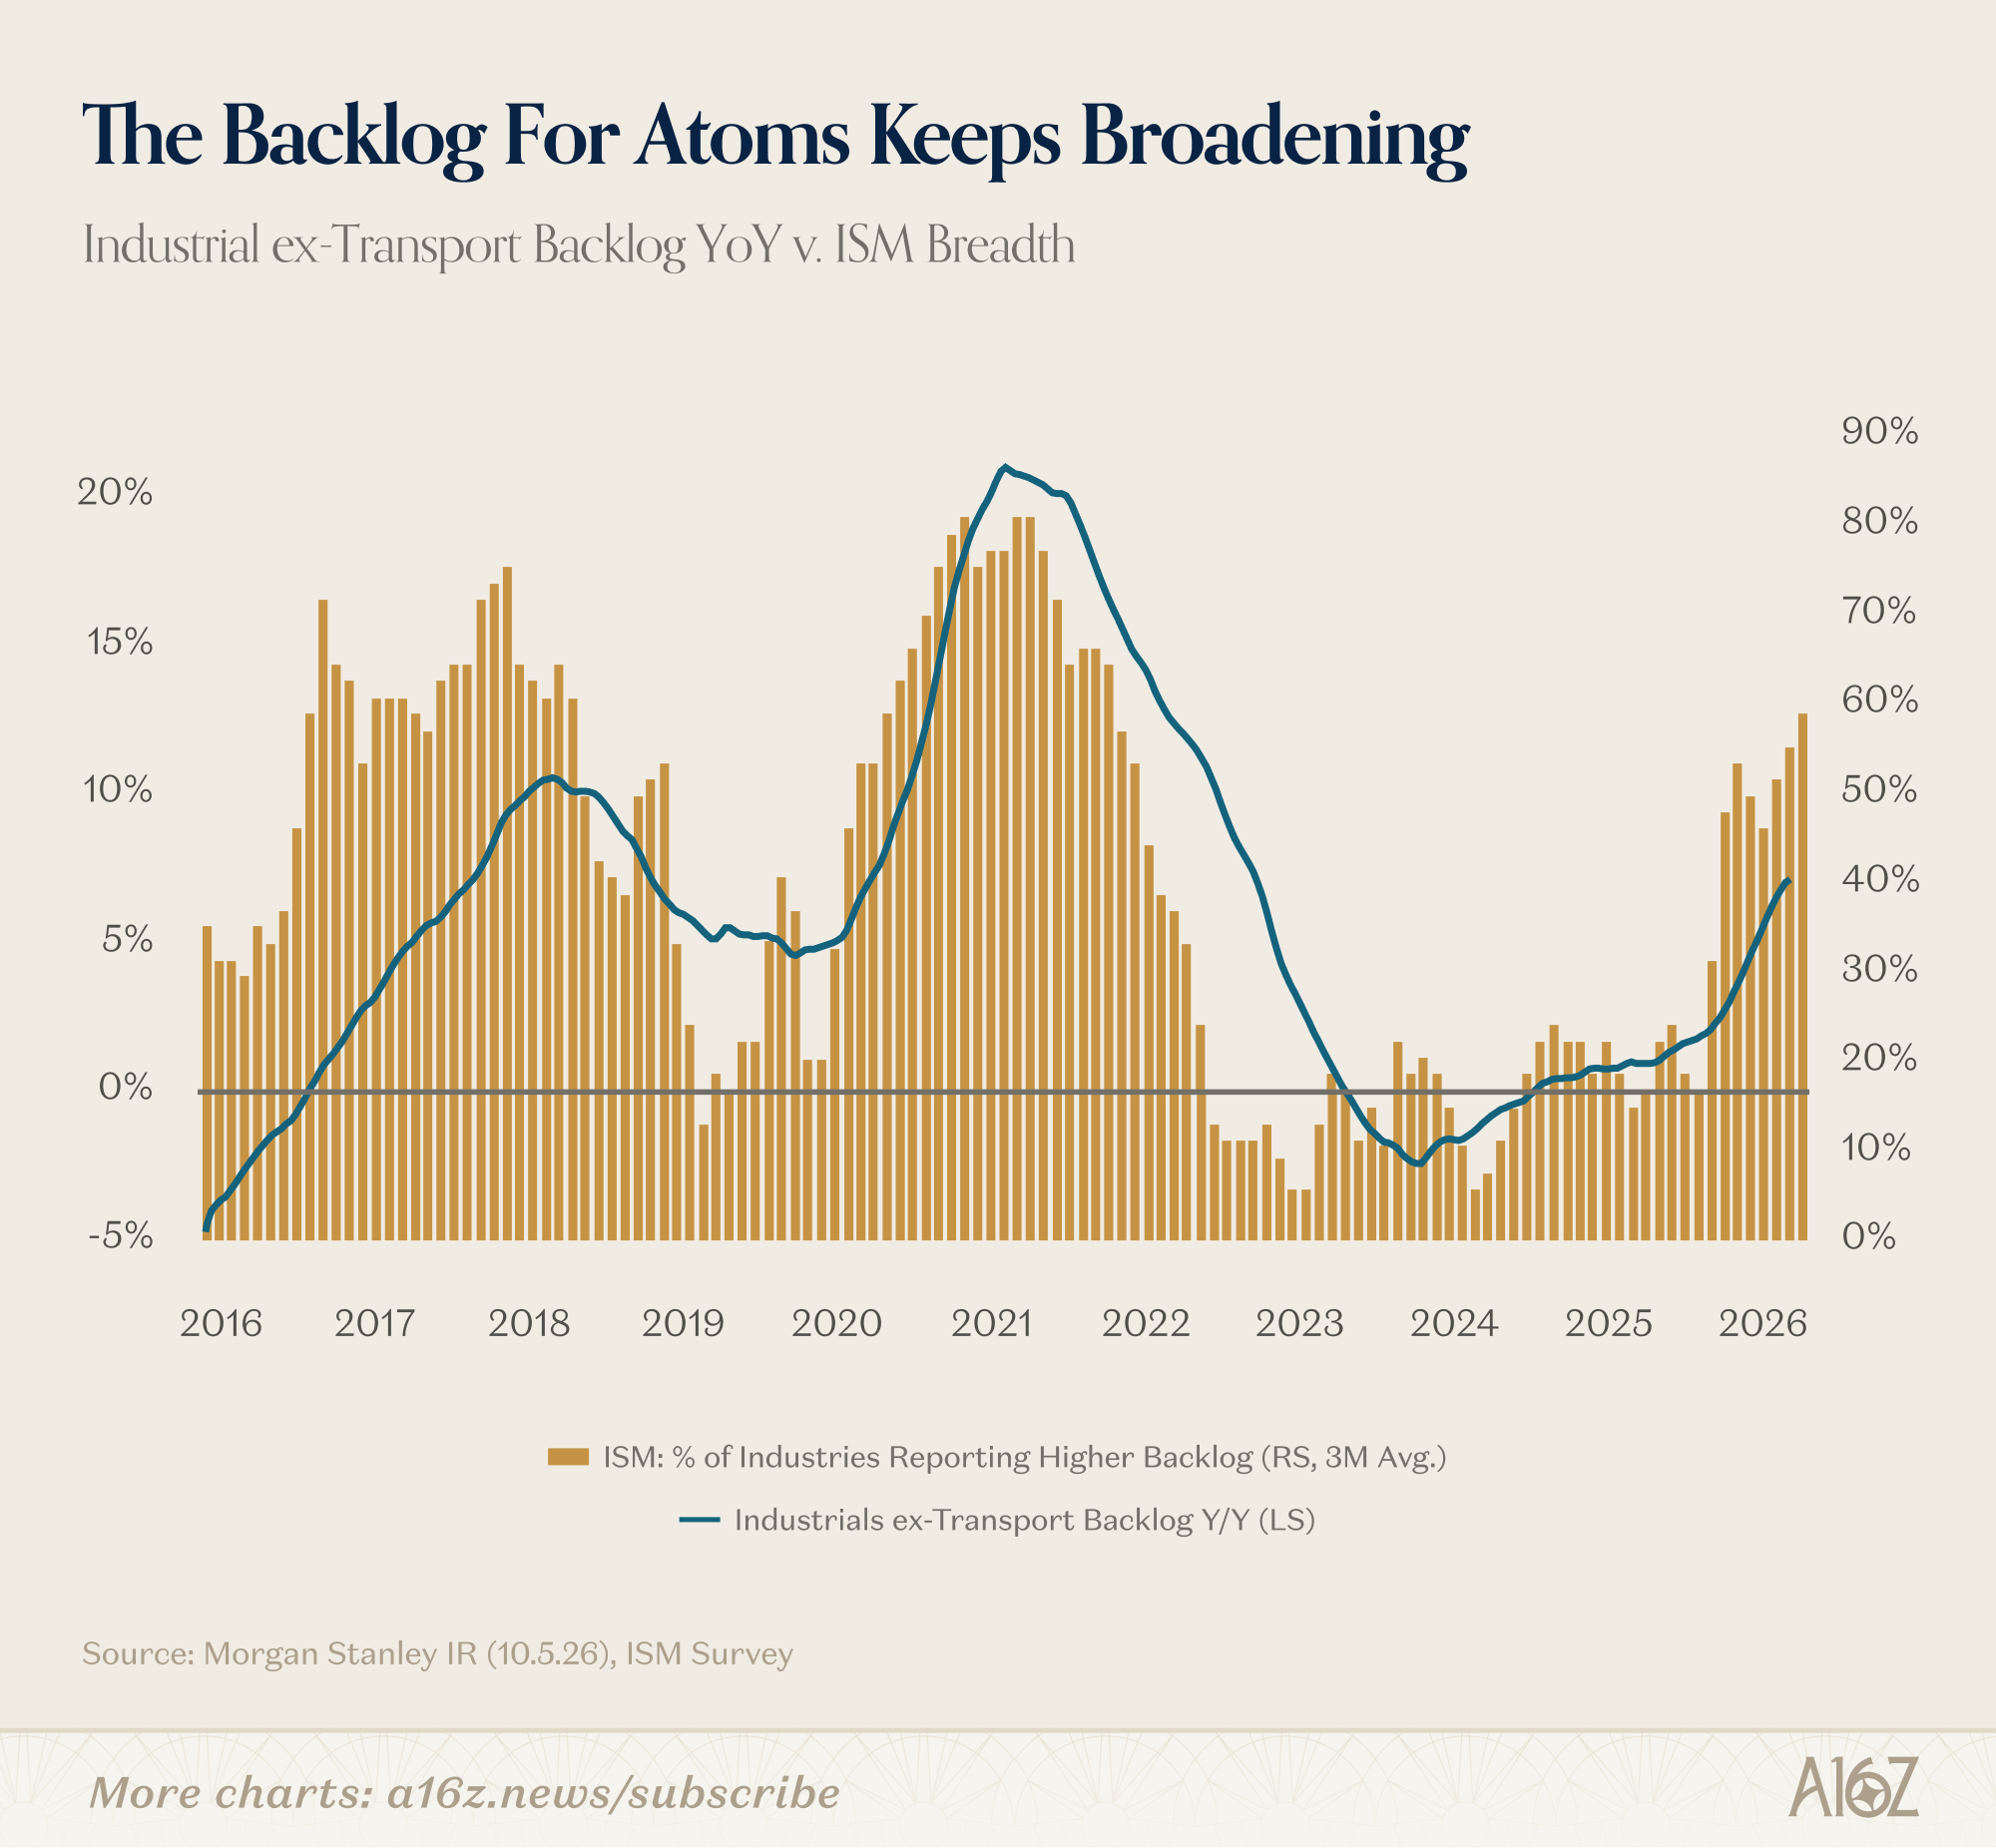
As per the ISM, the share of industrial industries reporting a higher order backlog is now ~60%, which is the highest it’s been since pandemania.
At the same time as spending on the infra layer keeps piling up, there is some evidence that spending on everything else—while still high—is beginning to taper:

According to Carlyle’s private portfolio company data, shipments of AI hardware are still climbing at their exponential pace, while the “other side of the AI spend coin,” i.e. growth of the broader category of tech-spend, has leveled off at ~30%.
30% growth is pretty high—and much higher than before—but growth does not appear to be accelerating any longer, which is again, not the case when it comes to hardware. The implication is that after a year of better than expected results for pretty much everyone, that upside surprise may be narrowing.
Put another way, while the AI buildout keeps embiggering, that hasn’t changed expectations for how those benefits may flow through to the rest of the ecosystem—the epic run on atoms is picking up speed, even as it runs ahead of the field. Those unchanged-to-downwardly-revised forward estimates for everyone outside of AI infra are backed up by some hard data, as well, insofar as broader IT spending, while still growing, does not appear to be accelerating.
Of course, the fact that analysts have made upward revisions to their estimates for most of the year means that they’ve gotten this “wrong” before, but for now, consensus is signaling that the AI buildout will stay in the driver’s seat, even more so than before.
AI Has Come For Call Centers, After All?
While the broader evidence of the AI Jobs Apocalypse remains weak to non-existent—and indeed, there’s evidence that AI has increased demand for technical and hard-hat roles—there is some data that shows at least one “AI exposed” category is taking it on the chin: call centers.
According to data from Revelio, global call-center employment has gone sharply negative, after more than a decade of fairly consistent growth:
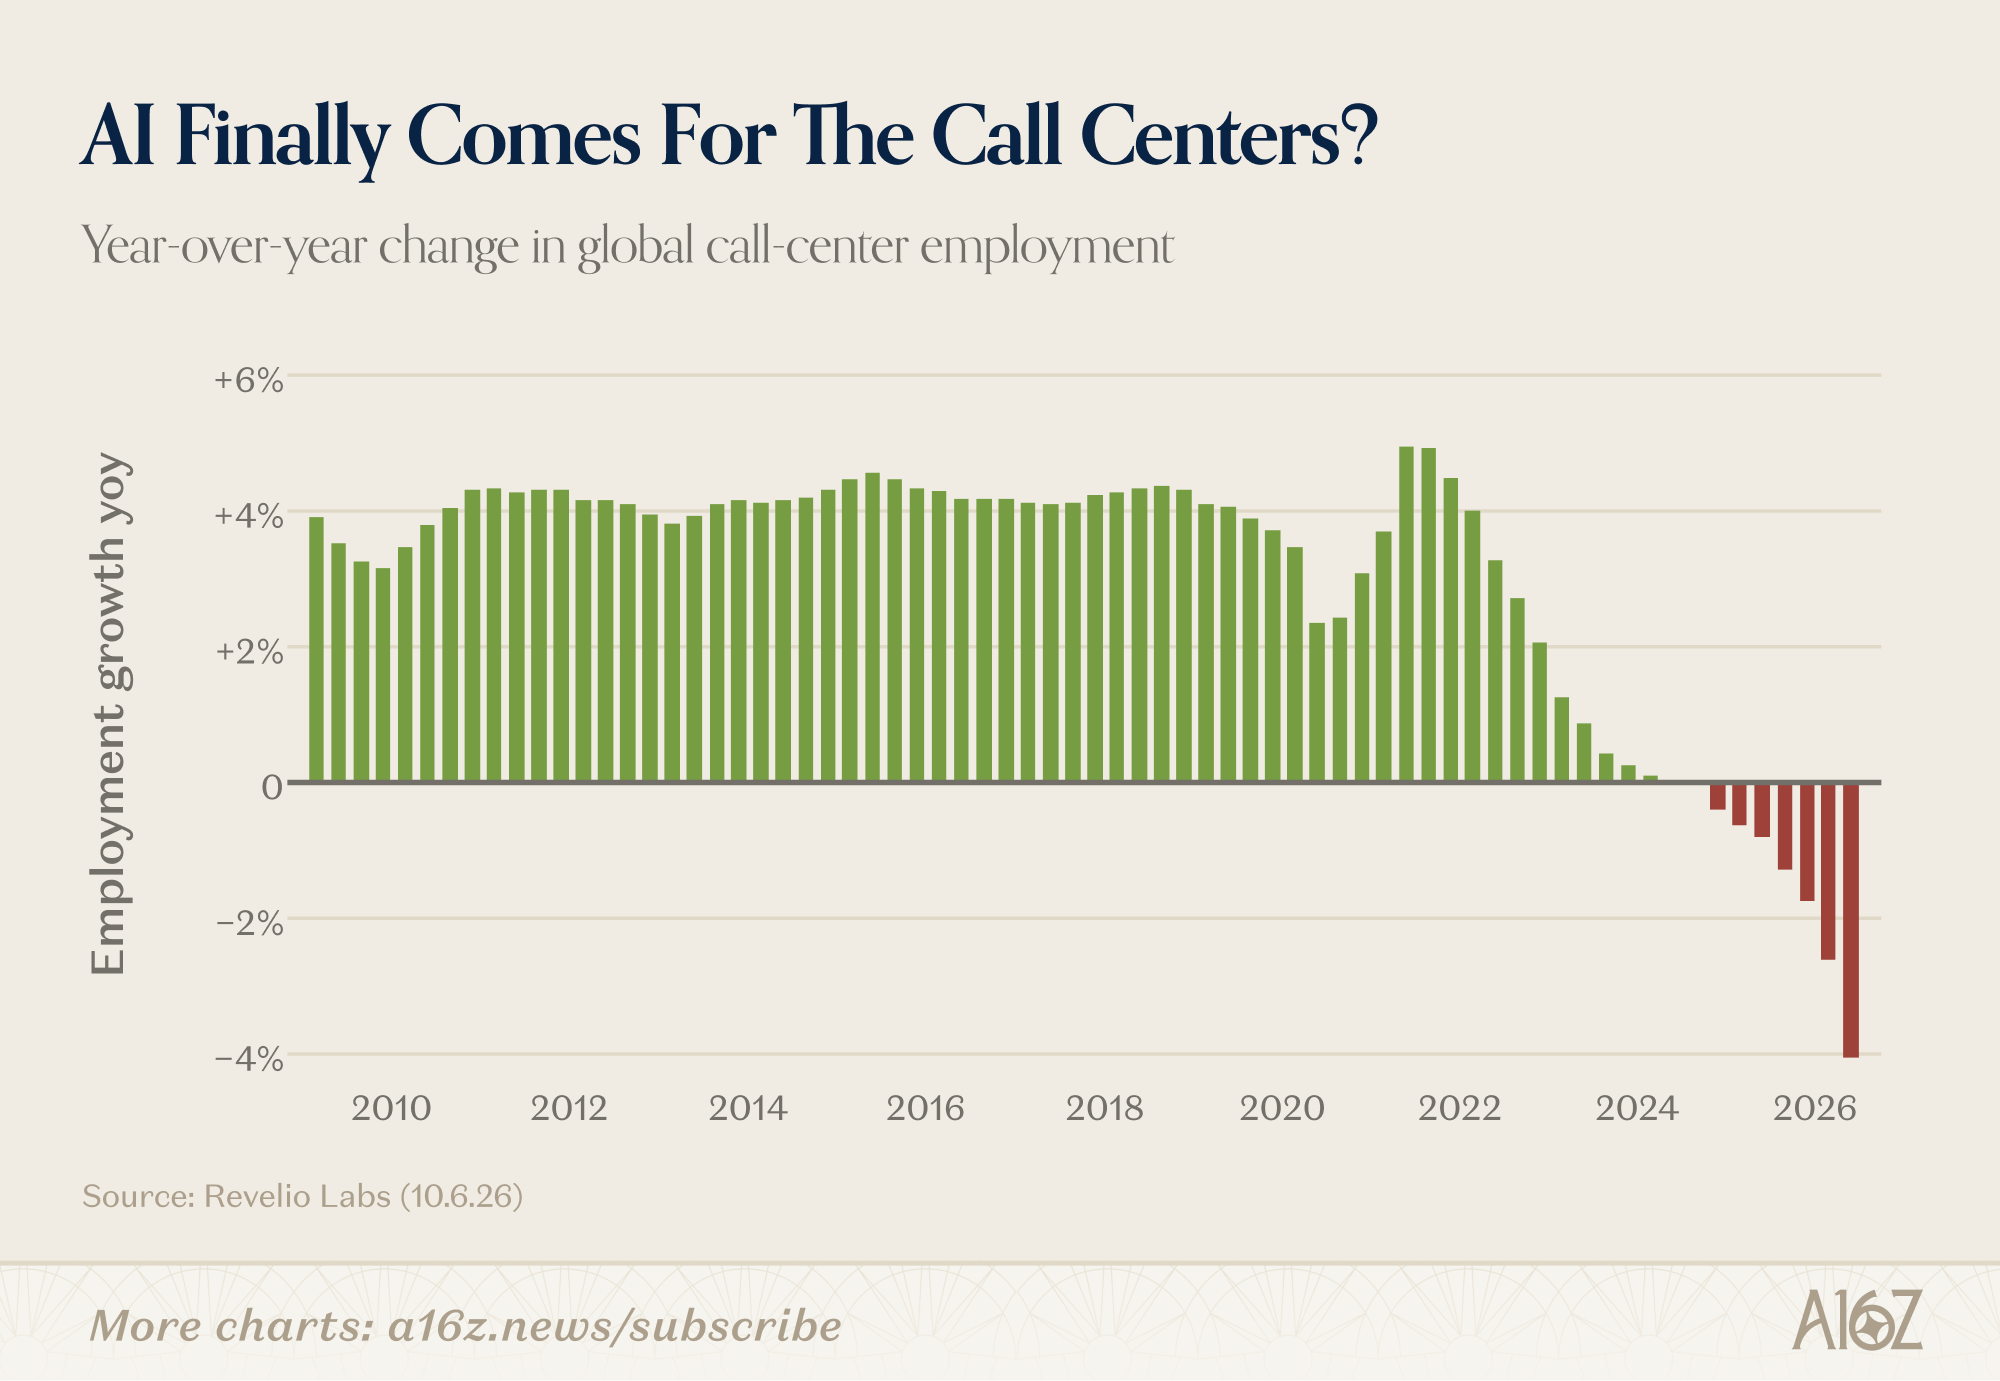
To be fair, growth began slowing when interest rates went up, which is slightly before GPT was released into the wild . . . but the downtrend has steepened substantially since then, and has accelerated of late.
Indeed, while lower-middle-income countries were relatively insulated from the downturn through most of 2024, even there growth has gone negative:
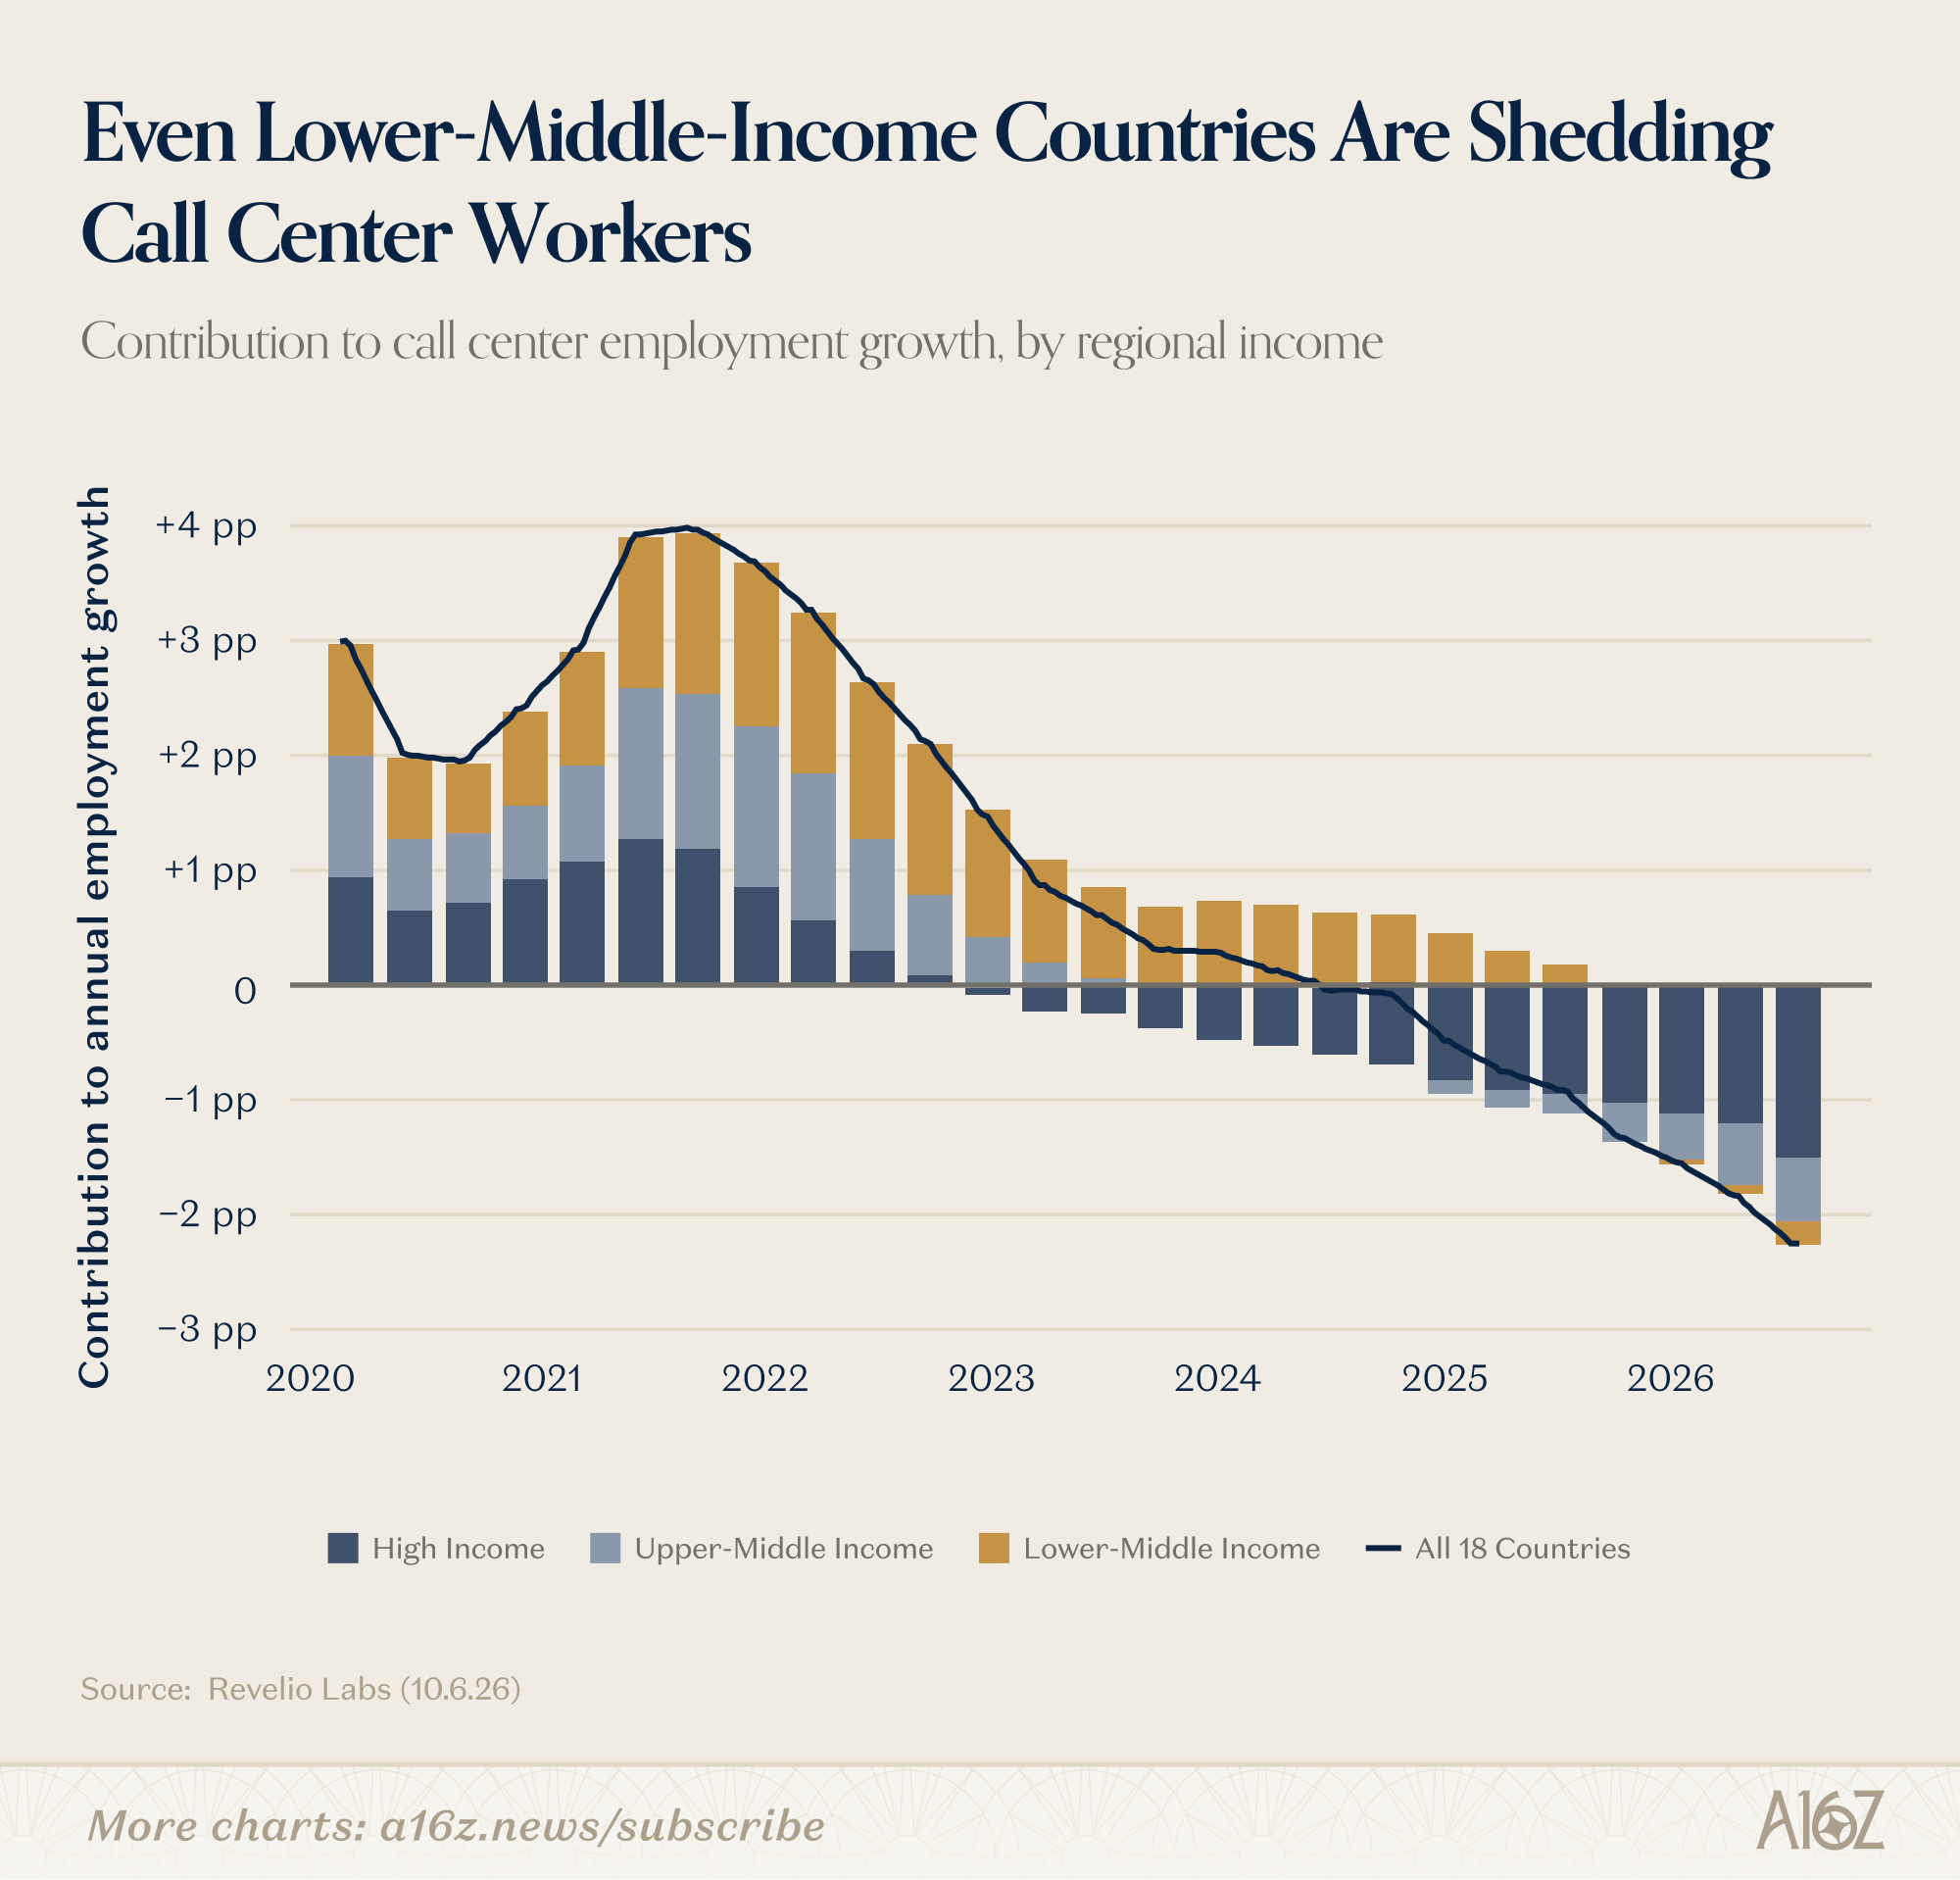
While higher-income countries went negative in 2022, lower-middle income countries stayed positive for another ~2 years. But, as of Q4’25, call center employment growth has gone negative everywhere, even in the poorest countries.
And lest one think that the downturn isn’t AI-driven (or specific to call centers), that too does not appear to be the case:
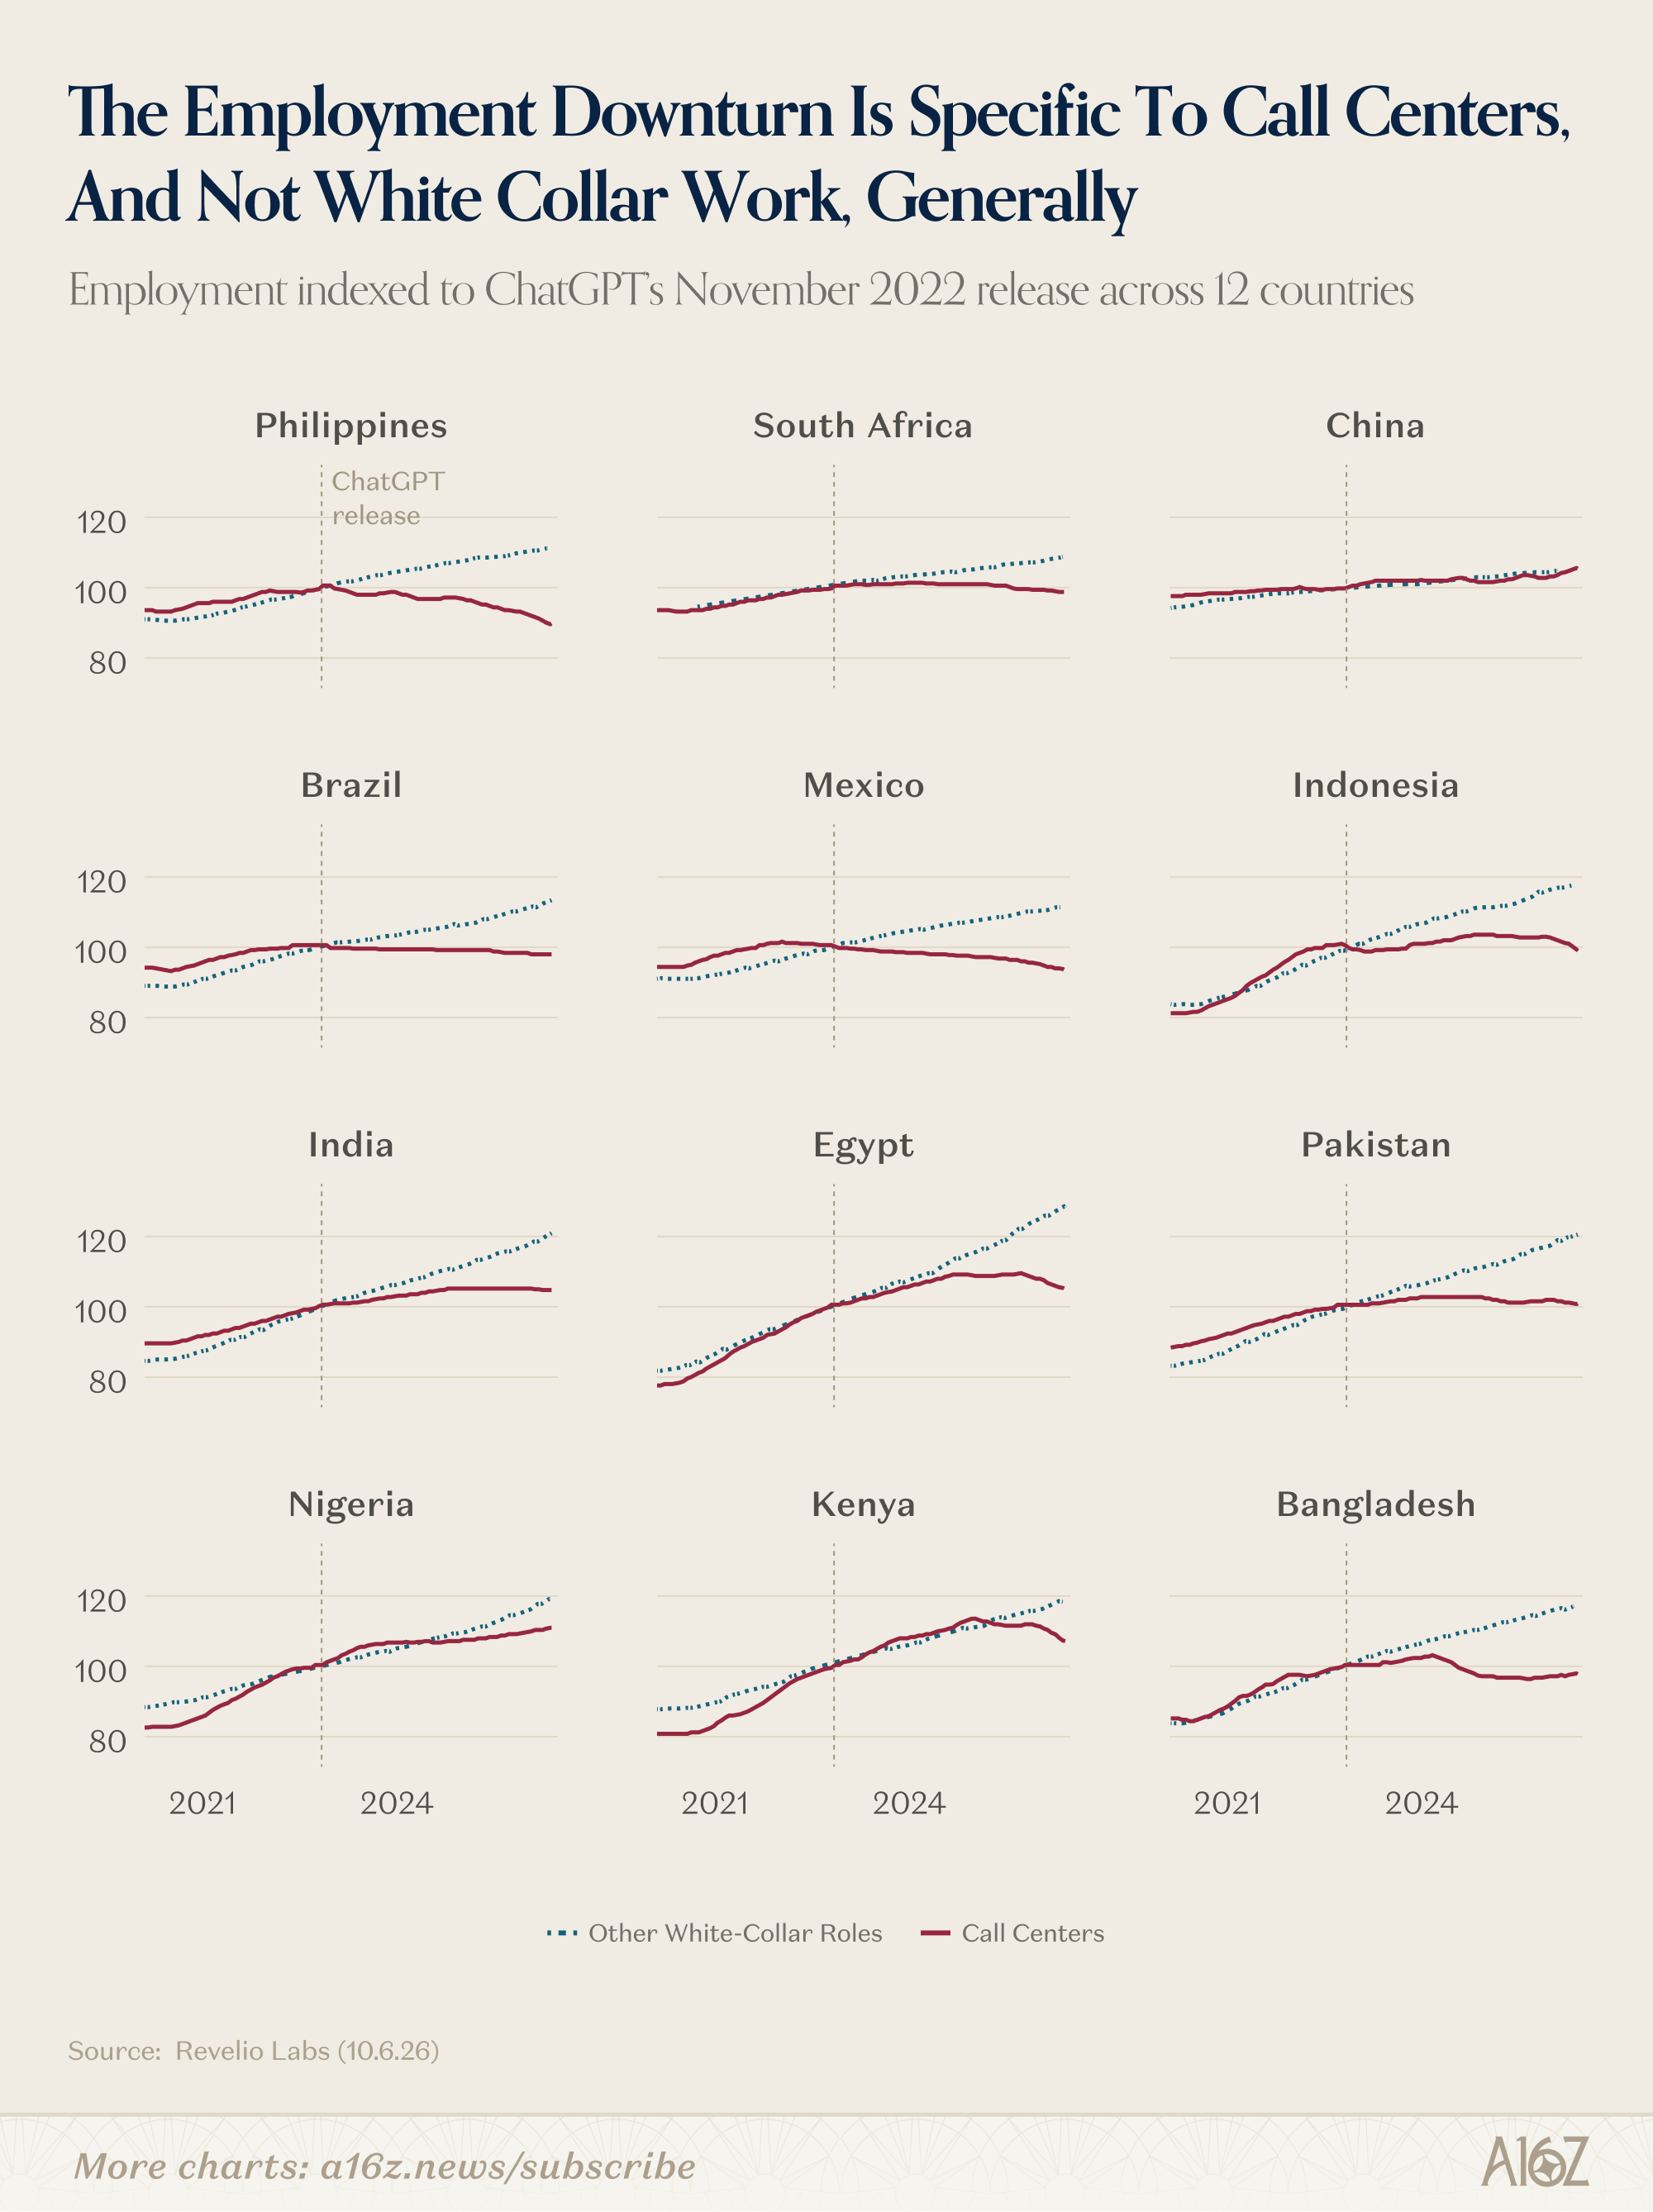
Outside of China, interestingly enough, call center employment has lagged the broader category of white-collar service work in every major non-US market for call centers.
Could there be other reasons for below-trend call center employment, besides AI? Probably, but call centers were always expected to be a likely target of substitution, so it seems reasonable to conclude that AI is the driver here. In the US, at least, the good news is that unemployment has been relatively stable, suggesting that the people who used to work in call centers appear to have found employment elsewhere . . . but changes are definitely underway, and one would expect more to come.


This newsletter is provided for informational purposes only, and should not be relied upon as legal, business, investment, or tax advice. Furthermore, this content is not investment advice, nor is it intended for use by any investors or prospective investors in any a16z funds. This newsletter may link to other websites or contain other information obtained from third-party sources - a16z has not independently verified nor makes any representations about the current or enduring accuracy of such information. If this content includes third-party advertisements, a16z has not reviewed such advertisements and does not endorse any advertising content or related companies contained therein. Any investments or portfolio companies mentioned, referred to, or described are not representative of all investments in vehicles managed by a16z; visit https://a16z.com/investment-list/ for a full list of investments. Other important information can be found at a16z.com/disclosures. You’re receiving this newsletter since you opted in earlier; if you would like to opt out of future newsletters you may unsubscribe immediately.
Call centers were the job everyone predicted AI would hit first, so it is striking that employment growth only turned negative in the poorest markets around late 2025. That lag says a lot about how slowly real firms swap out working systems, even when the tool is good enough. The China exception is interesting too. It would be worth knowing whether that reflects state-backed employment or just a different mix of service work there. On the prediction markets section, a near-zero partisan coefficient is reassuring for anyone worried that these platforms simply mirror the politics of their traders. With Kalshi and others pulling serious volume ahead of the midterms, November could be a useful stress test of that finding.