

Charts of the Week: RTO Stalled
Remote work to my job?; AI SMB Power Users; Lil’ Biotech


America | Tech | Opinion | Culture | Charts

RTO Interrupted
It’s been about 5 years since the grand post-pandemic re-opening, and people still aren’t going to the office as much as they used to:
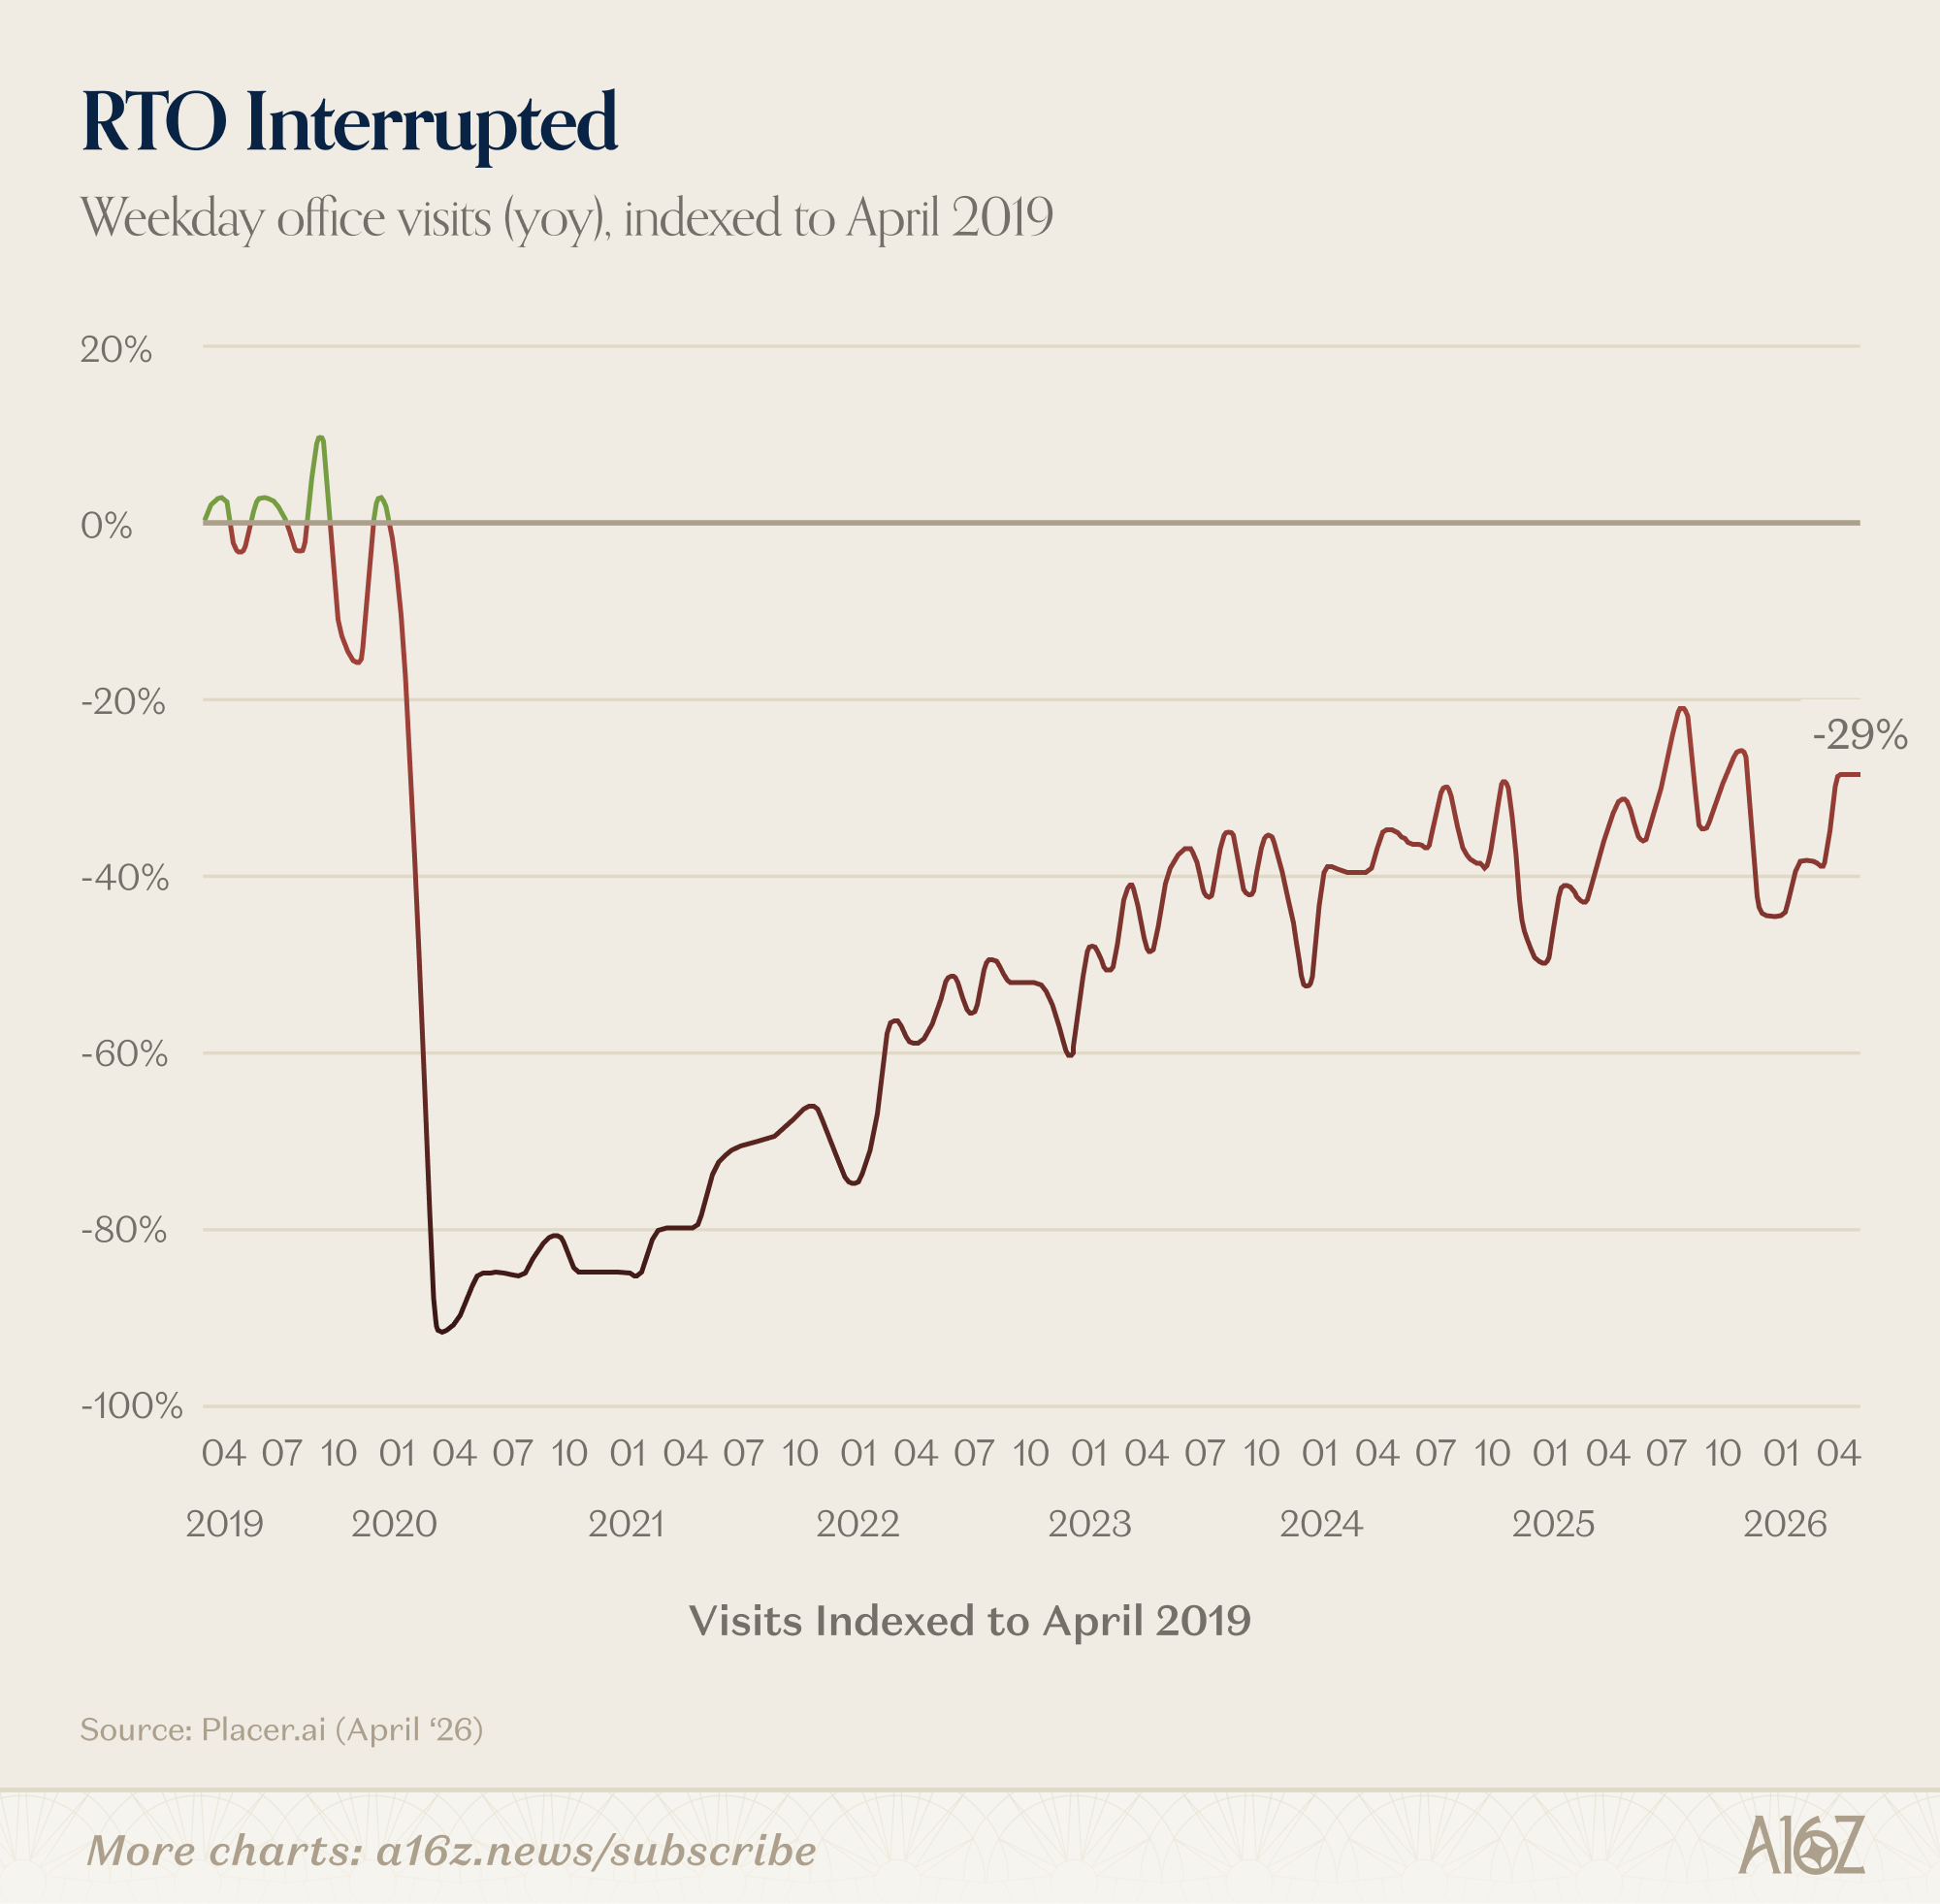
According to Placer’s foot-traffic data, nationwide weekday office visits are at ~70% of pre-pandemic levels.
There is, of course, some city–by-city variation. New York City, for example, is only about 10% below the “back to normal” baseline. Denver, Chicago, and SF, on the other hand, are all still 40%+ off their previous high watermarks (although SF has been improving, of late).
The reality is that across the country, lots and lots of office space is still sitting empty:
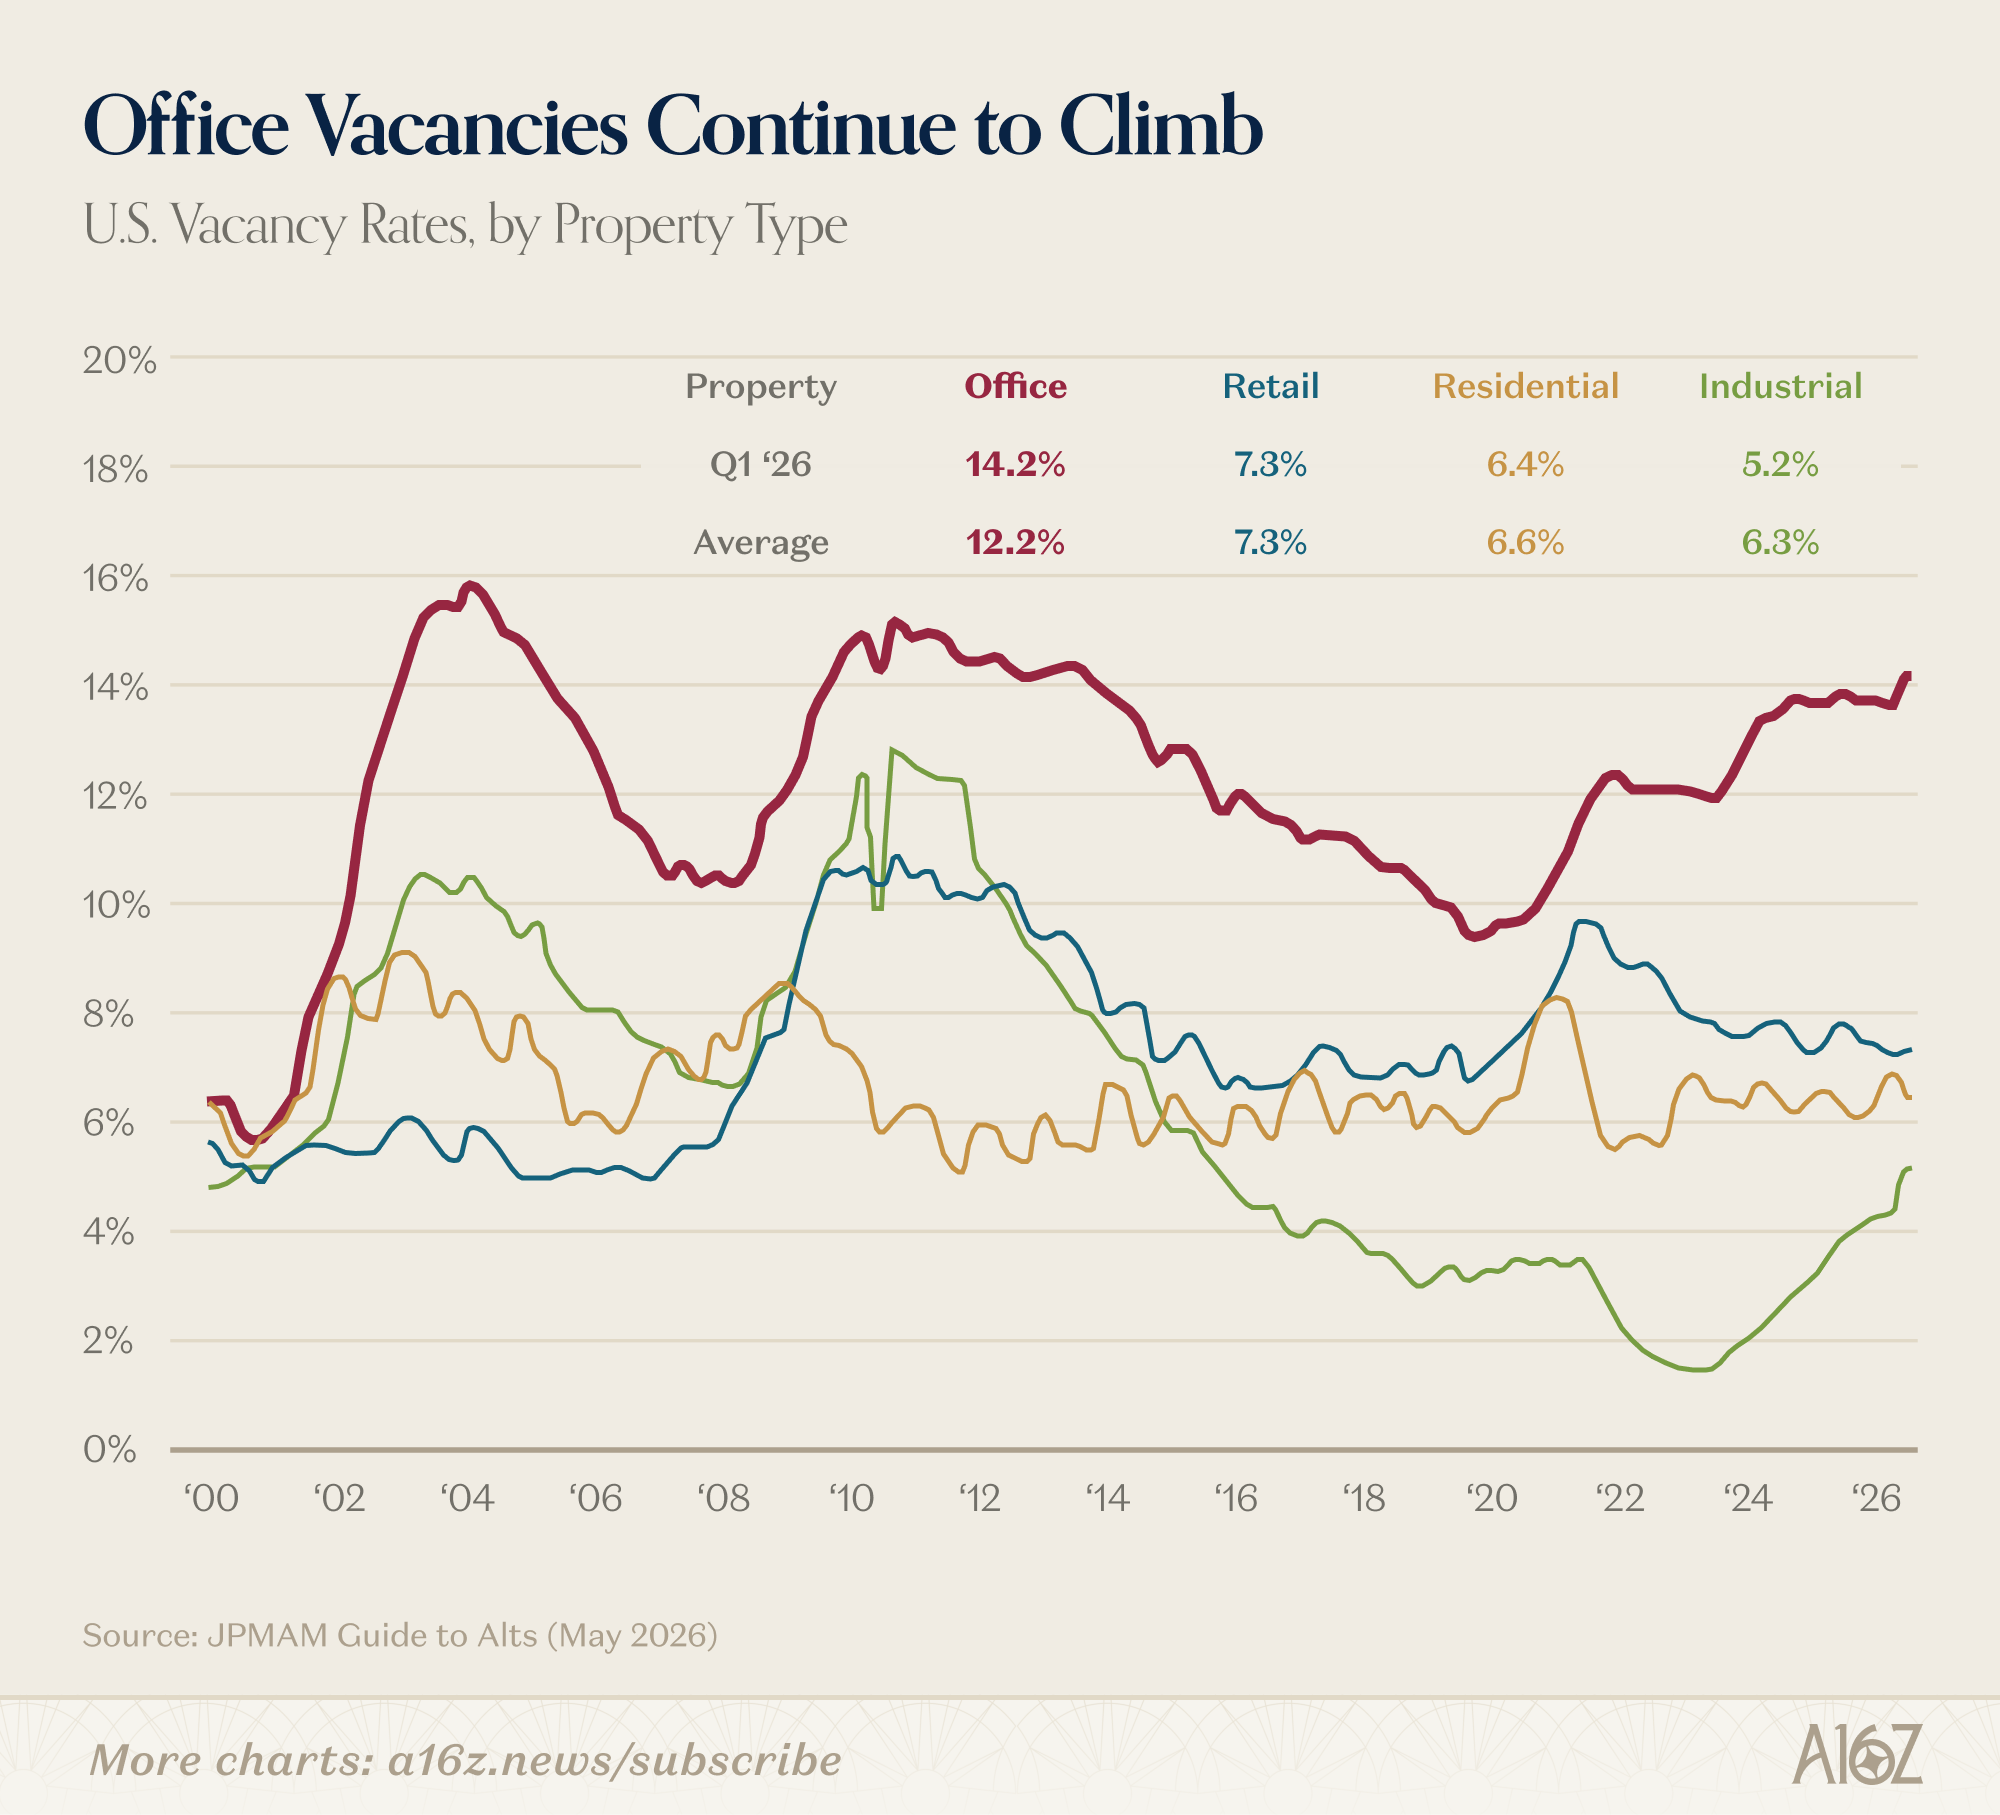
Vacancy rates for office properties are now upwards of 14%, the highest they’ve been since the Global Financial Crisis.
Office vacancy rates also started climbing again, after appearing to plateau for the past couple of years. Why that’s happening is some combination of the stickiness of remote and/or hybrid work arrangements, which aren’t growing, but after resetting at a higher level during the pandemic, aren’t really giving up their gains, either. Plus, nationwide, employee headcount isn’t growing all that much either, which of course creates something of a headwind for net-new office leasing.
The net result of plenty of vacancy and soft-ish demand, is that the market for office space has fragmented into a story of haves- and have-nots. More specifically, newer office space is doing just fine, but for the older stuff, not so much:
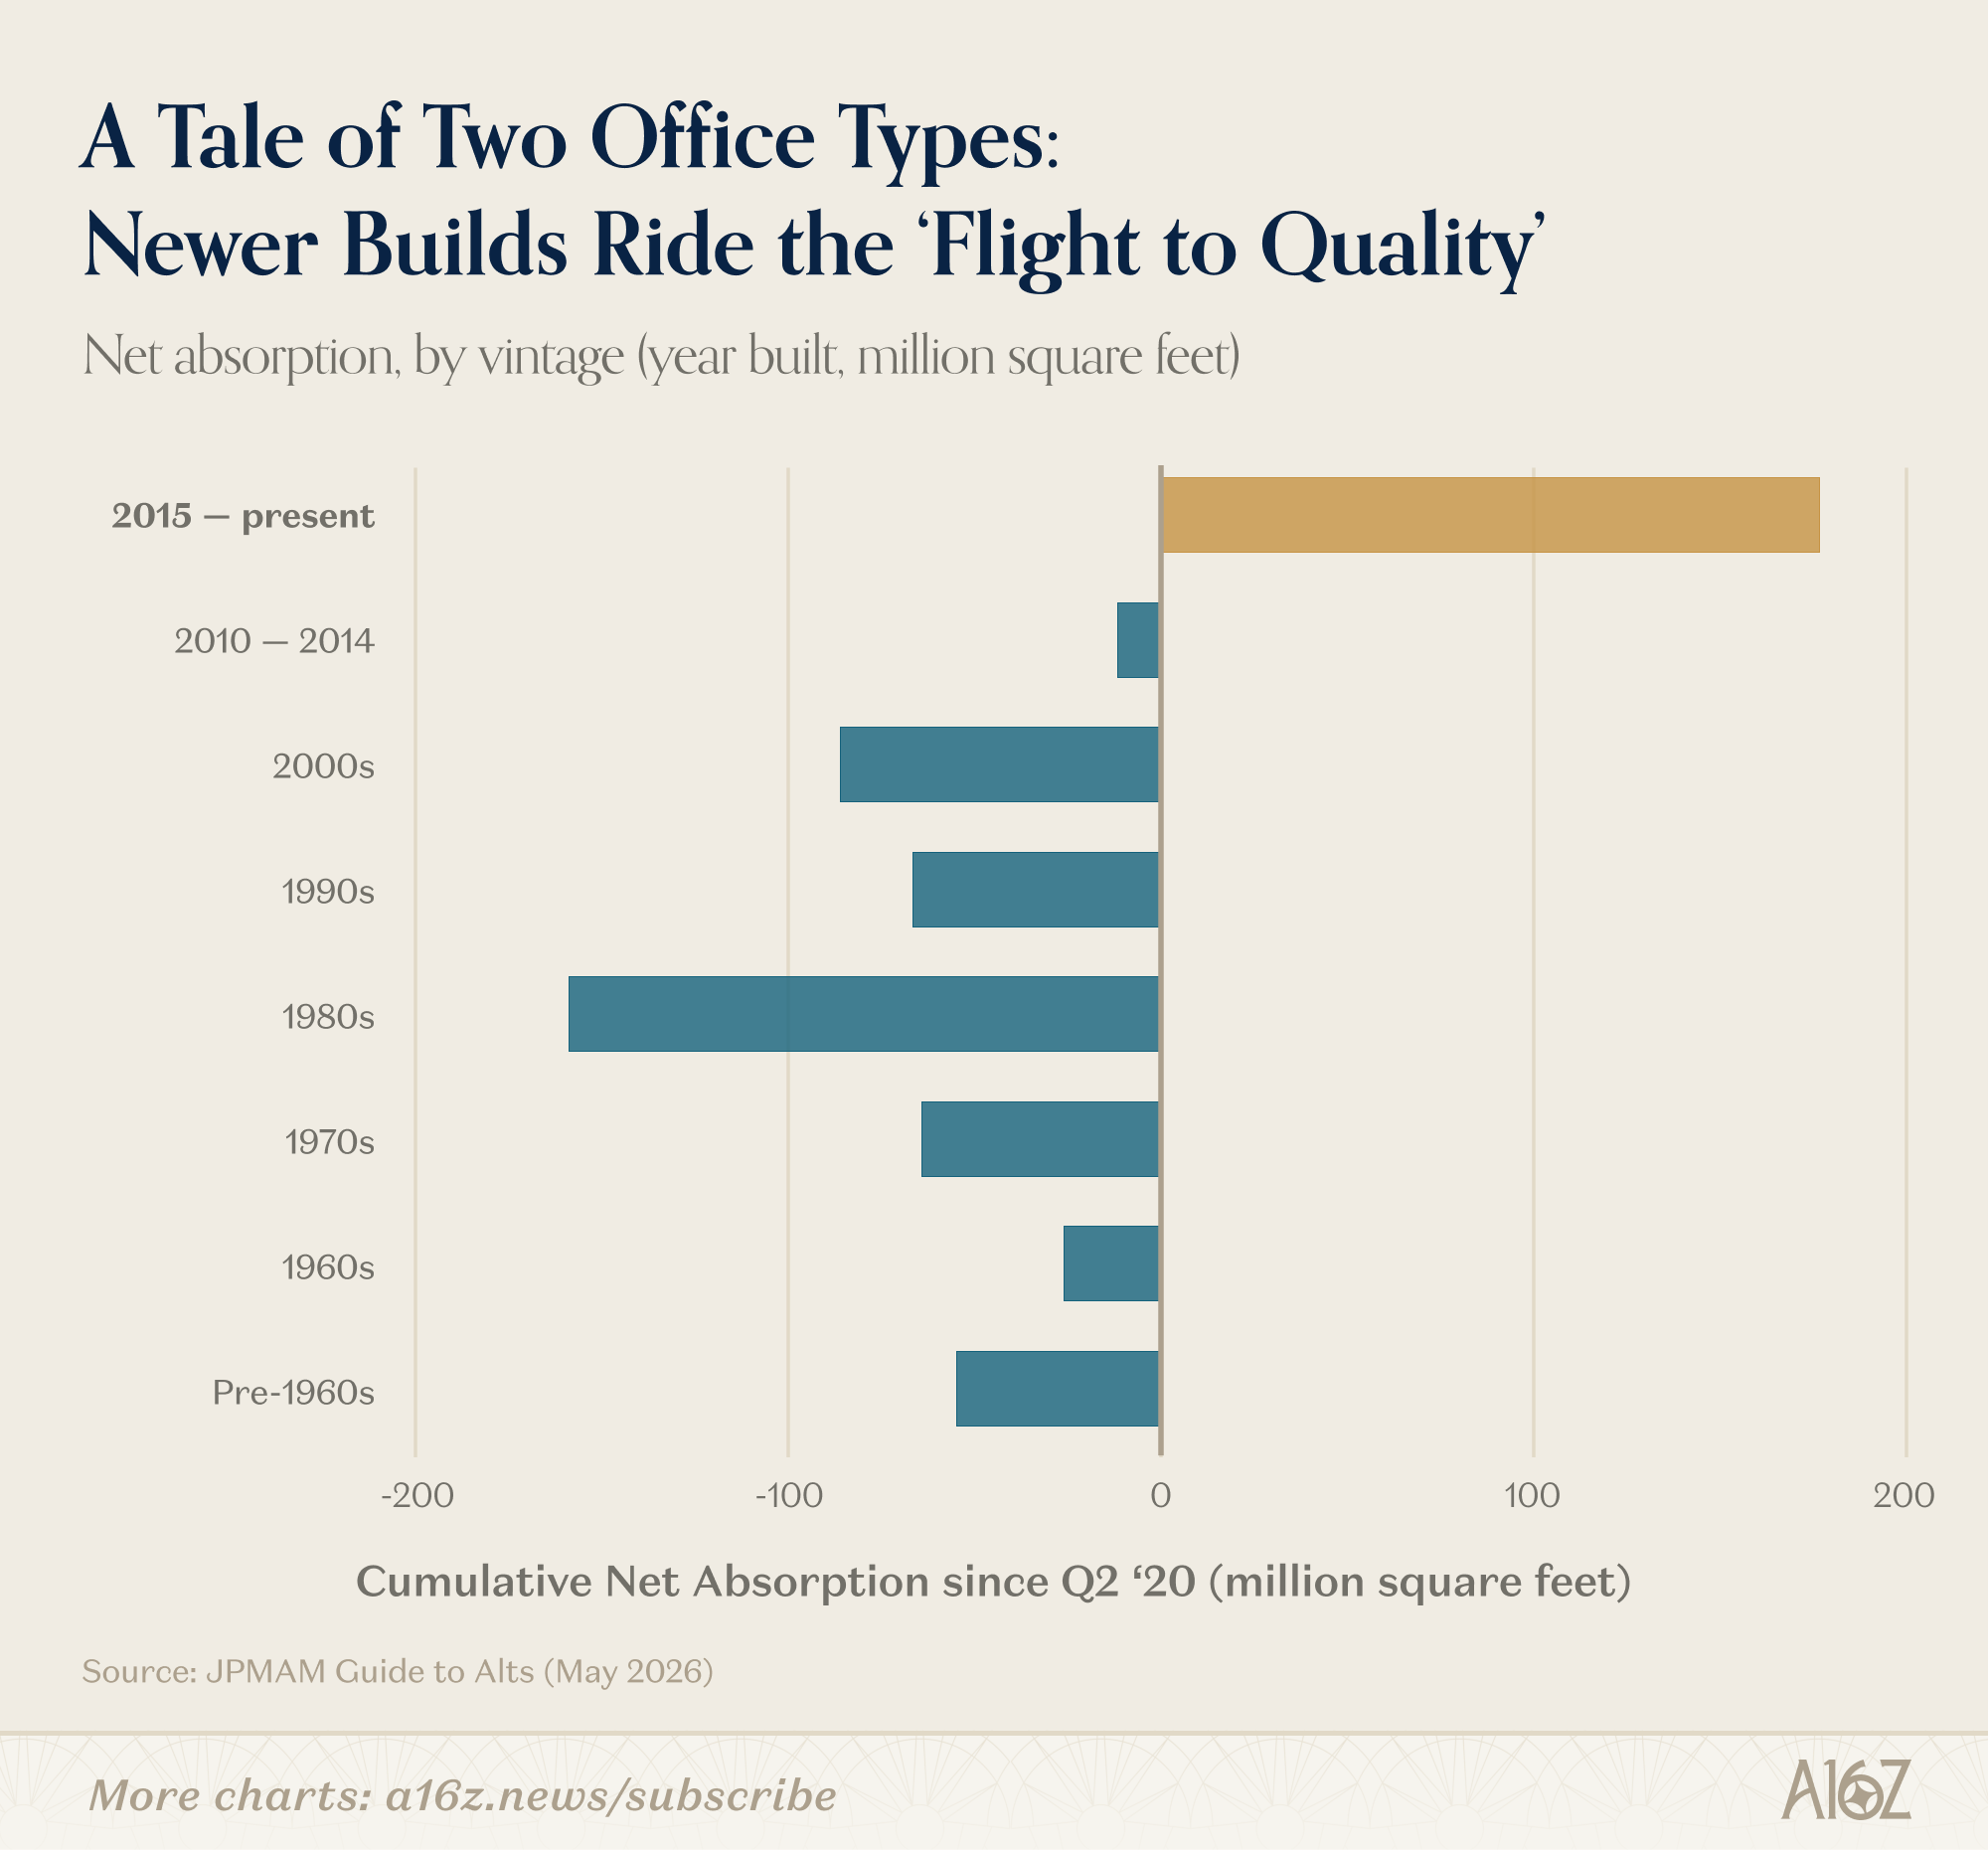
For any office space built in the last decade, net-absorption (i.e. newly leased - vacated space) is dramatically positive. For anything older than that, the picture is relatively grim: more office space has been vacated than leased.
In other words, office tenants are flocking to the best new assets, and leaving the older stuff behind. On the other hand, if you’re looking for a bargain on office space, and you like those pre-2015 vibes, well, you’re in luck.
AI Remote Work Took My Job?
Staying on the subject of remote work, there’s been a flurry of recent research blaming remote work (as opposed to AI) for the trials and travails of youthful employment.
It’s well-established at this point that the employment prospects for younger folks have worsened more so than for everyone else:
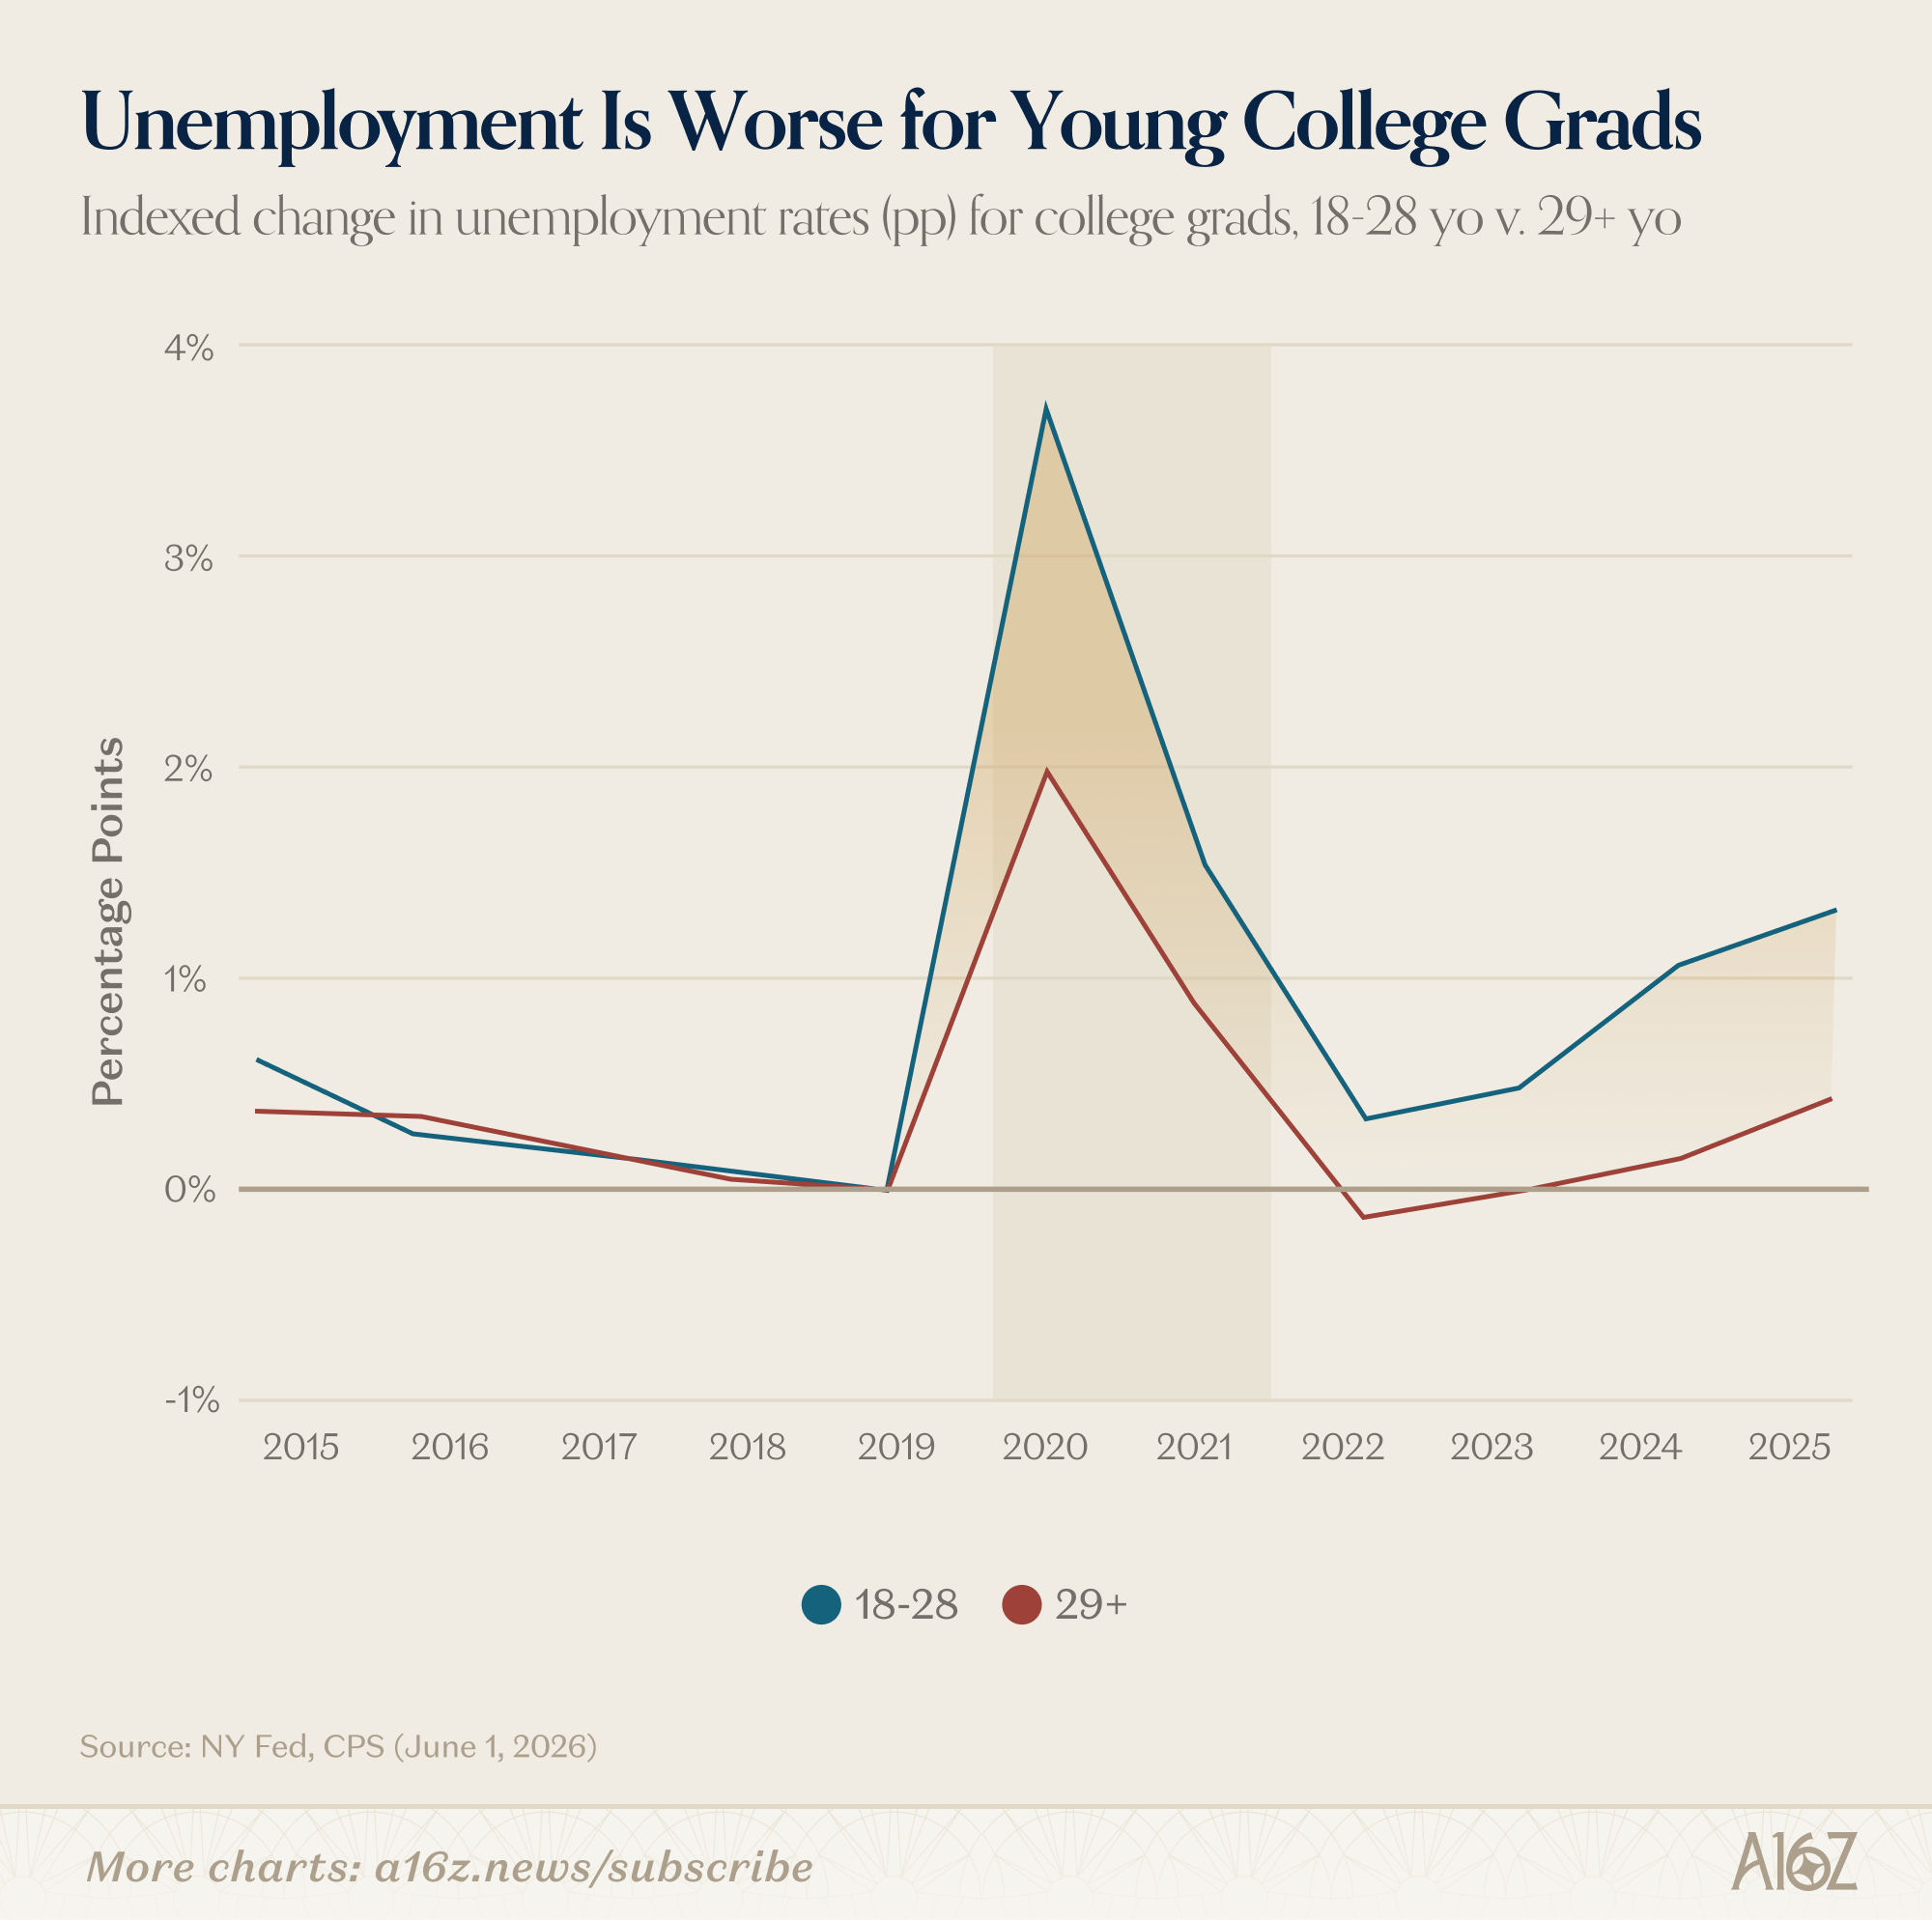
The increase in unemployment for 18-28yos has been running ~1 full pp ahead of the 29yo+ crowd for over a year (but really, the gap opened slightly before the pandemic began).
Many people have tried to attribute that junior hiring malaise to AI (although the evidence for that claim is slim-to-none), but more recently, researchers have posited a different culprit: remote work.
For example, researchers at the NY Fed have shown that the “unemployment gap” (between young and older college grads) is higher for “remotable occupations”:
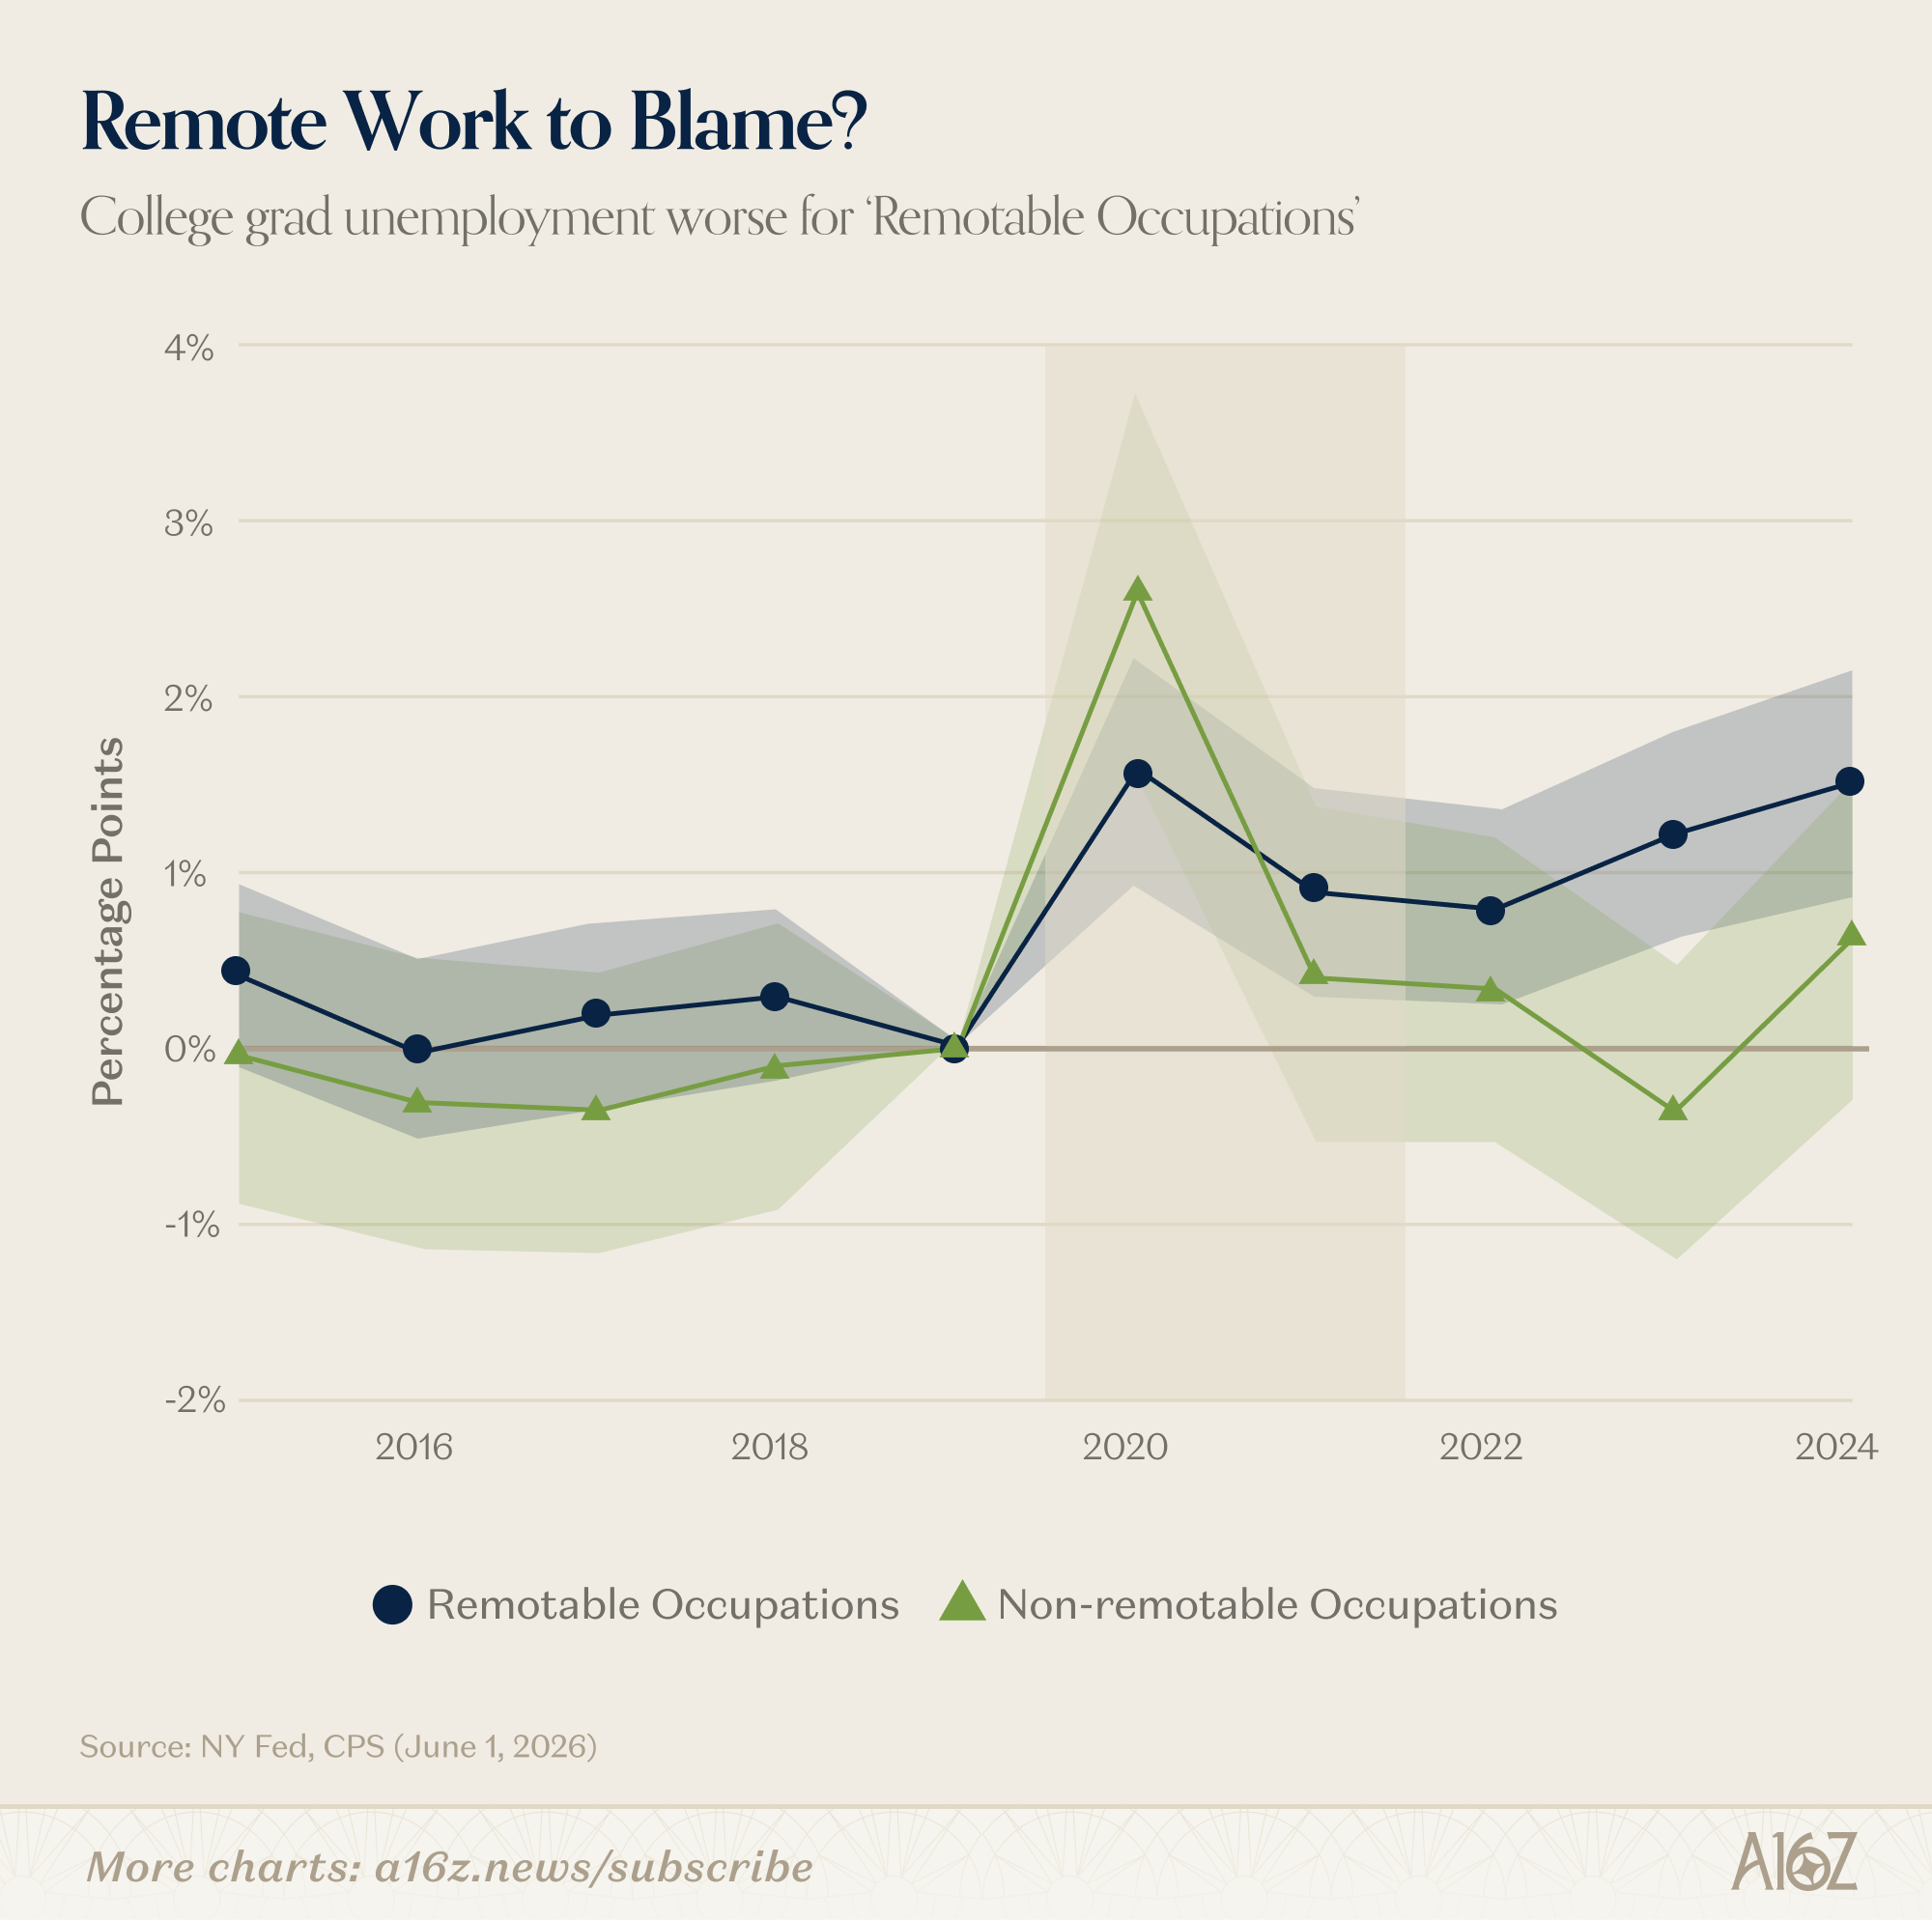
According to the researchers:
The aggregate increase in the unemployment rate for young college graduates can be traced to remotable occupations, where young people’s unemployment rate increased by almost 1 percentage point between 2017-19 and 2022-24.
By contrast, the unemployment rate of older workers in remotable sectors marginally declined over that period. As a result, the age gap in unemployment between younger and older workers significantly increased in remotable occupations.
With respect to AI, again, the researchers aren’t buying it:
[T]he uptick in youth unemployment rates predates the rapid diffusion of AI. Moreover, even when we hold occupations’ exposure to AI constant, we find that the differences between younger and older workers persist in both remotable and non-remotable jobs.
Not only did the youthful unemployment trend predate AI, but the gap persists regardless of “AI Exposure.” It’s of course still possible that AI has something to do with it, but it’s much harder to make that claim when the trend began before AI, and the relative exposure to AI makes no difference to the youthful hiring doldrums.
Another recent paper offers a similar conclusion: if you want to blame anything for the shrinking employment on-ramp, blame WFH:
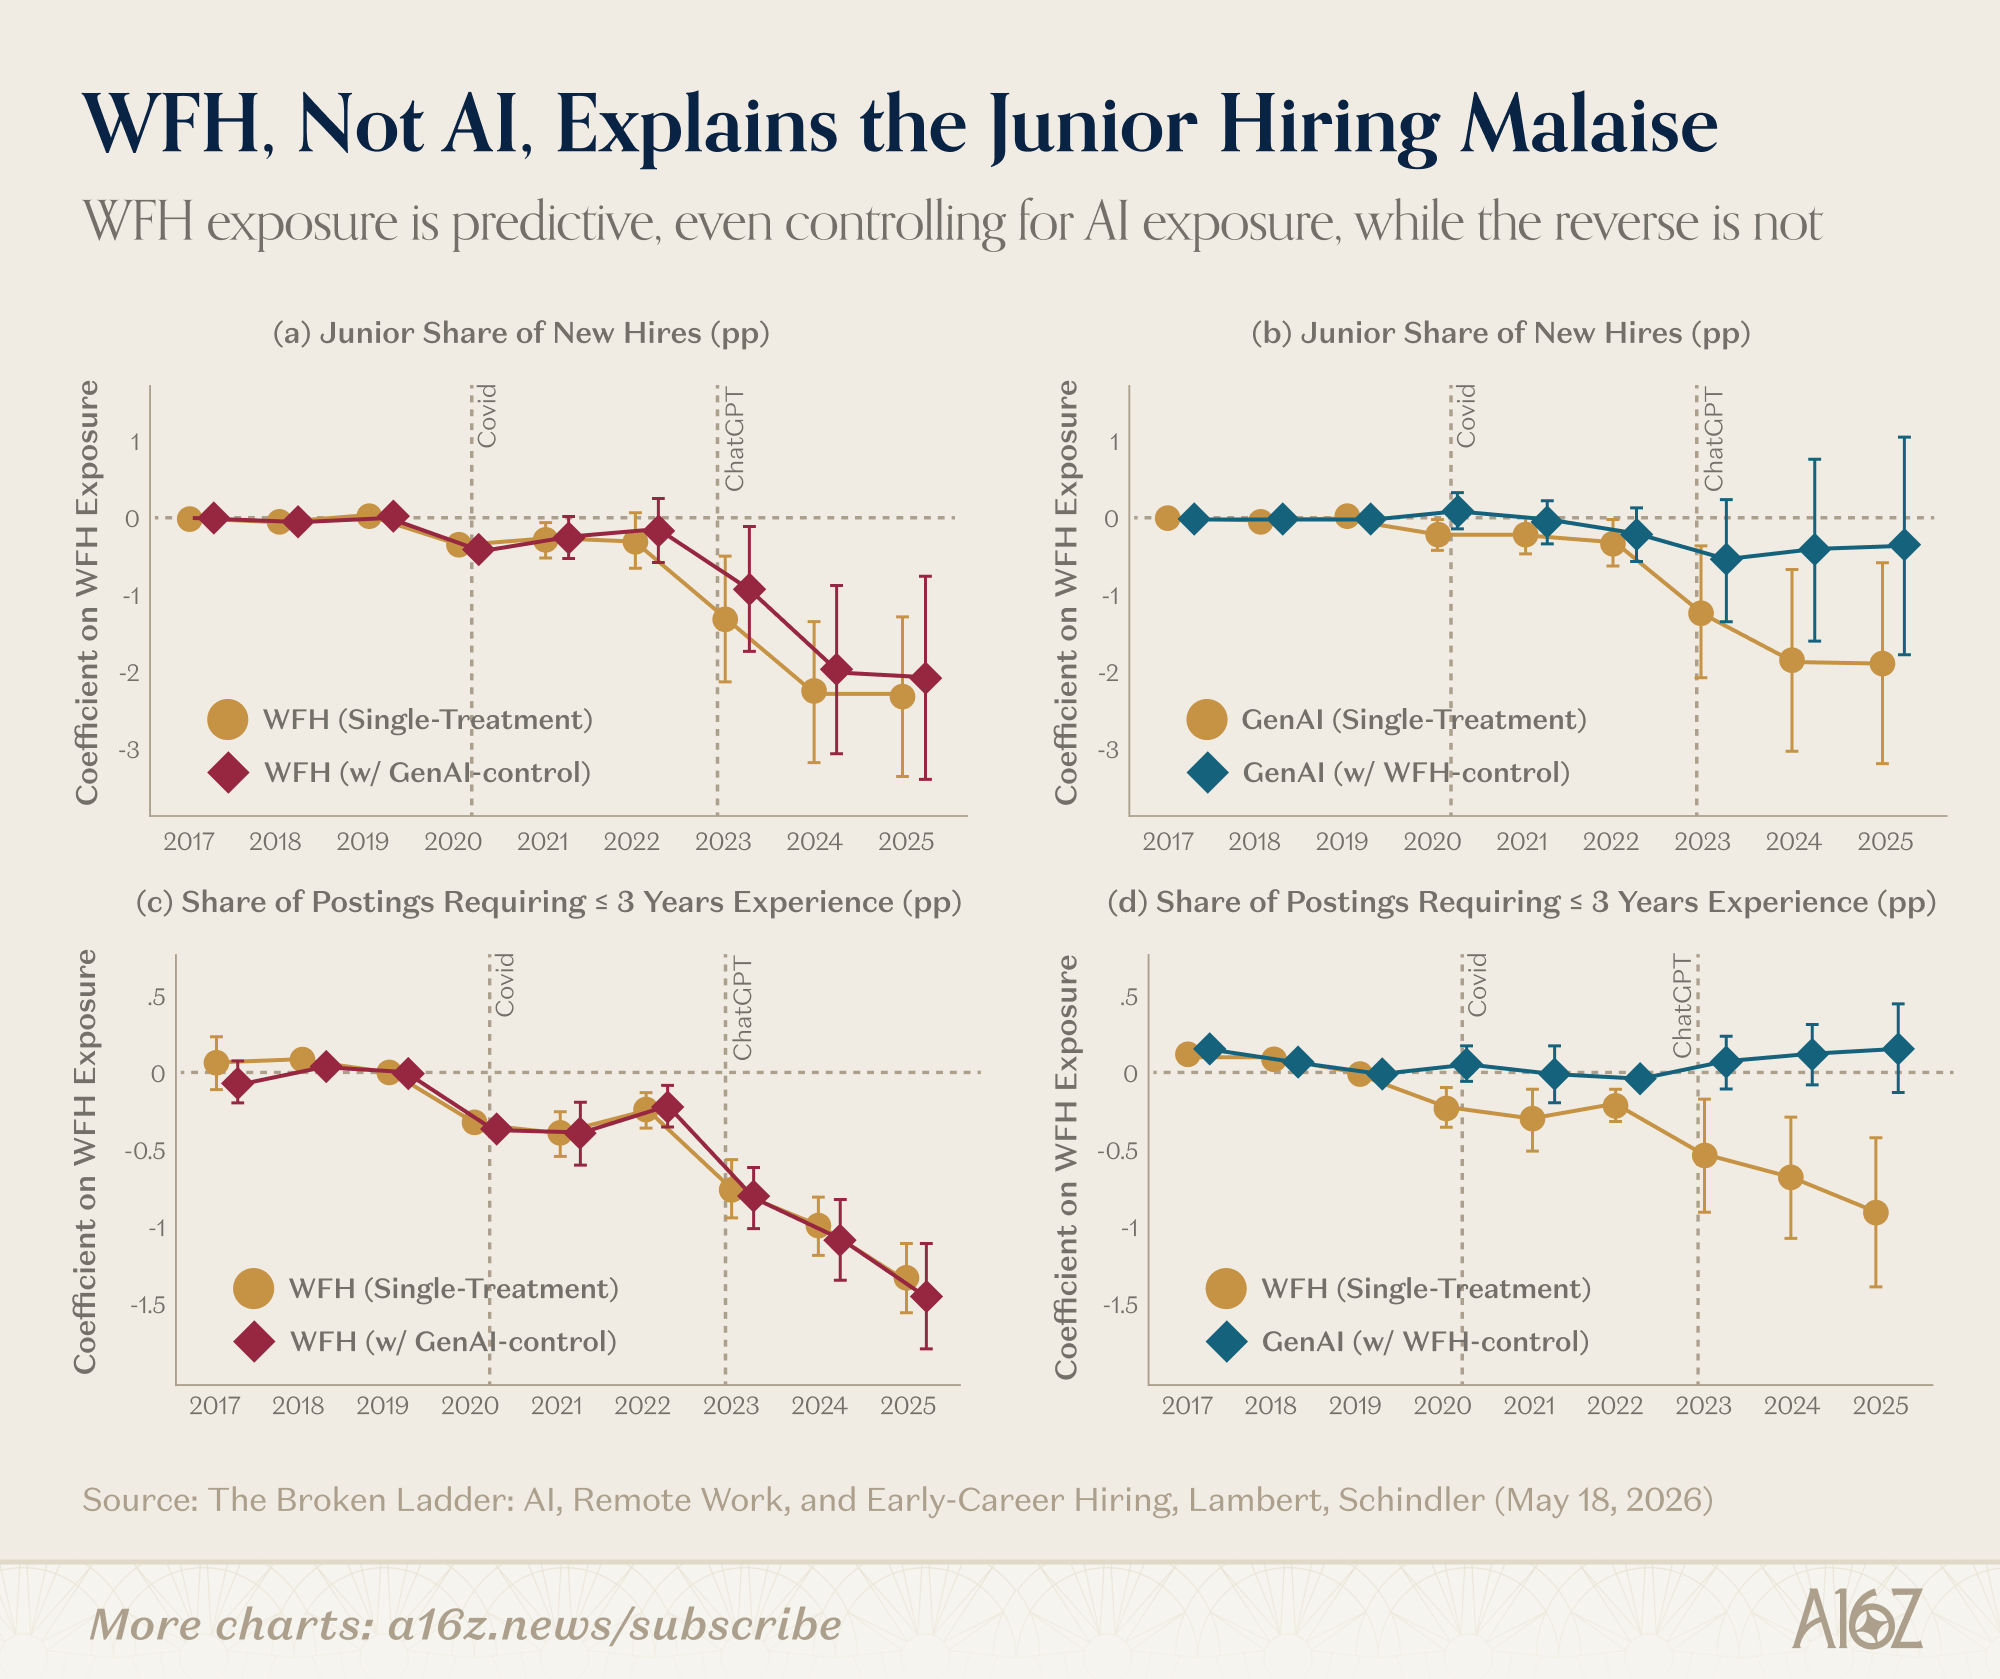
WFH is predictive of a declining share of junior hiring (and “low-experience” job posting), even when controlling for AI. At the same time, all the predictive power of AI-exposure goes away, once you control for WFH.
Put it all together, and there’s at least some evidence that when firms have the ability to hire remotely, they tend to favor experienced workers, at the expense of junior hires. That, rather than “AI substitution,” is a better explanation why the employment on-ramp appears to be a “broken ladder” (according to the research).
To be fair, there is a lot of overlap between “AI Work” and Remotable work, insofar as they both skew towards White Collar work, which has its own broader cyclical factors in play. While the researchers try to control for that, they’re relying on rough proxies for both the impact of AI and remoteability, so take that for what you will.
One thing, however, that is abundantly clear is that the workforce is most definitely getting older, and that people are staying in their jobs, longer than before:
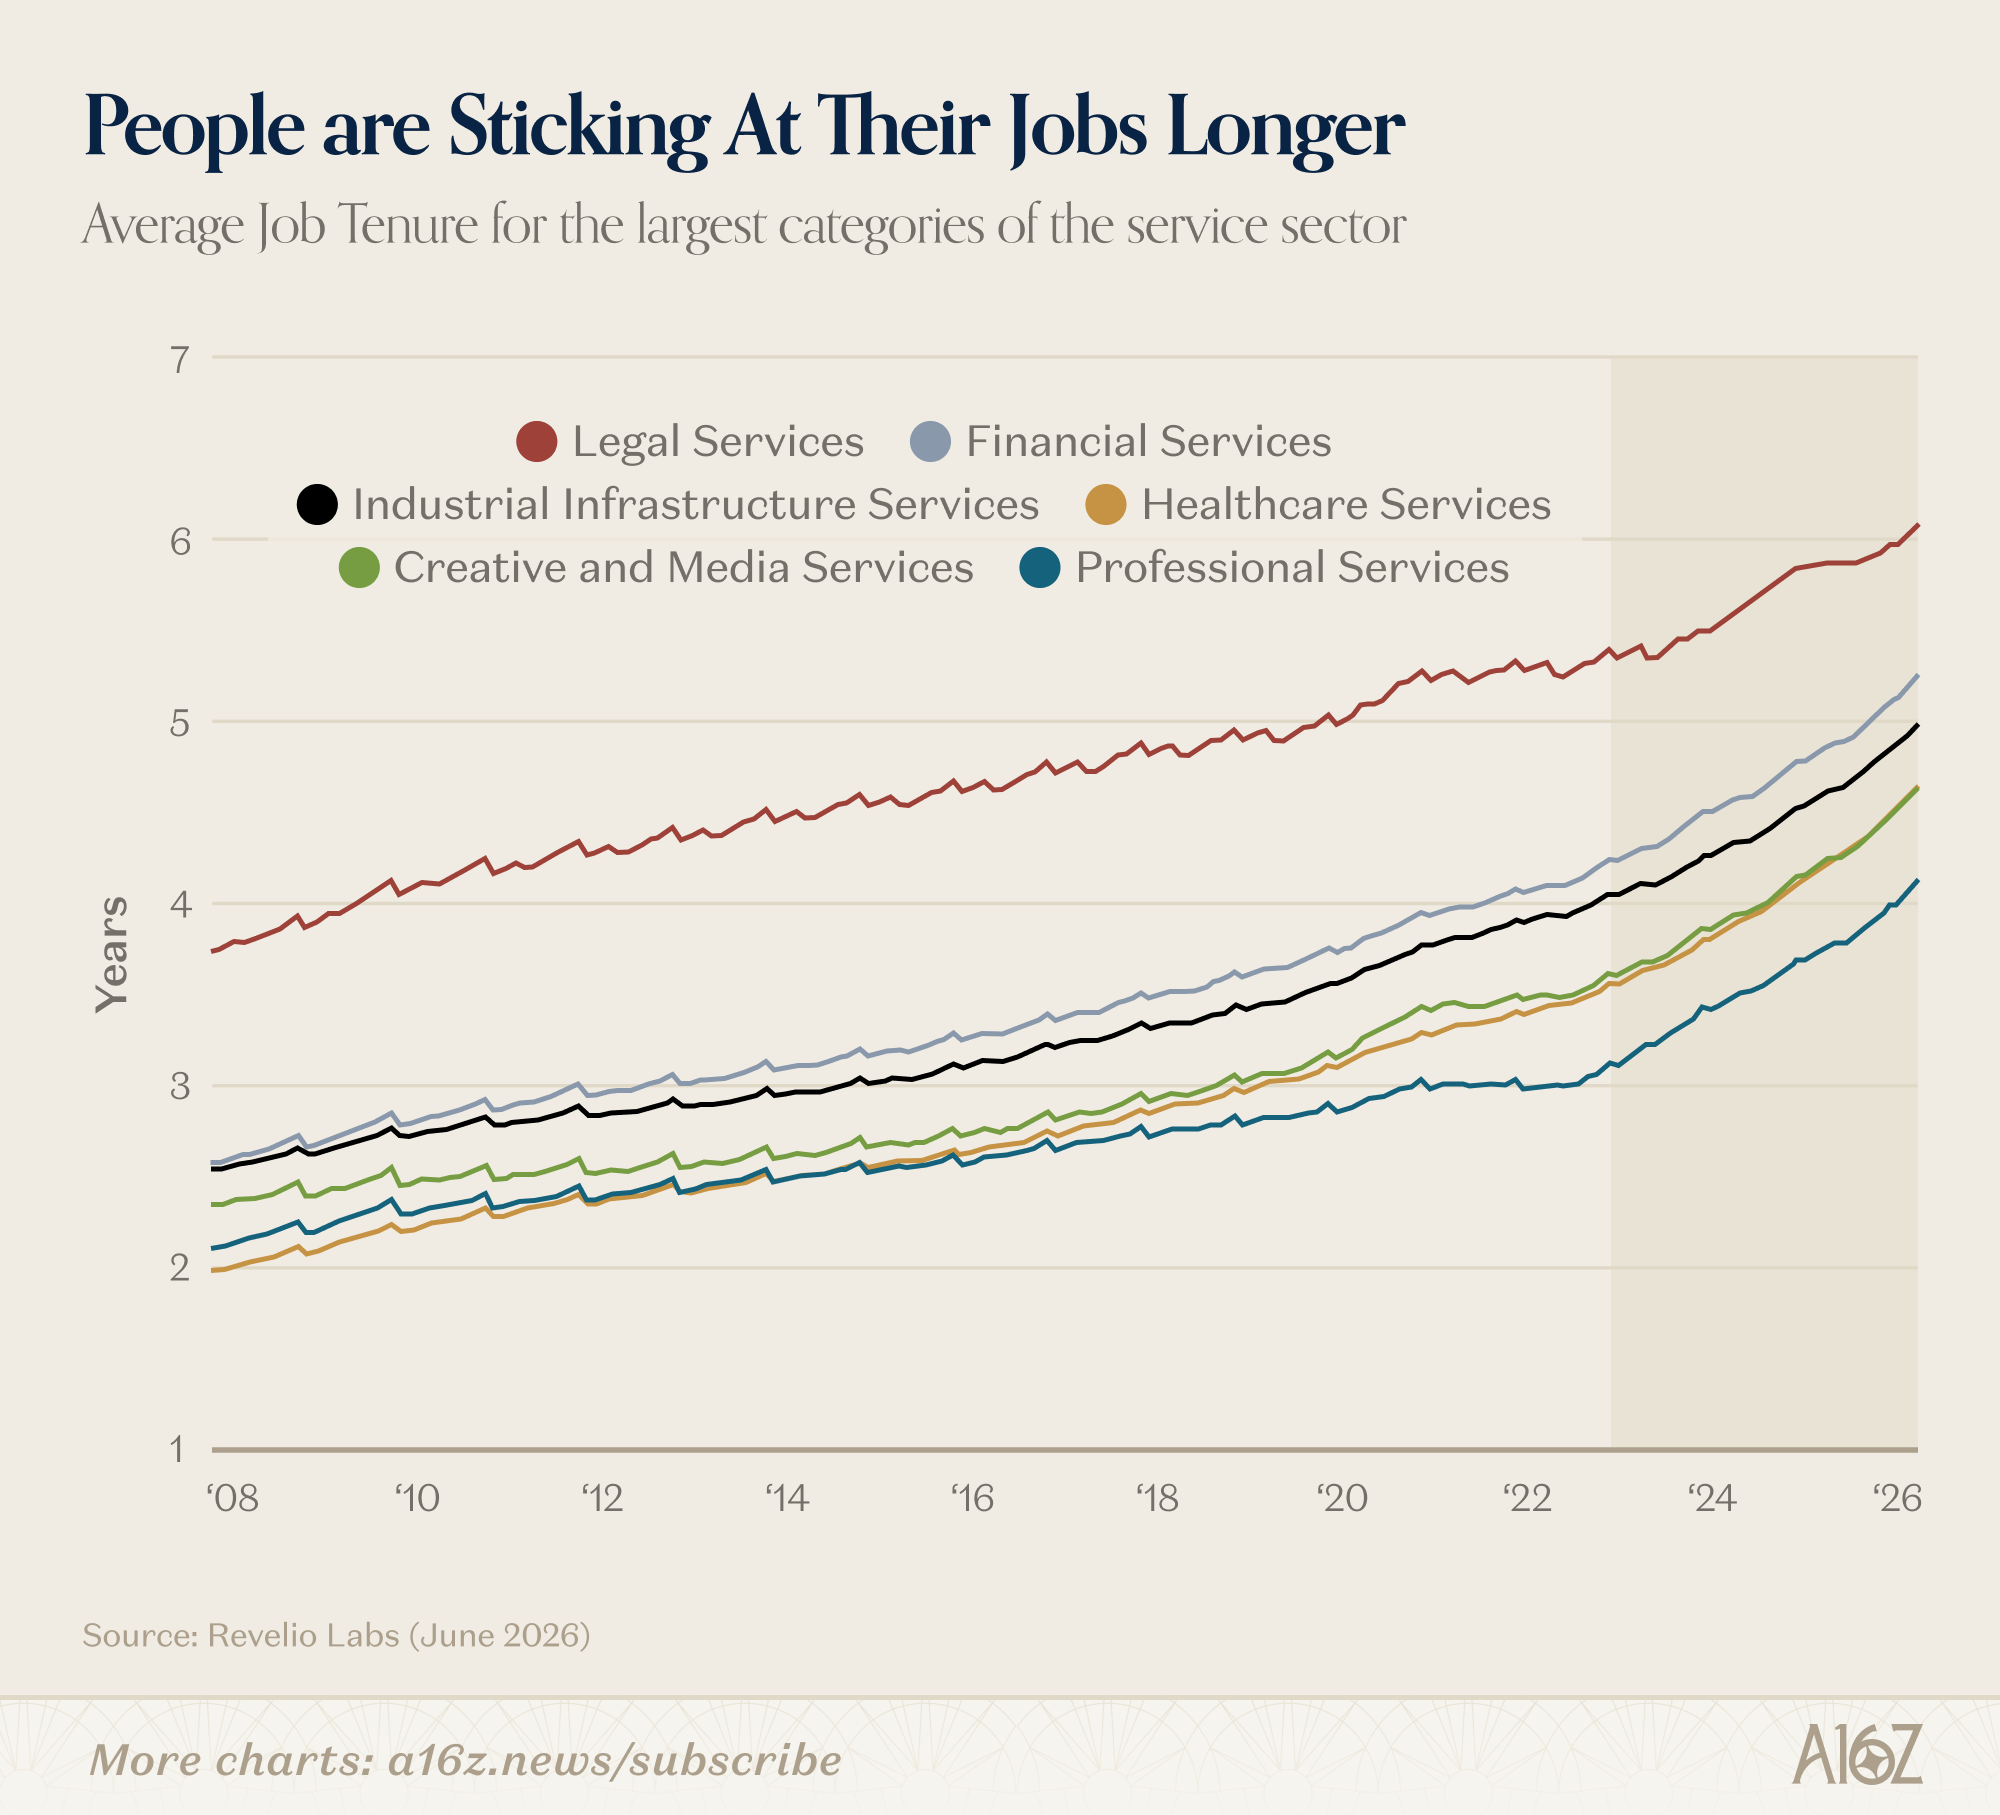
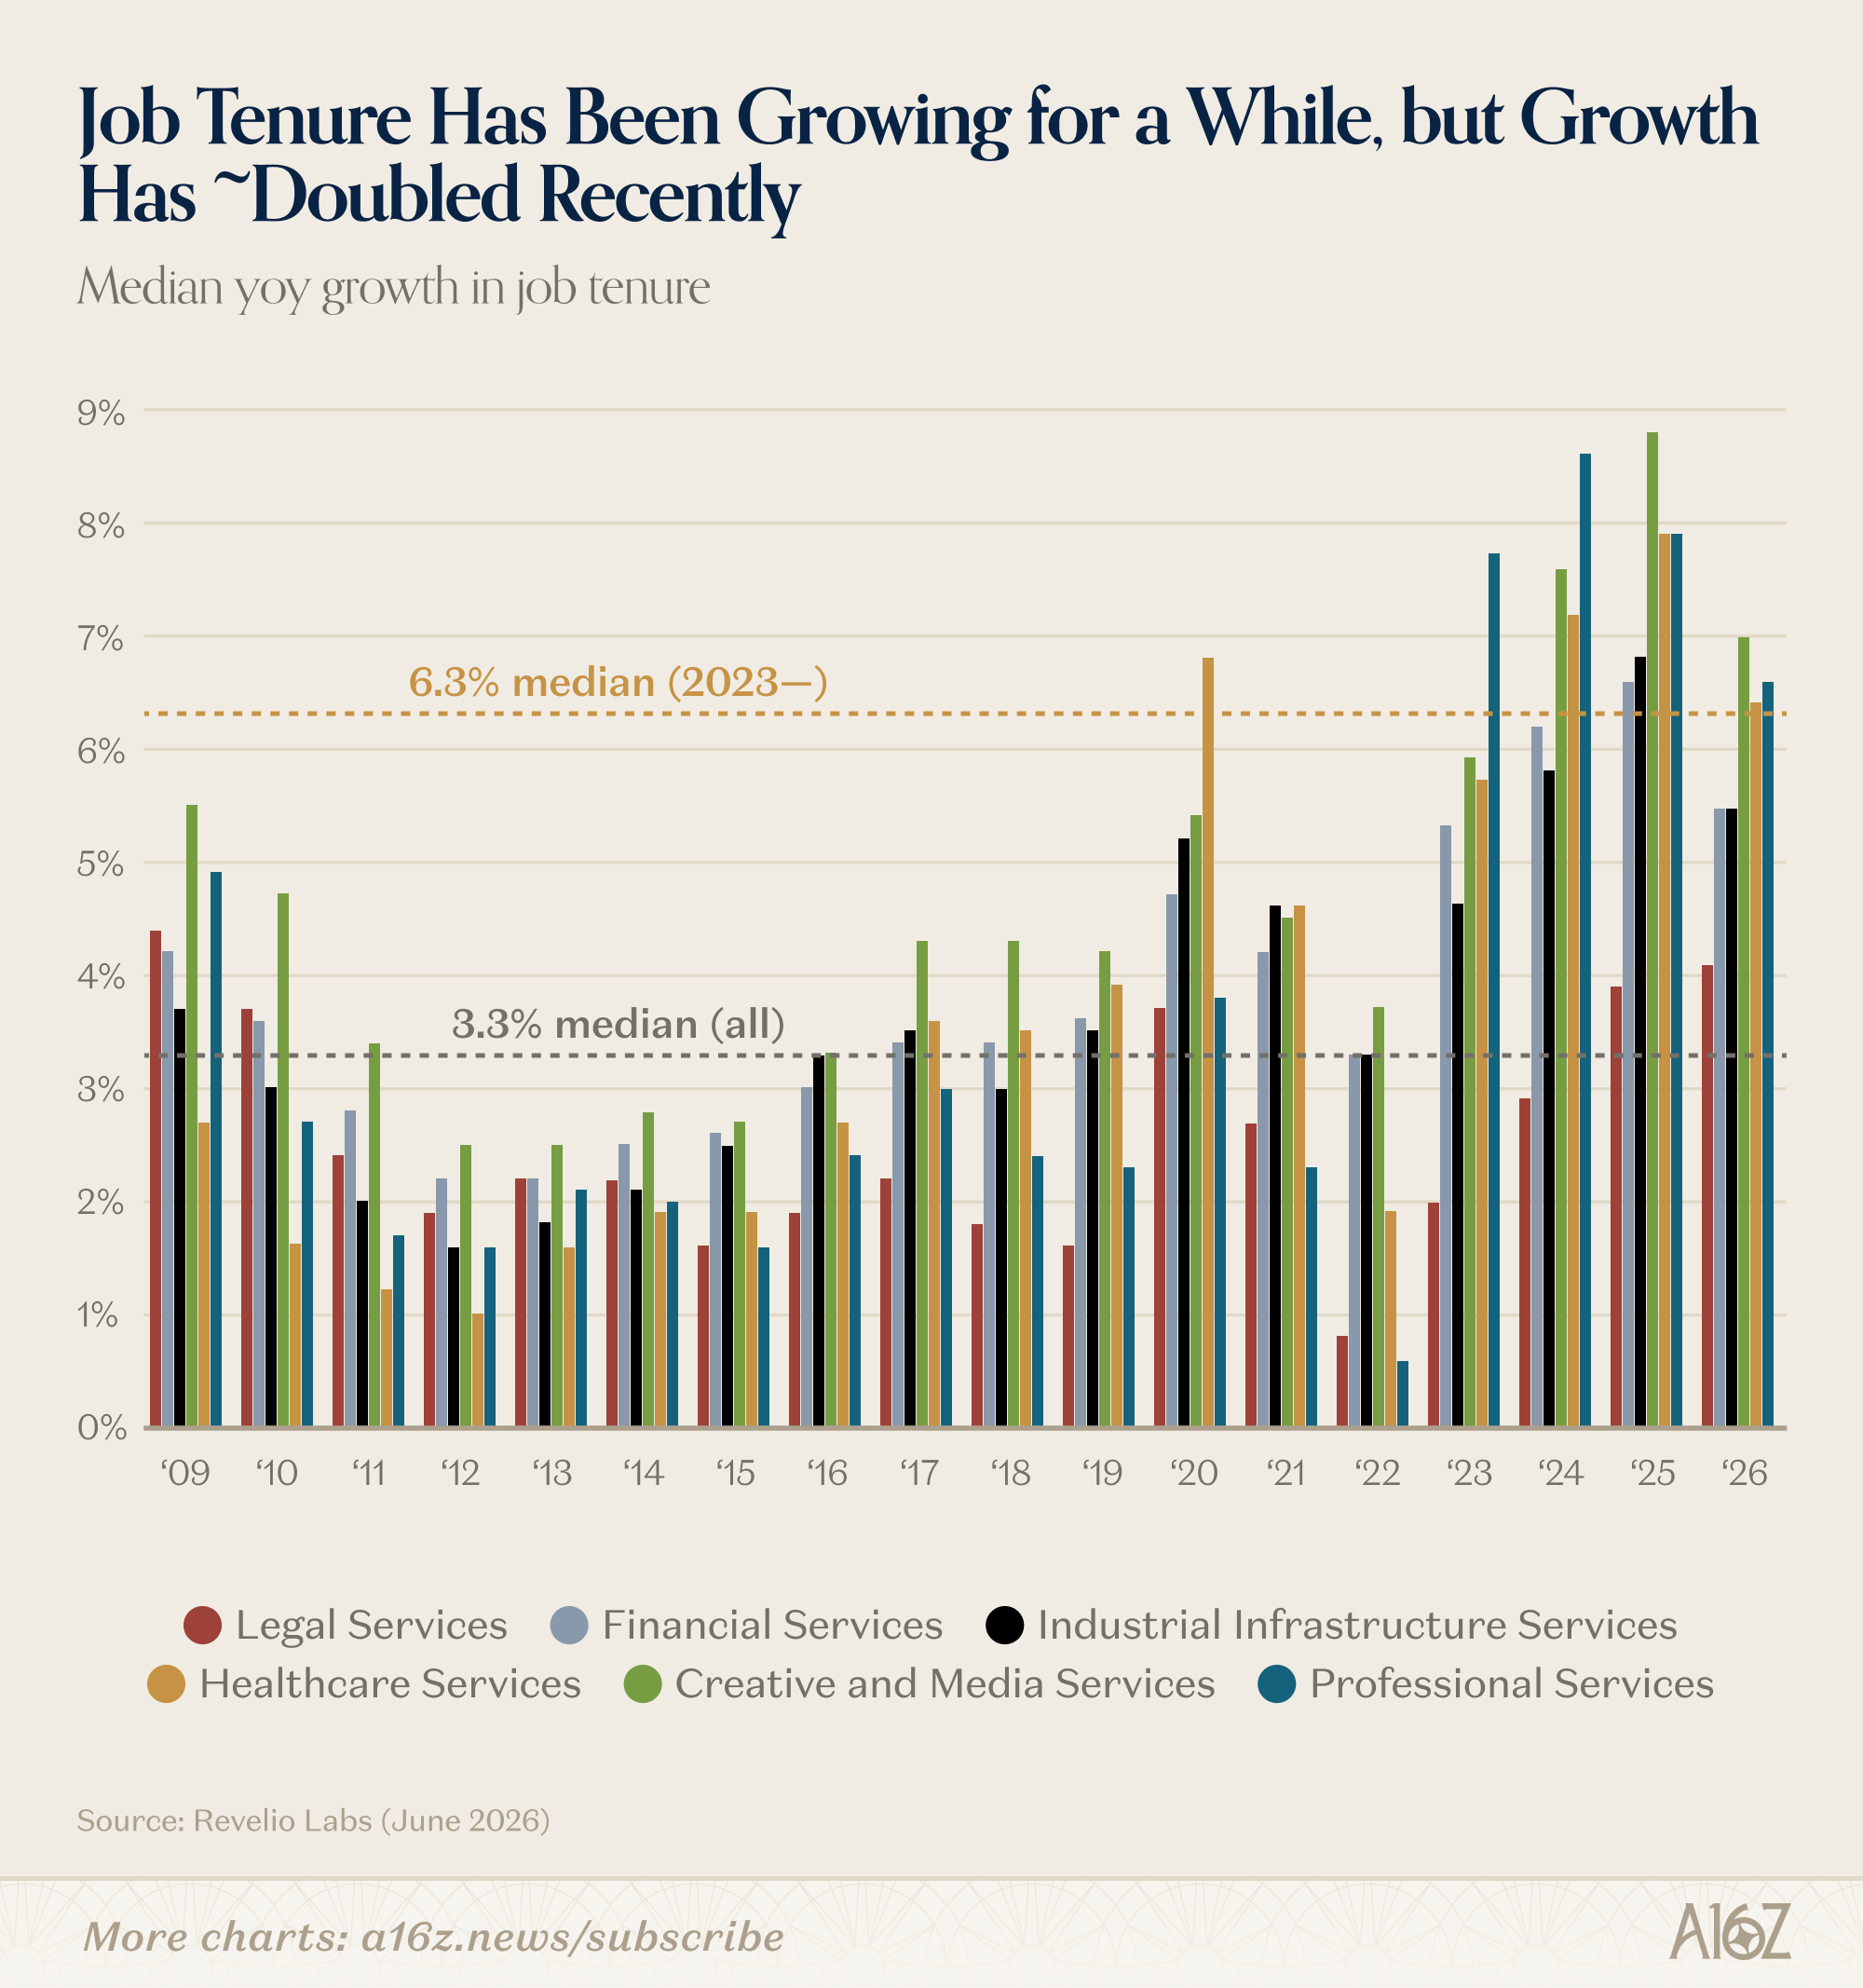
Average tenure for the major service industries has been growing for some time, but since 2023, the growth rate has ~doubled the longer-term average.
Why the off-ramp has gotten longer is itself an open question: perhaps people are working longer because they can, or perhaps there’s more of a premium for expertise (or perhaps the remote option has kept some people in the workforce longer than they otherwise might have).
It’s generally wrong to think of the labor market as a zero-sum game with a fixed amount of seats, such that someone has to get off the ladder, for someone else to get on. That being said, it seems likely that at least some part of the faltering on-ramp is explained by the lengthening off-ramp. As folks work at their jobs longer, there’s perhaps less pressure to find reinforcements.


AI SMB Power Users
We’ve flagged before the upward inflection in new business formation that began during the pandemic, but accelerated again more recently, with the advent of AI.
One curious thing about the new firm formation is that these new firms tended to be “low propensity [to hire]” sorts of businesses that were nonetheless spending an outsized share on technology. In other words, if you thought that AI could spawn a generation of “solopreneurs,” then there was some evidence right there.
The AI-solopreneur thesis may well still be a thing, but some other recent data offers something of a wrinkle. It turns out that among small businesses, employer-firms (both large and small) had substantially higher rates of AI adoption than non-employer firms, according to spending data from JP Morgan Chase:
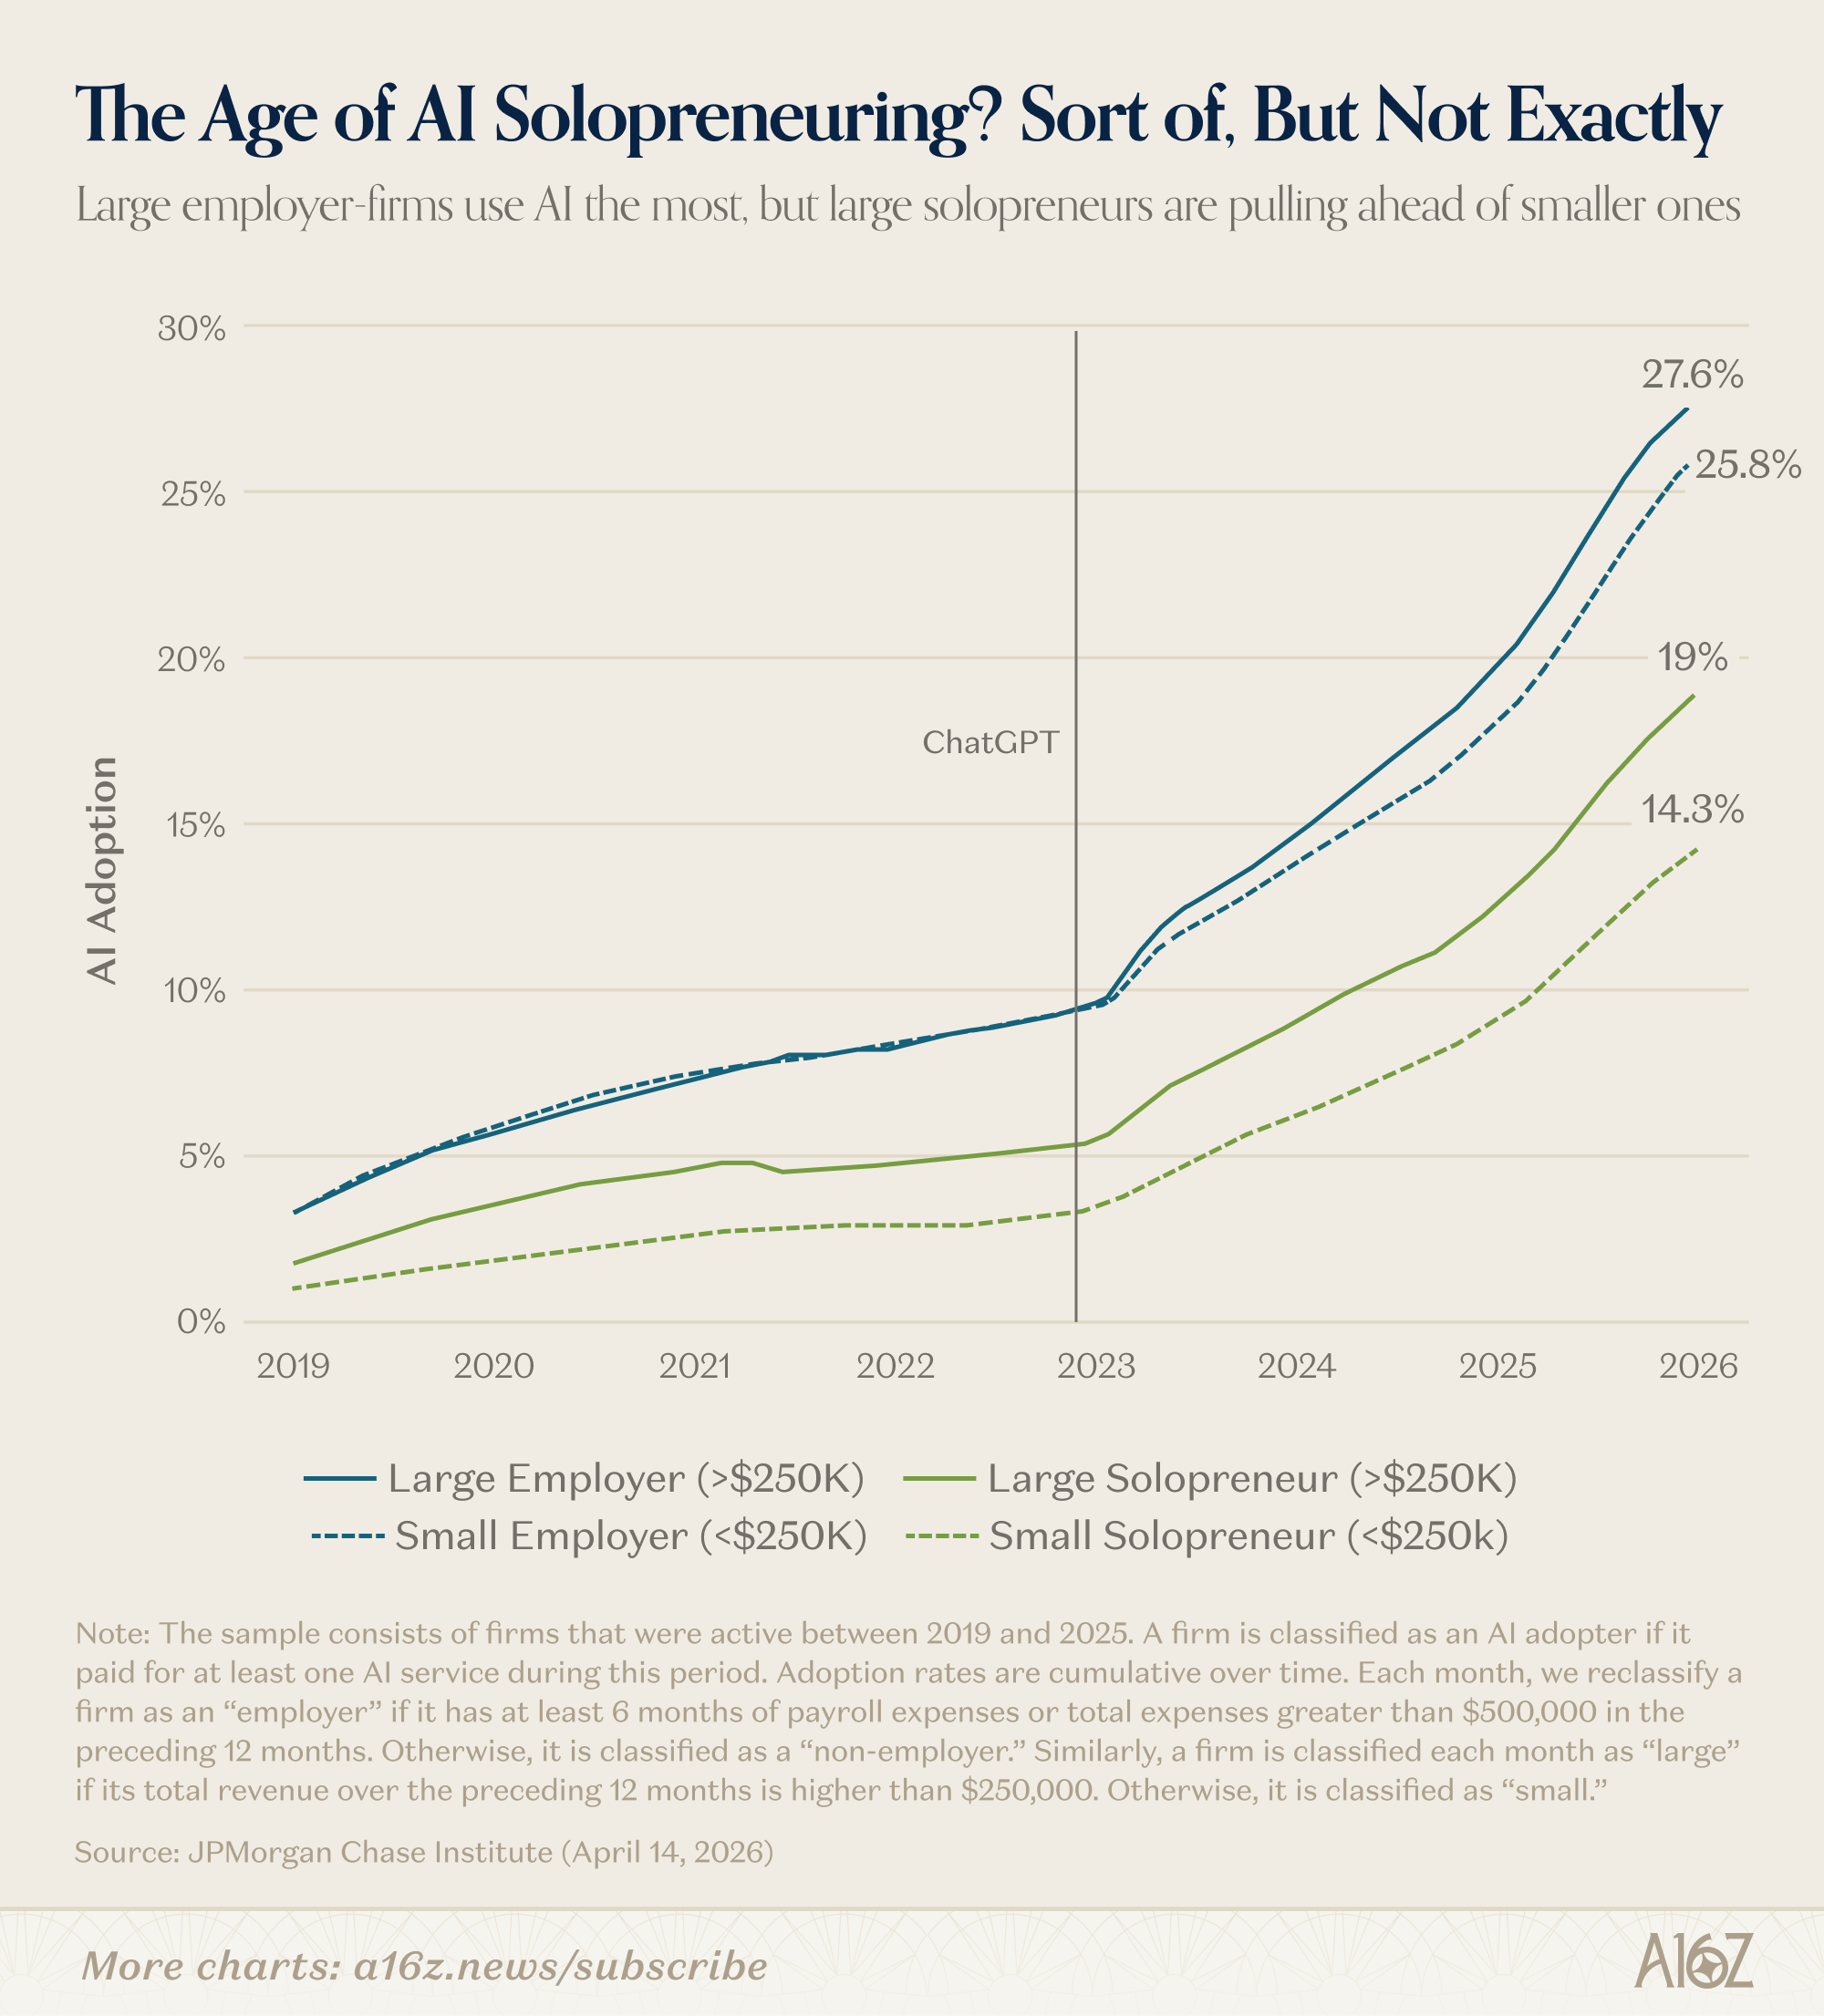
Employer firms showed AI-adoption rates ~26%, while non-employer firms ranged from 14.3% on the small end to 19% on the larger end.
Small businesses with headcount are out-adopting AI than those without is not exactly what the “AI solopreneur” theory would expect to see. Still, the data does support the theory in at least one respect: larger solo businesses are out-adopting smaller ones by a pretty substantial margin, and the gap has widened, of late.
It’s obviously too soon to tell (and one data series is hardly dispositive), but perhaps we’re in the early innings of an “AI solopreneur power user” wave, afterall. Not all one-person businesses are using AI, but the ones with more revenue are more likely to be using AI than the ones with less.
Lil’ Biotech 💪
It used to be that Pharma was primarily responsible for sponsoring clinical trials, but over the last decade or so, emerging biotech companies have taken an increasingly large share of the clinical trial load:
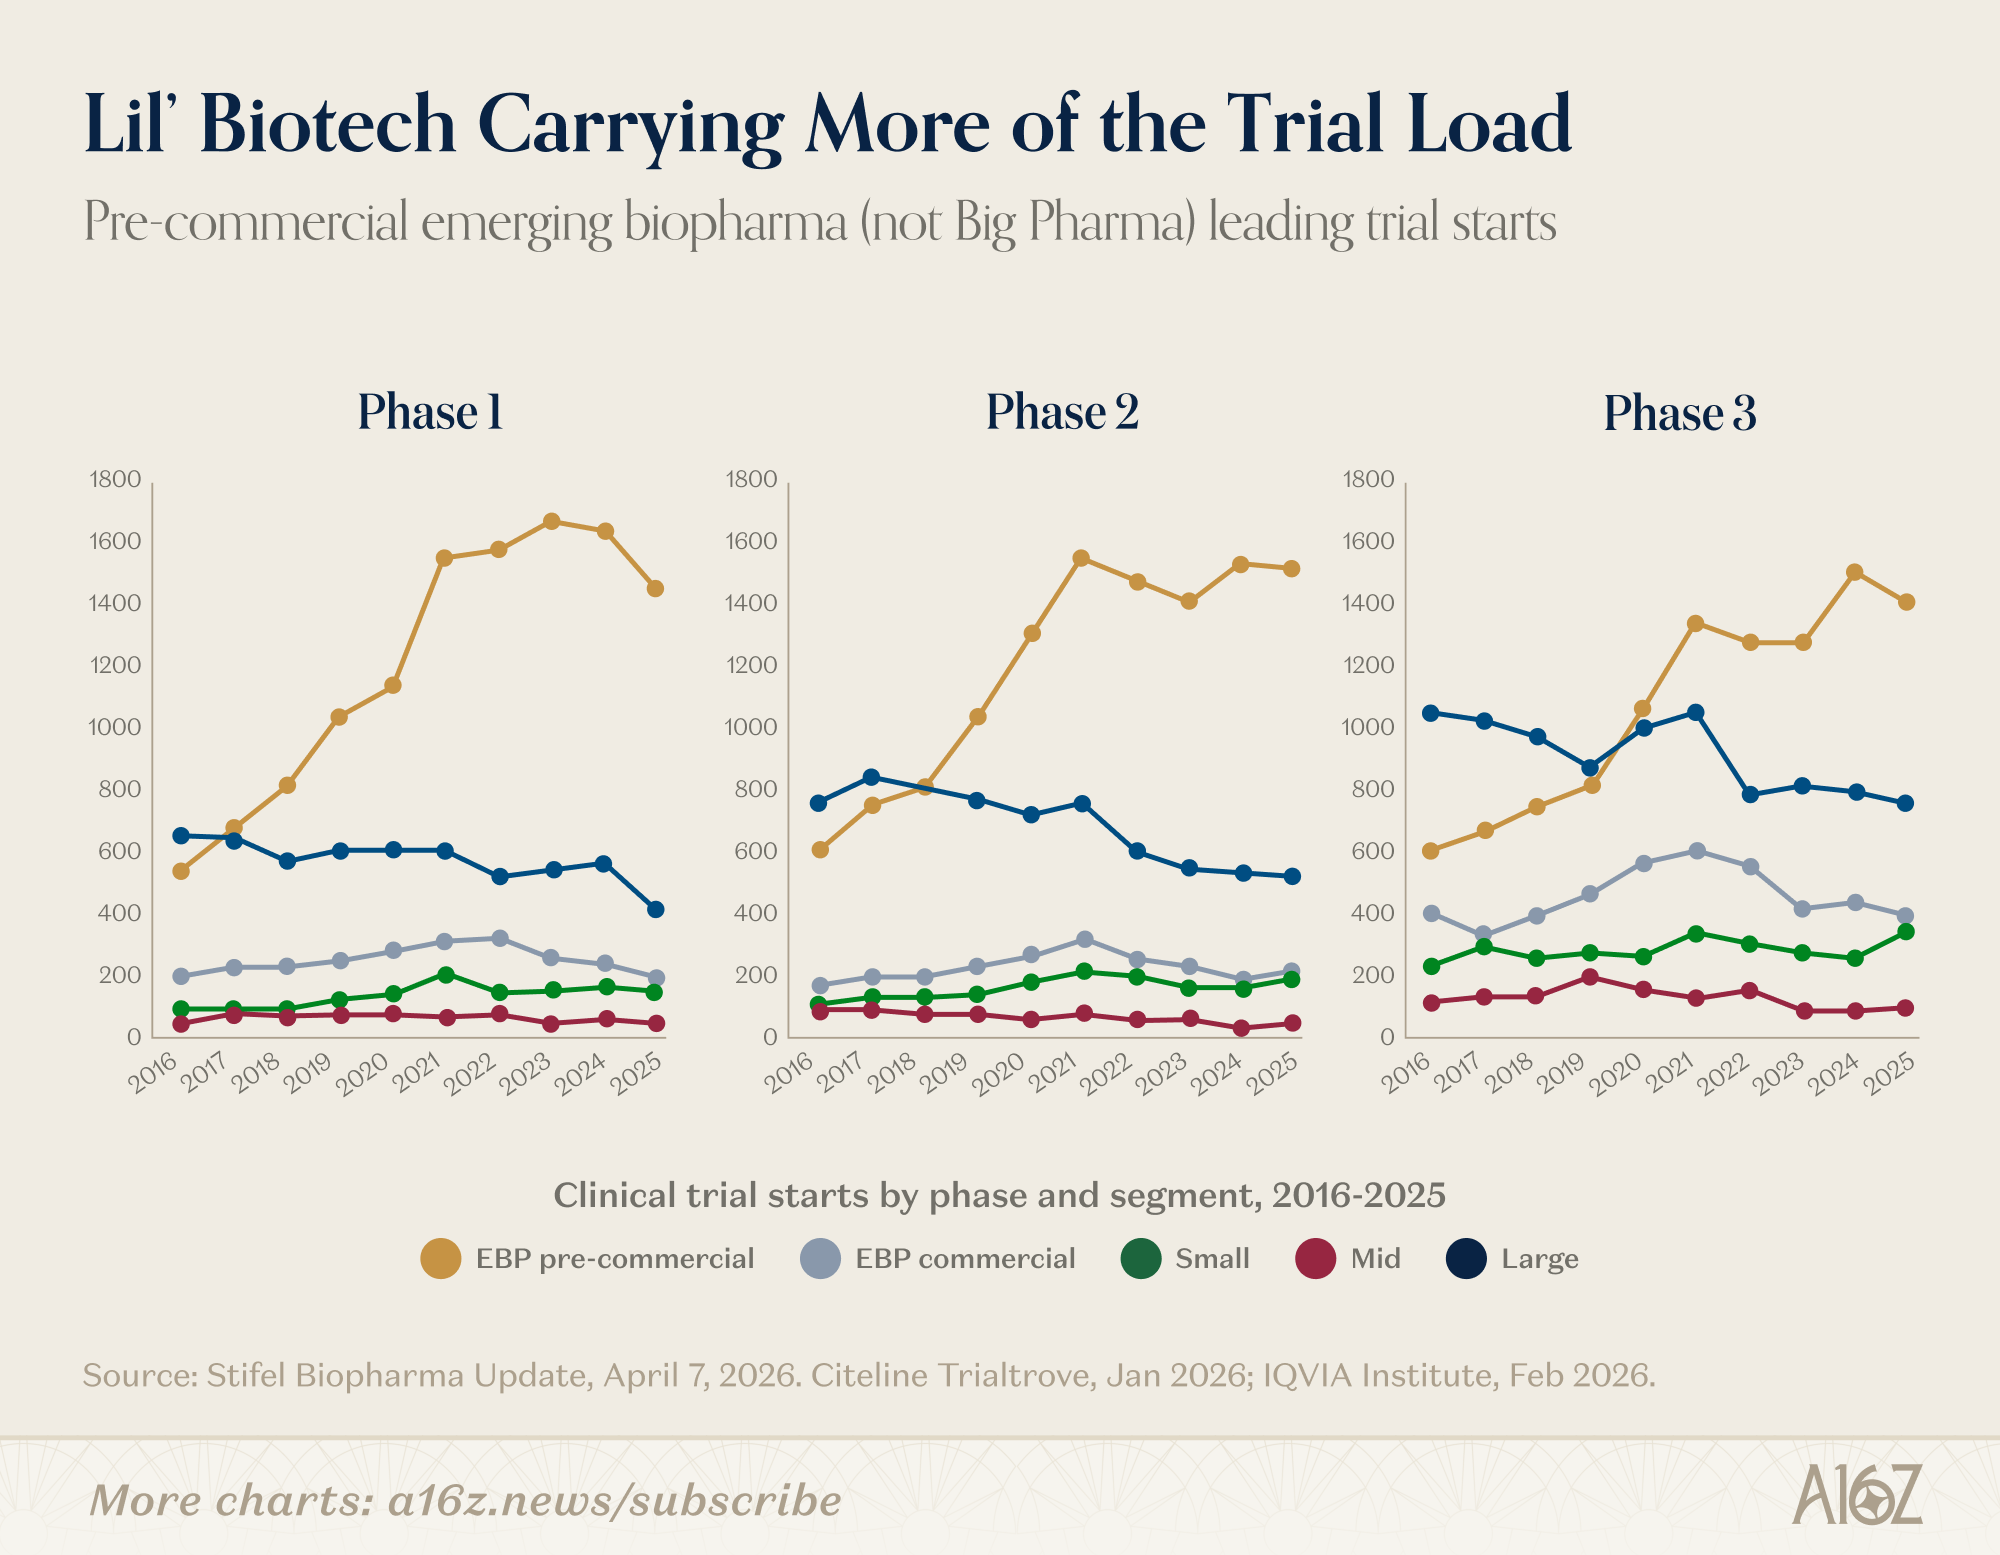
Across all three phases of clinical trials, “pre-commercial” emerging biopharma companies have ramped up their clinical trial starts substantially since 2016.
Given the increase in clinical trial activity, it’s unsurprising that little biotech has driven most of the increase in “novel active substances,” submitted for regulatory approval over the past few years, as well:
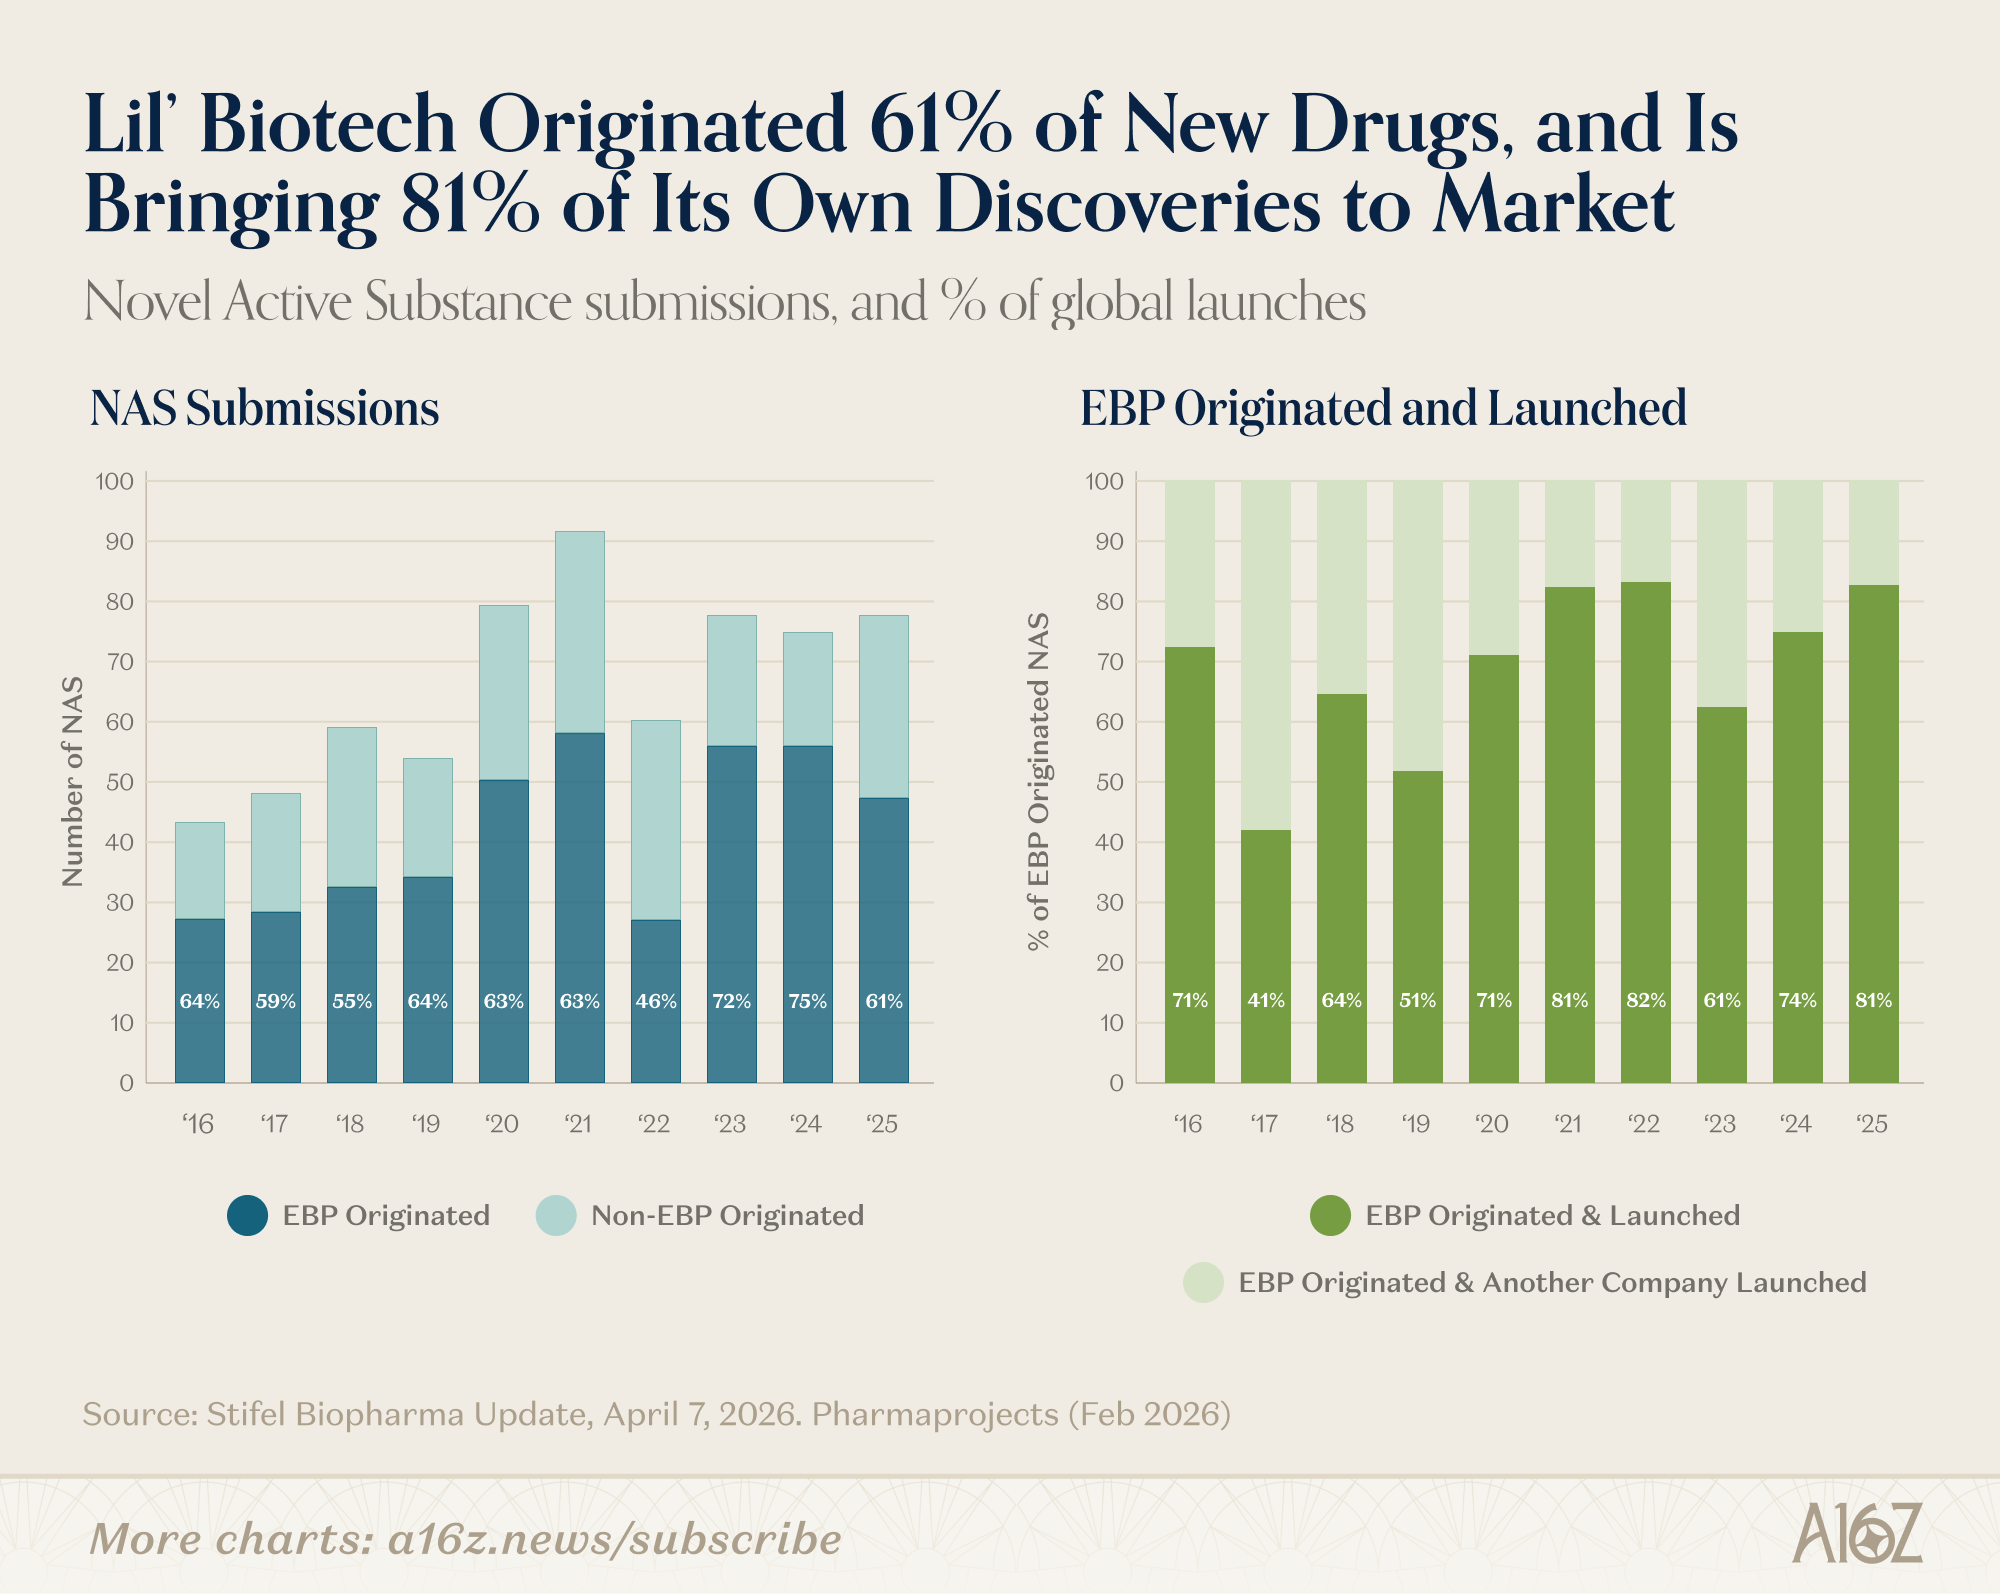
The number of NAS filed has increased by ~60%, with EBP’s responsible for at least 60% of them in every year since 2019 (except for 2022).
Not only is Lil’ Biotech originating more drugs, but they’re increasingly bringing them to market on their own, without Big Pharma’s help. In 2025 (and ‘21-’22), more than 80% of EBP originated substances were brought to market by the EBP itself. In the past, the model for emerging biotech was generally “run successful trials, sell to Big Pharma, and retire (or something).” Now, biotech is keeping the full lifecycle of the drug to itself, far more often than it ever did before.
In the bigger scheme of things, the point here is that, over the last decade, biotech companies have become much more important players in the development of new drugs. Their research is not only helping drive the increase in fresh-NAS, but they’re maturing as businesses, as well, bringing a larger share of their own discoveries to market (without relying on a Big Pharma M&A cycle to do so).
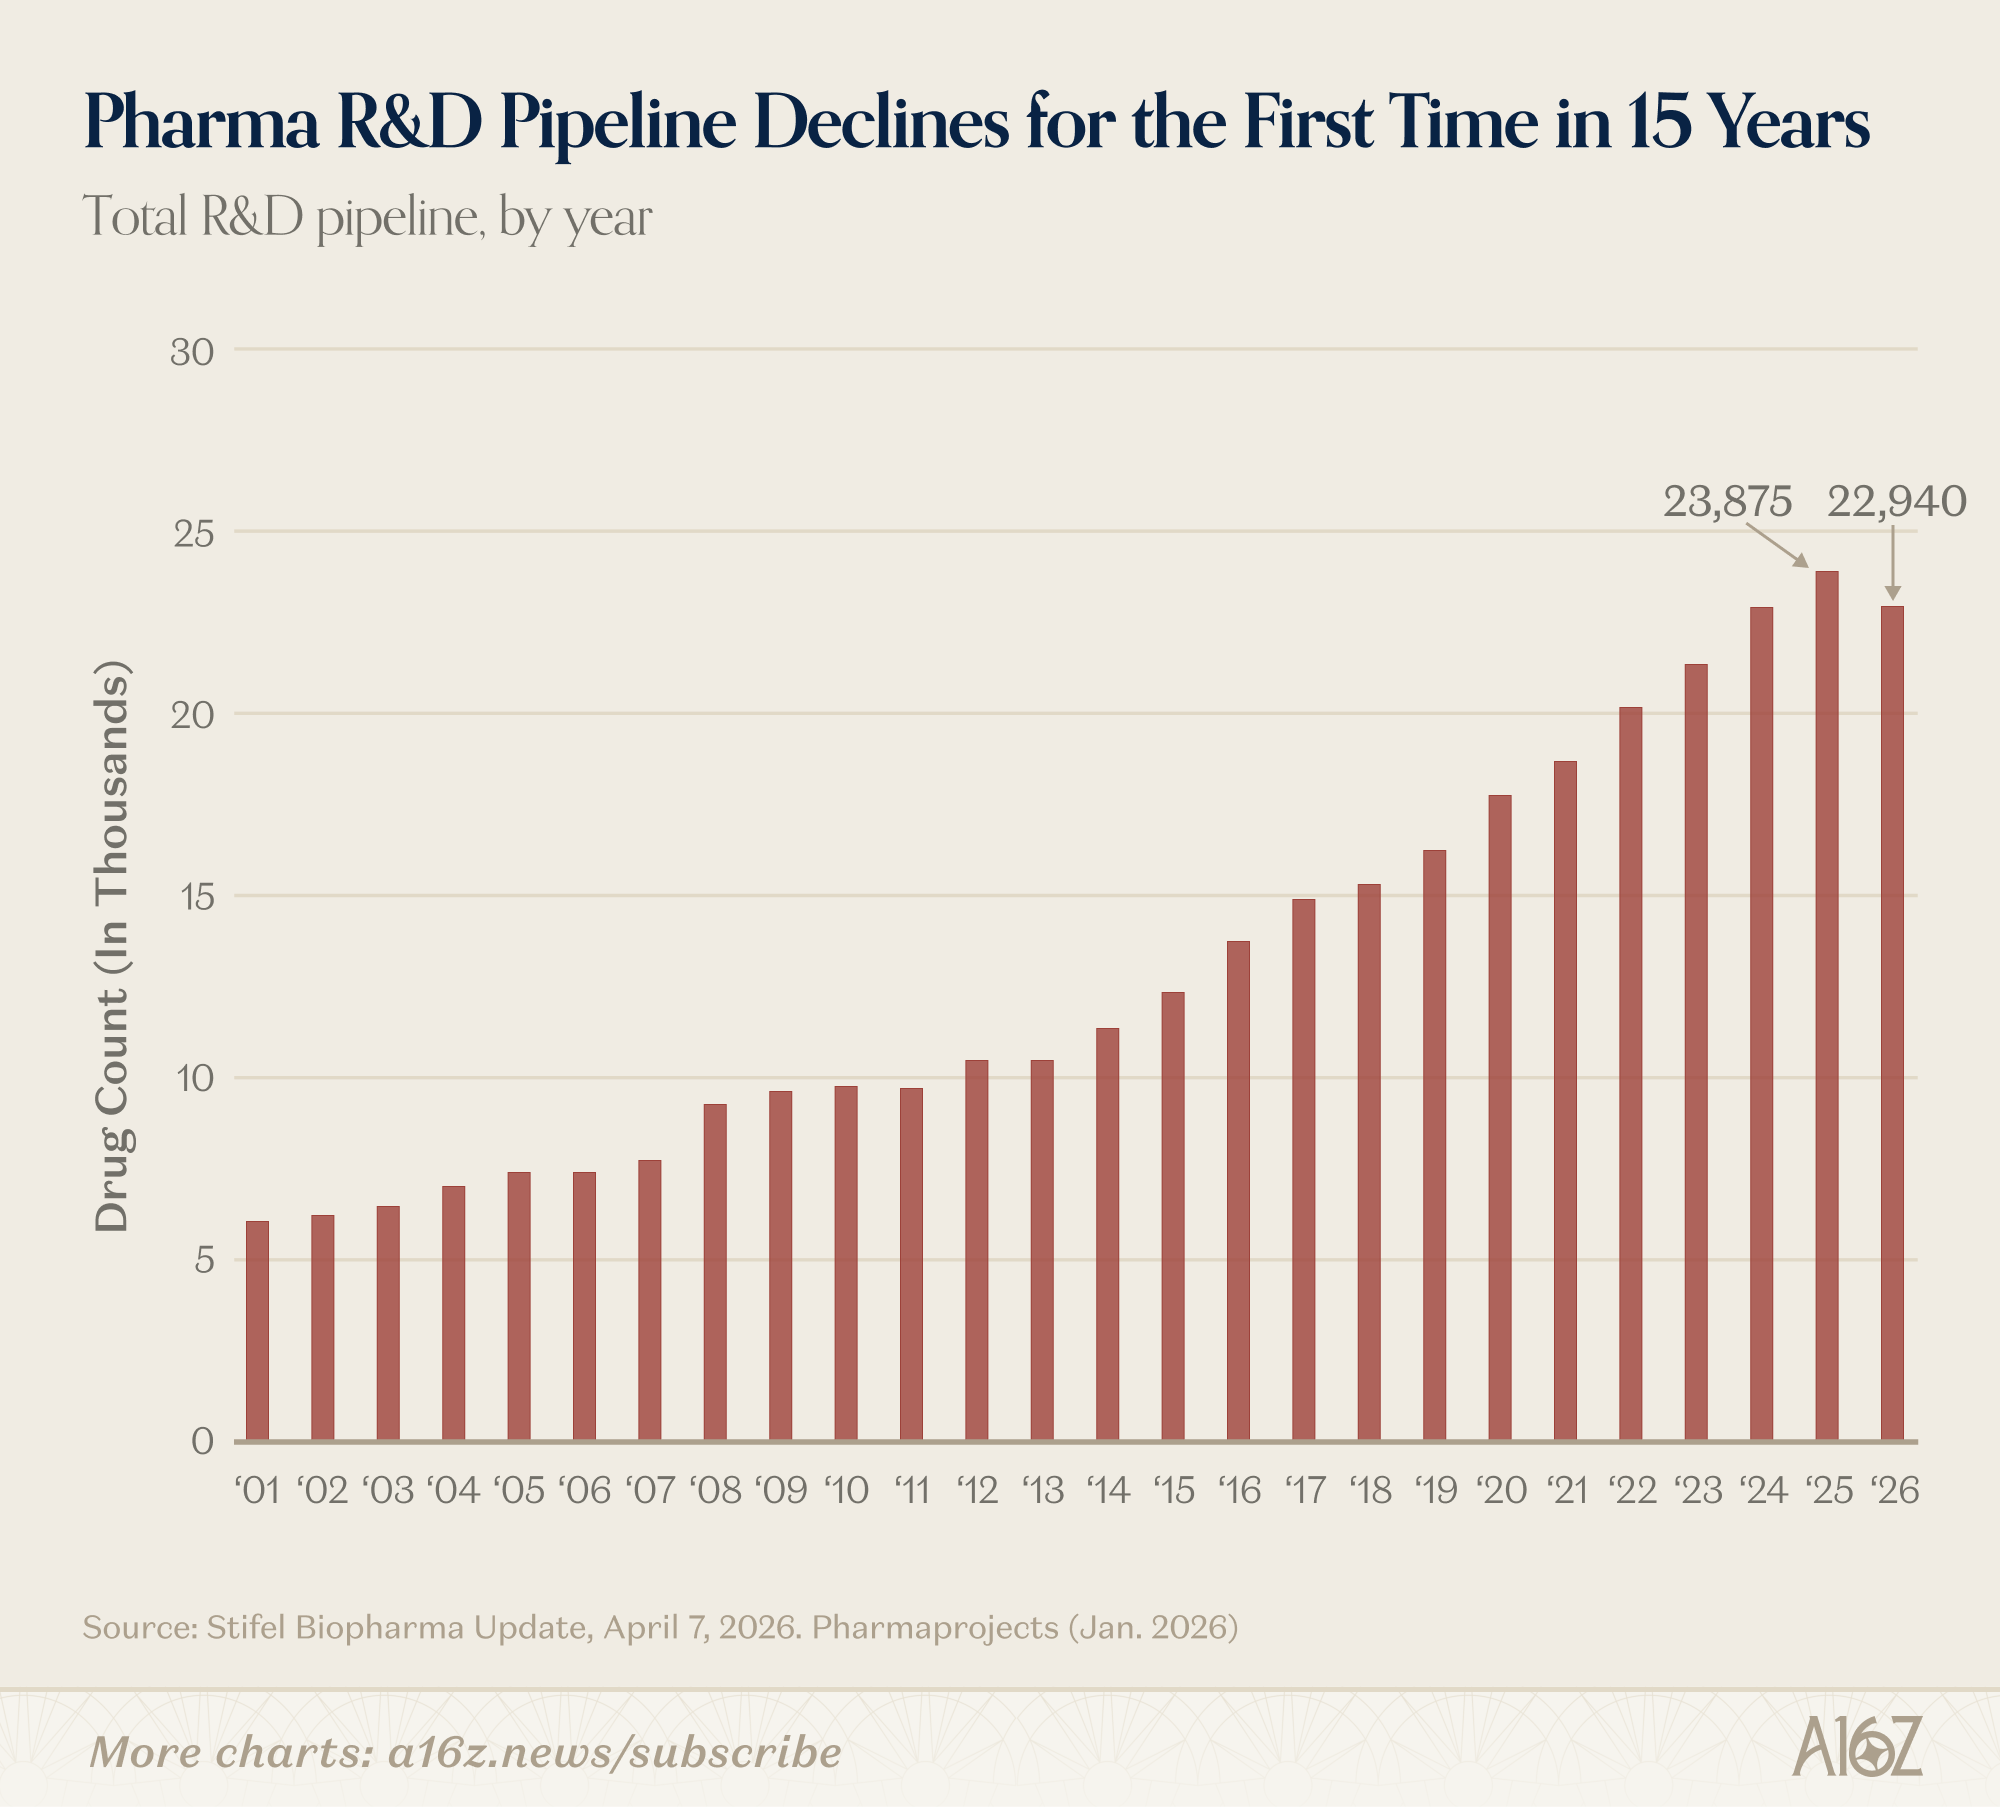
As it happens, the total industry R&D pipeline appears to have contracted for the first time since 2011, making Lil’ Biotech perhaps more important to the ecosystem than ever.
Data Centers Need More Power
We’re going to let you in on a little secret: data centers are kind of a big deal.
Yup, those boring, boxy warehouse-looking things chock full of server racks are actually super-important to making AI possible, and the sort of data centers we need now, are nothing like the data centers we’ve relied on in the past. They need a lot more power, for one thing, and a lot more cooling, for another, and that’s having all sorts of ripple effects through the industrial and construction supply chains for parts, labor, the works. I know it sounds unbelievable, but just trust us, and remember, you heard it here first.
Look at this data center rocketship:
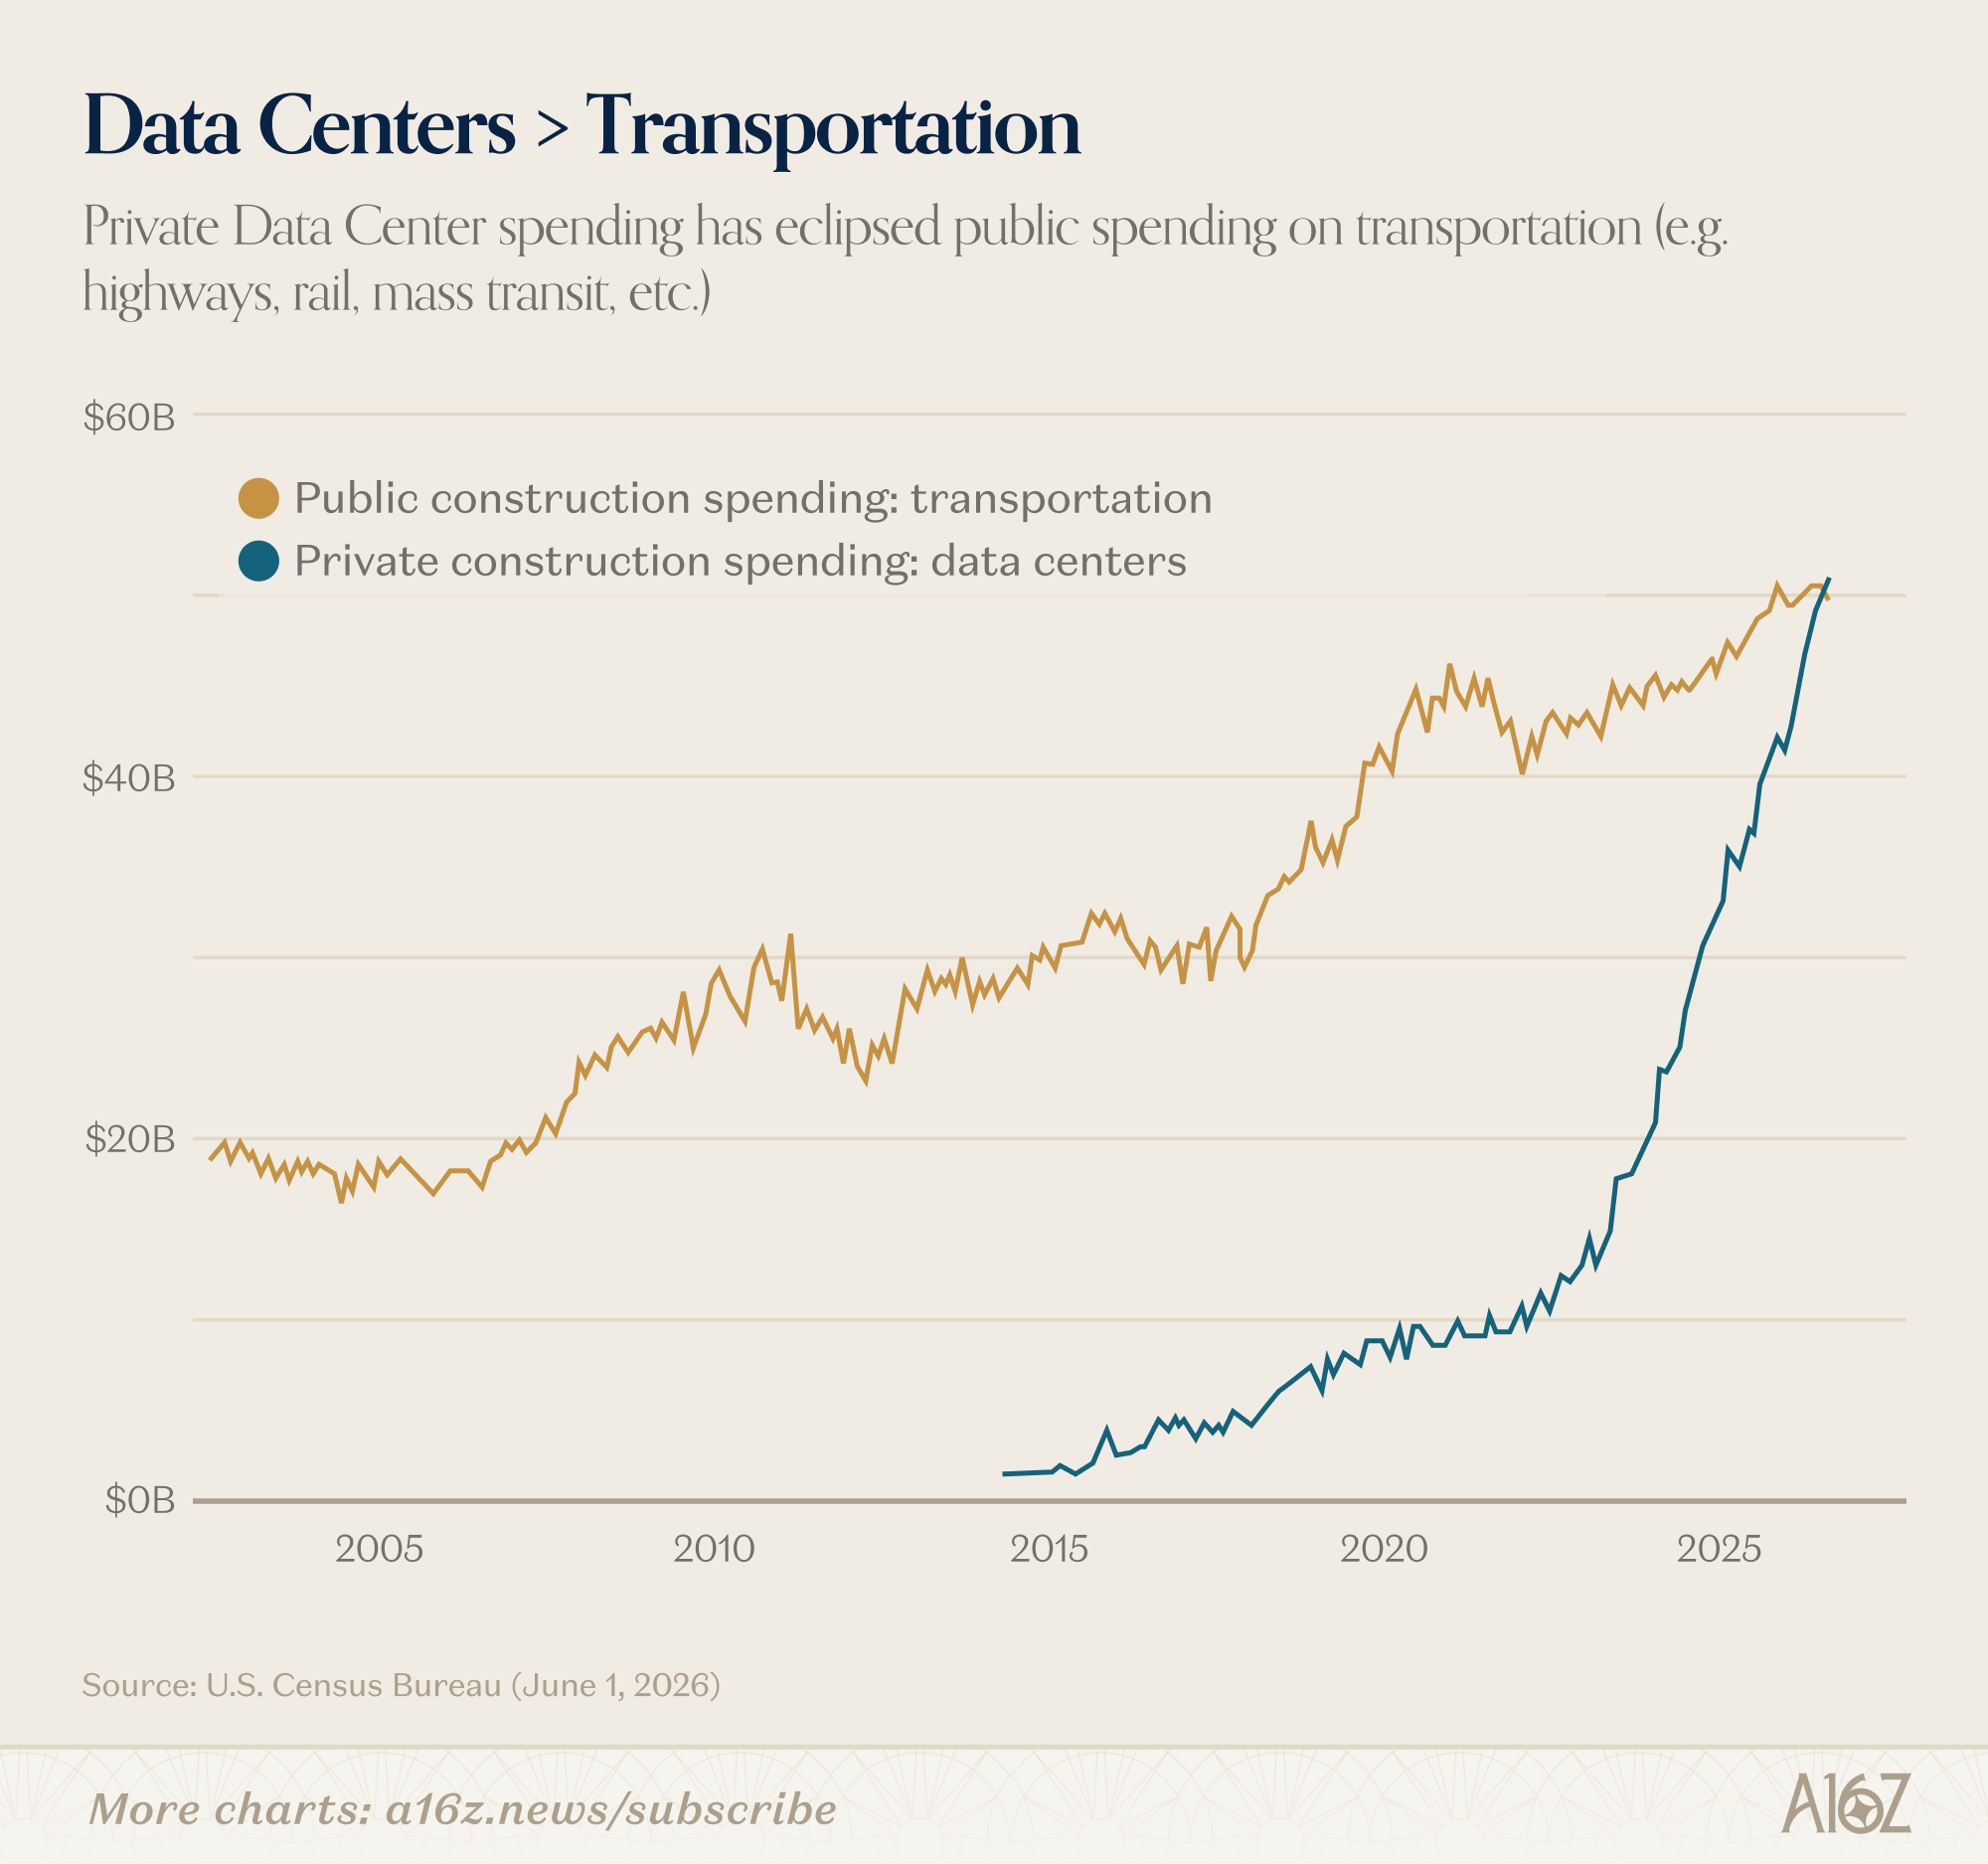
Total data center construction spending has now eclipsed general “transportation,” spending, i.e. all the roads and highways and infrastructure-related stuff.
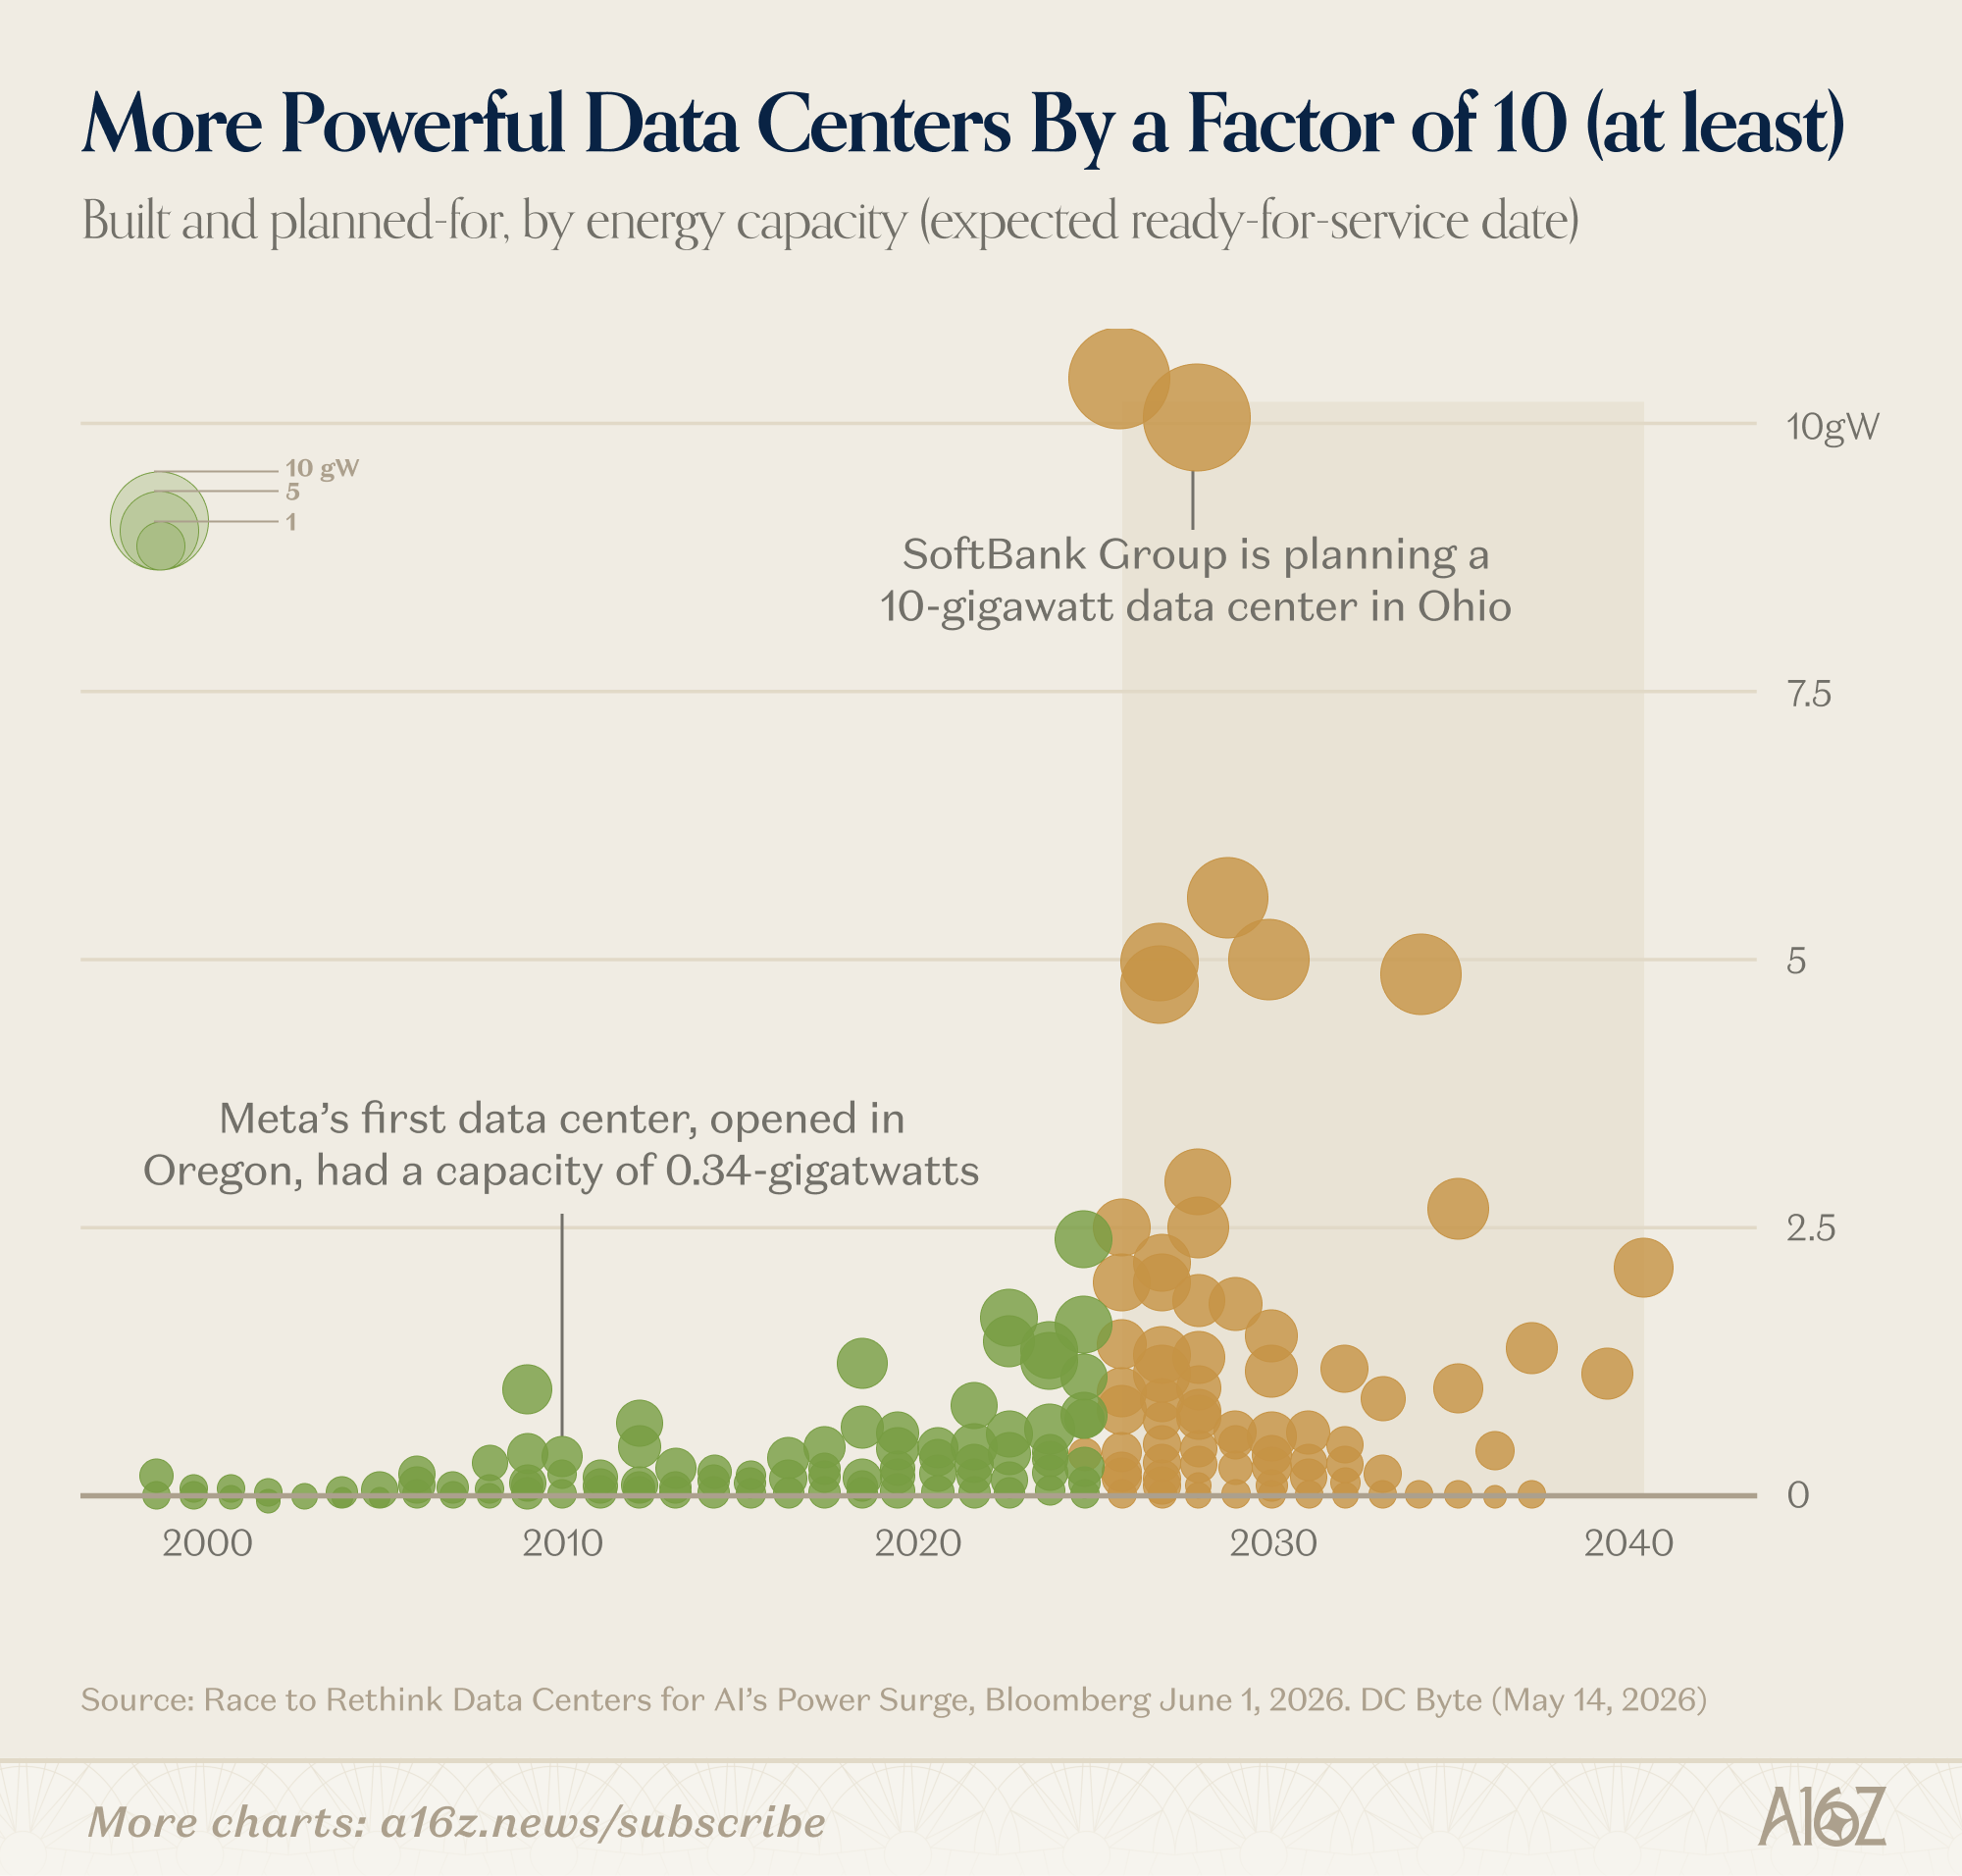
And again, this buildout is just getting started, and these new data centers—which should really be called something like “supercomputers,” because that’s both more accurate and better branding—are of a very different variety than data centers of yore:
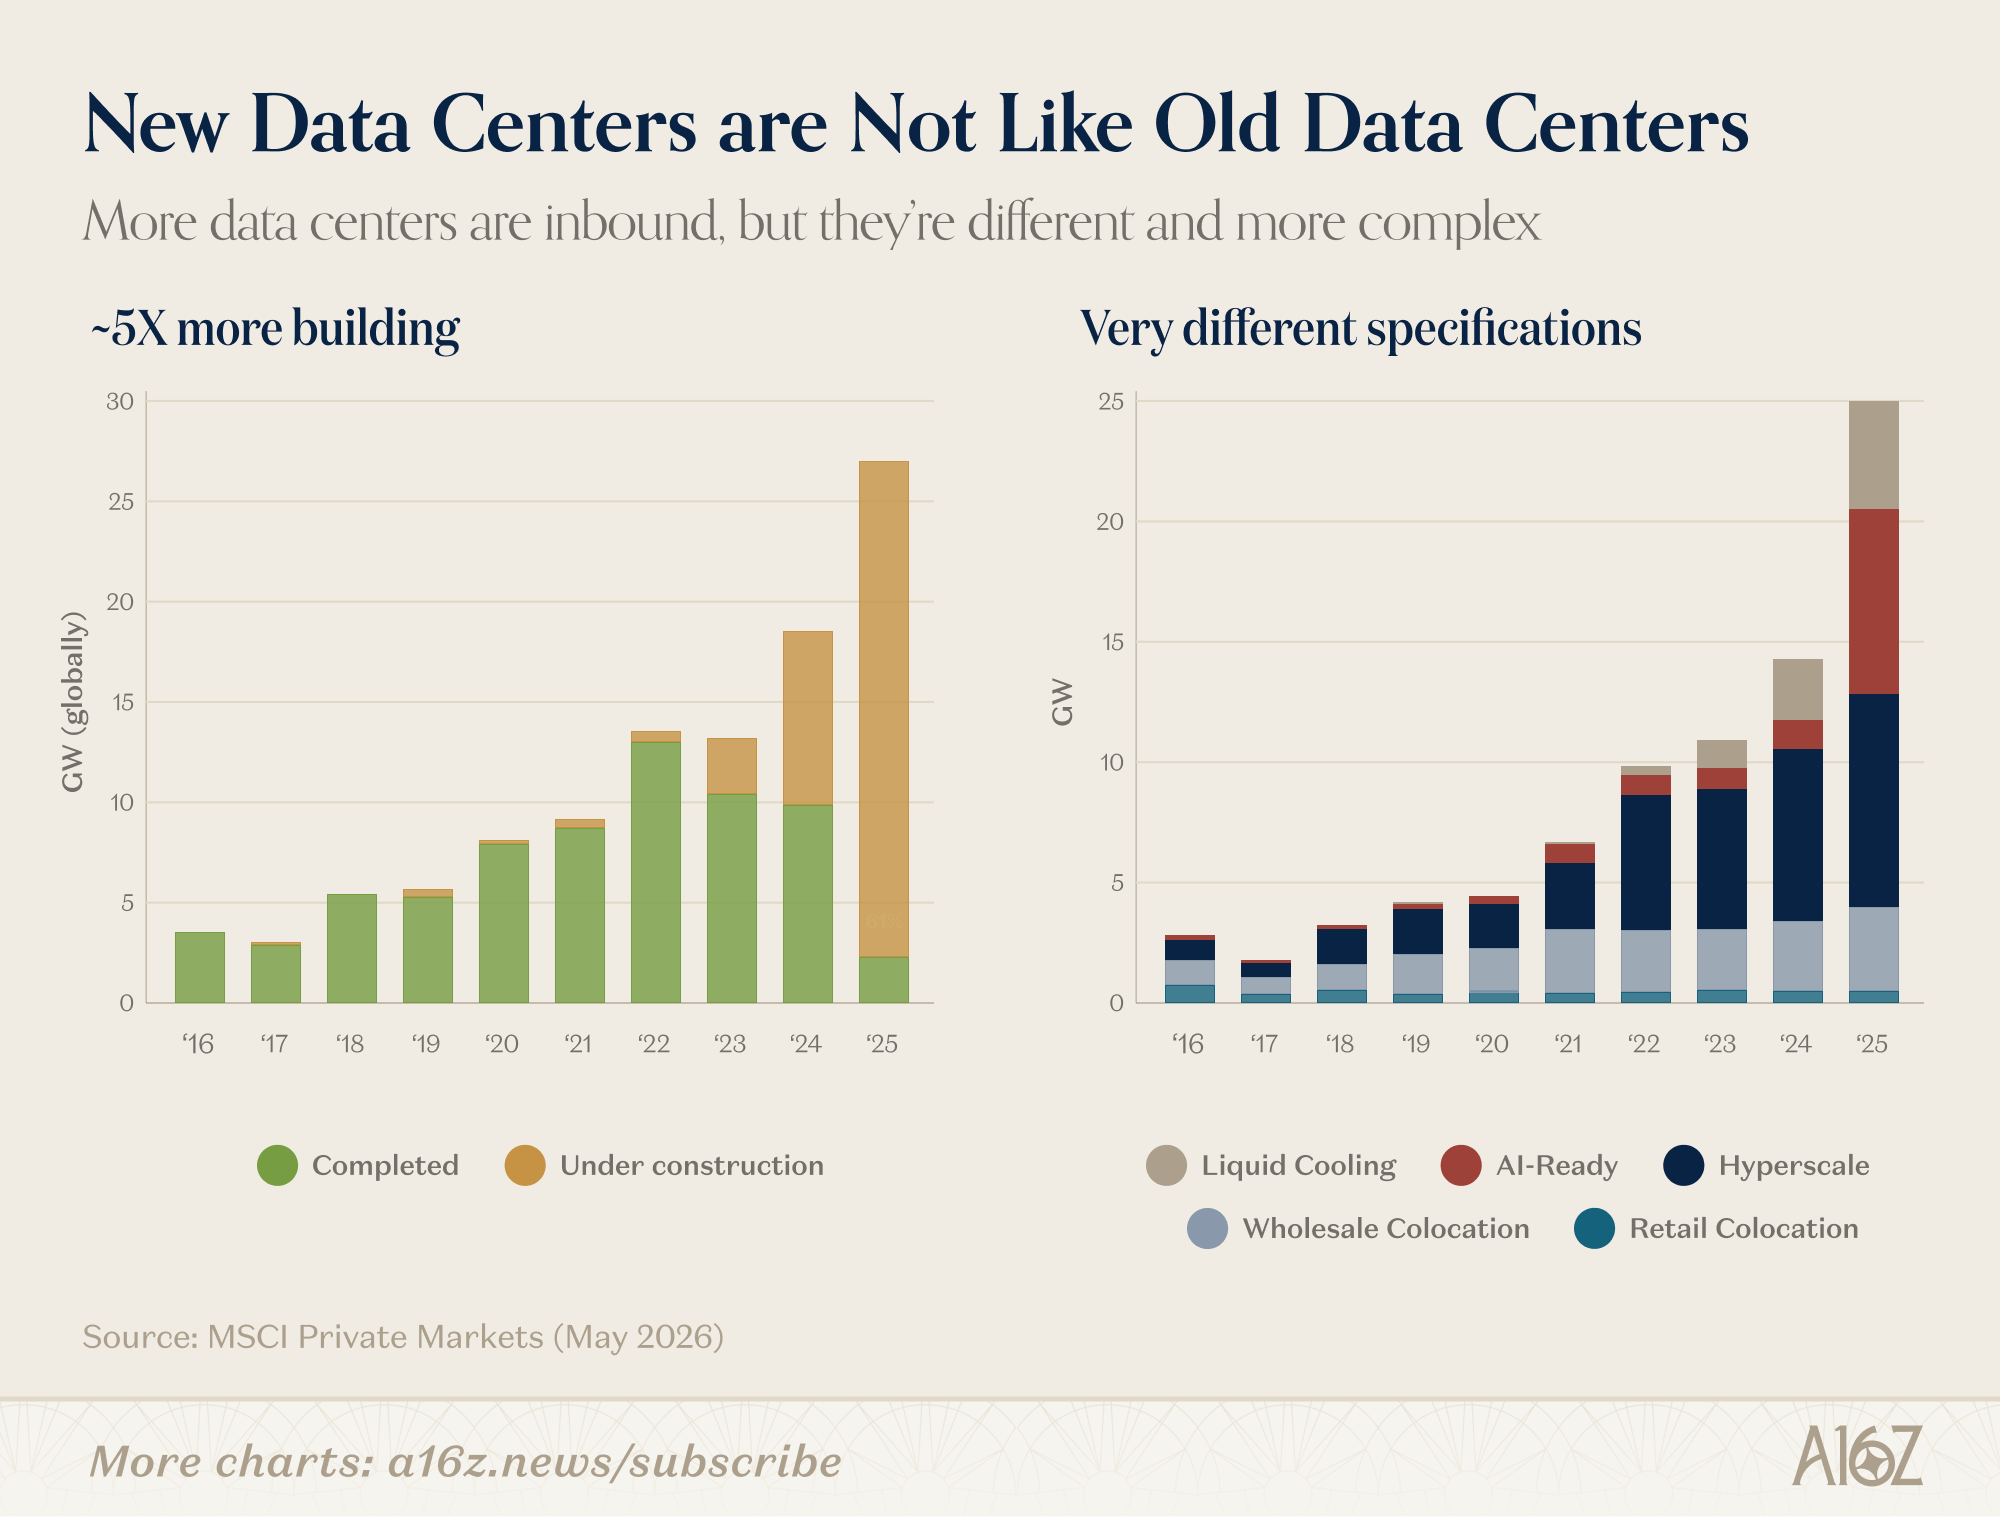
The amount of computational power that’s coming online in just a few years, dwarfs anything we’ve done in the past, either with data centers, or really any kind of industrial project.
One of the big open questions is and remains ‘where and how are we going to get all the fresh electricity to make these super-computers go?’ Grid connection timelines continue to get pushed out, the component parts (and skilled labor) are in short supply, and there are all sorts of engineering constraints around transmission, distribution, and transformation that we’ve never really had to deal with before on a similar scale and timeline.
We’re at the point now, where a single server rack may soon require roughly the same amount of power as an entire data center used to, before all this got started:
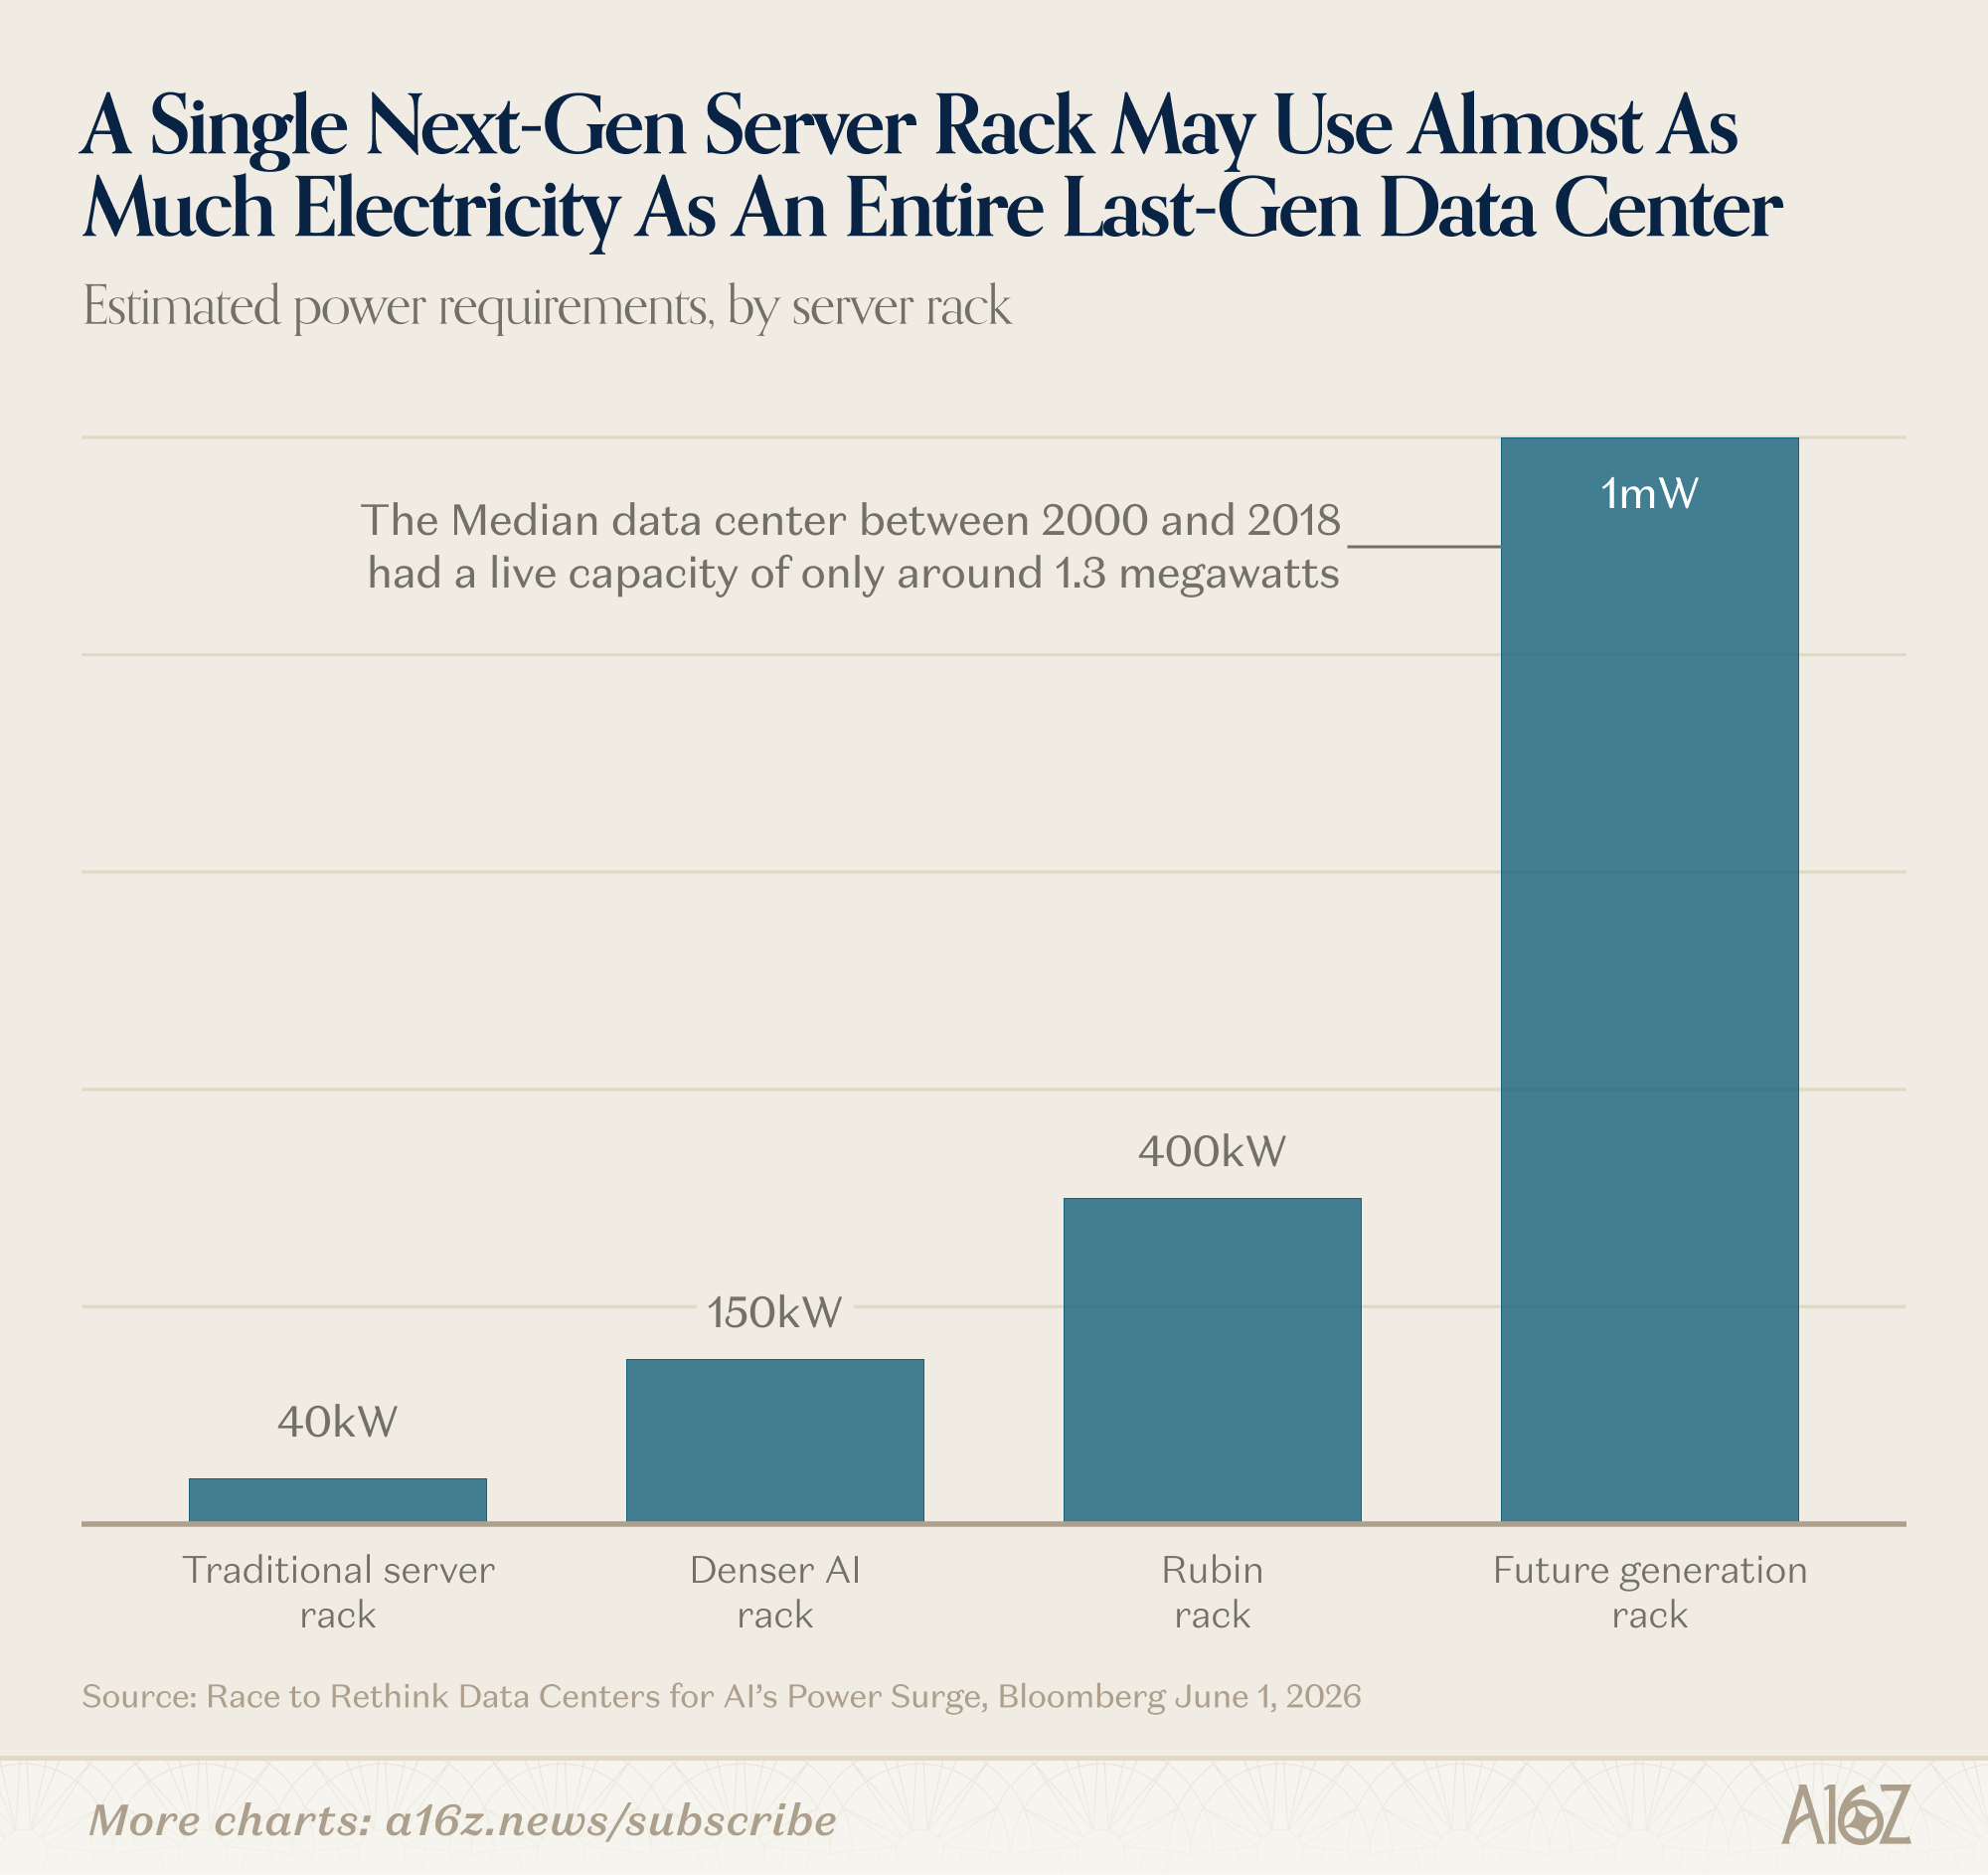
Rubin racks, Nvidia’s latest generation of GPUs, are expected to need about 7x more power than a traditional rack, and the next-gen after that may require a staggering 1MW, or 25x more than the pre-LLM server. The median data center built before 2018 used ~1.3MW, so the power requirements of a next-gen data center will be something like having a data center full of data centers.
The point being that the power requirements to drive AI forward are massive and growing. There’s already some evidence that compute is driving changes in electricity consumption:
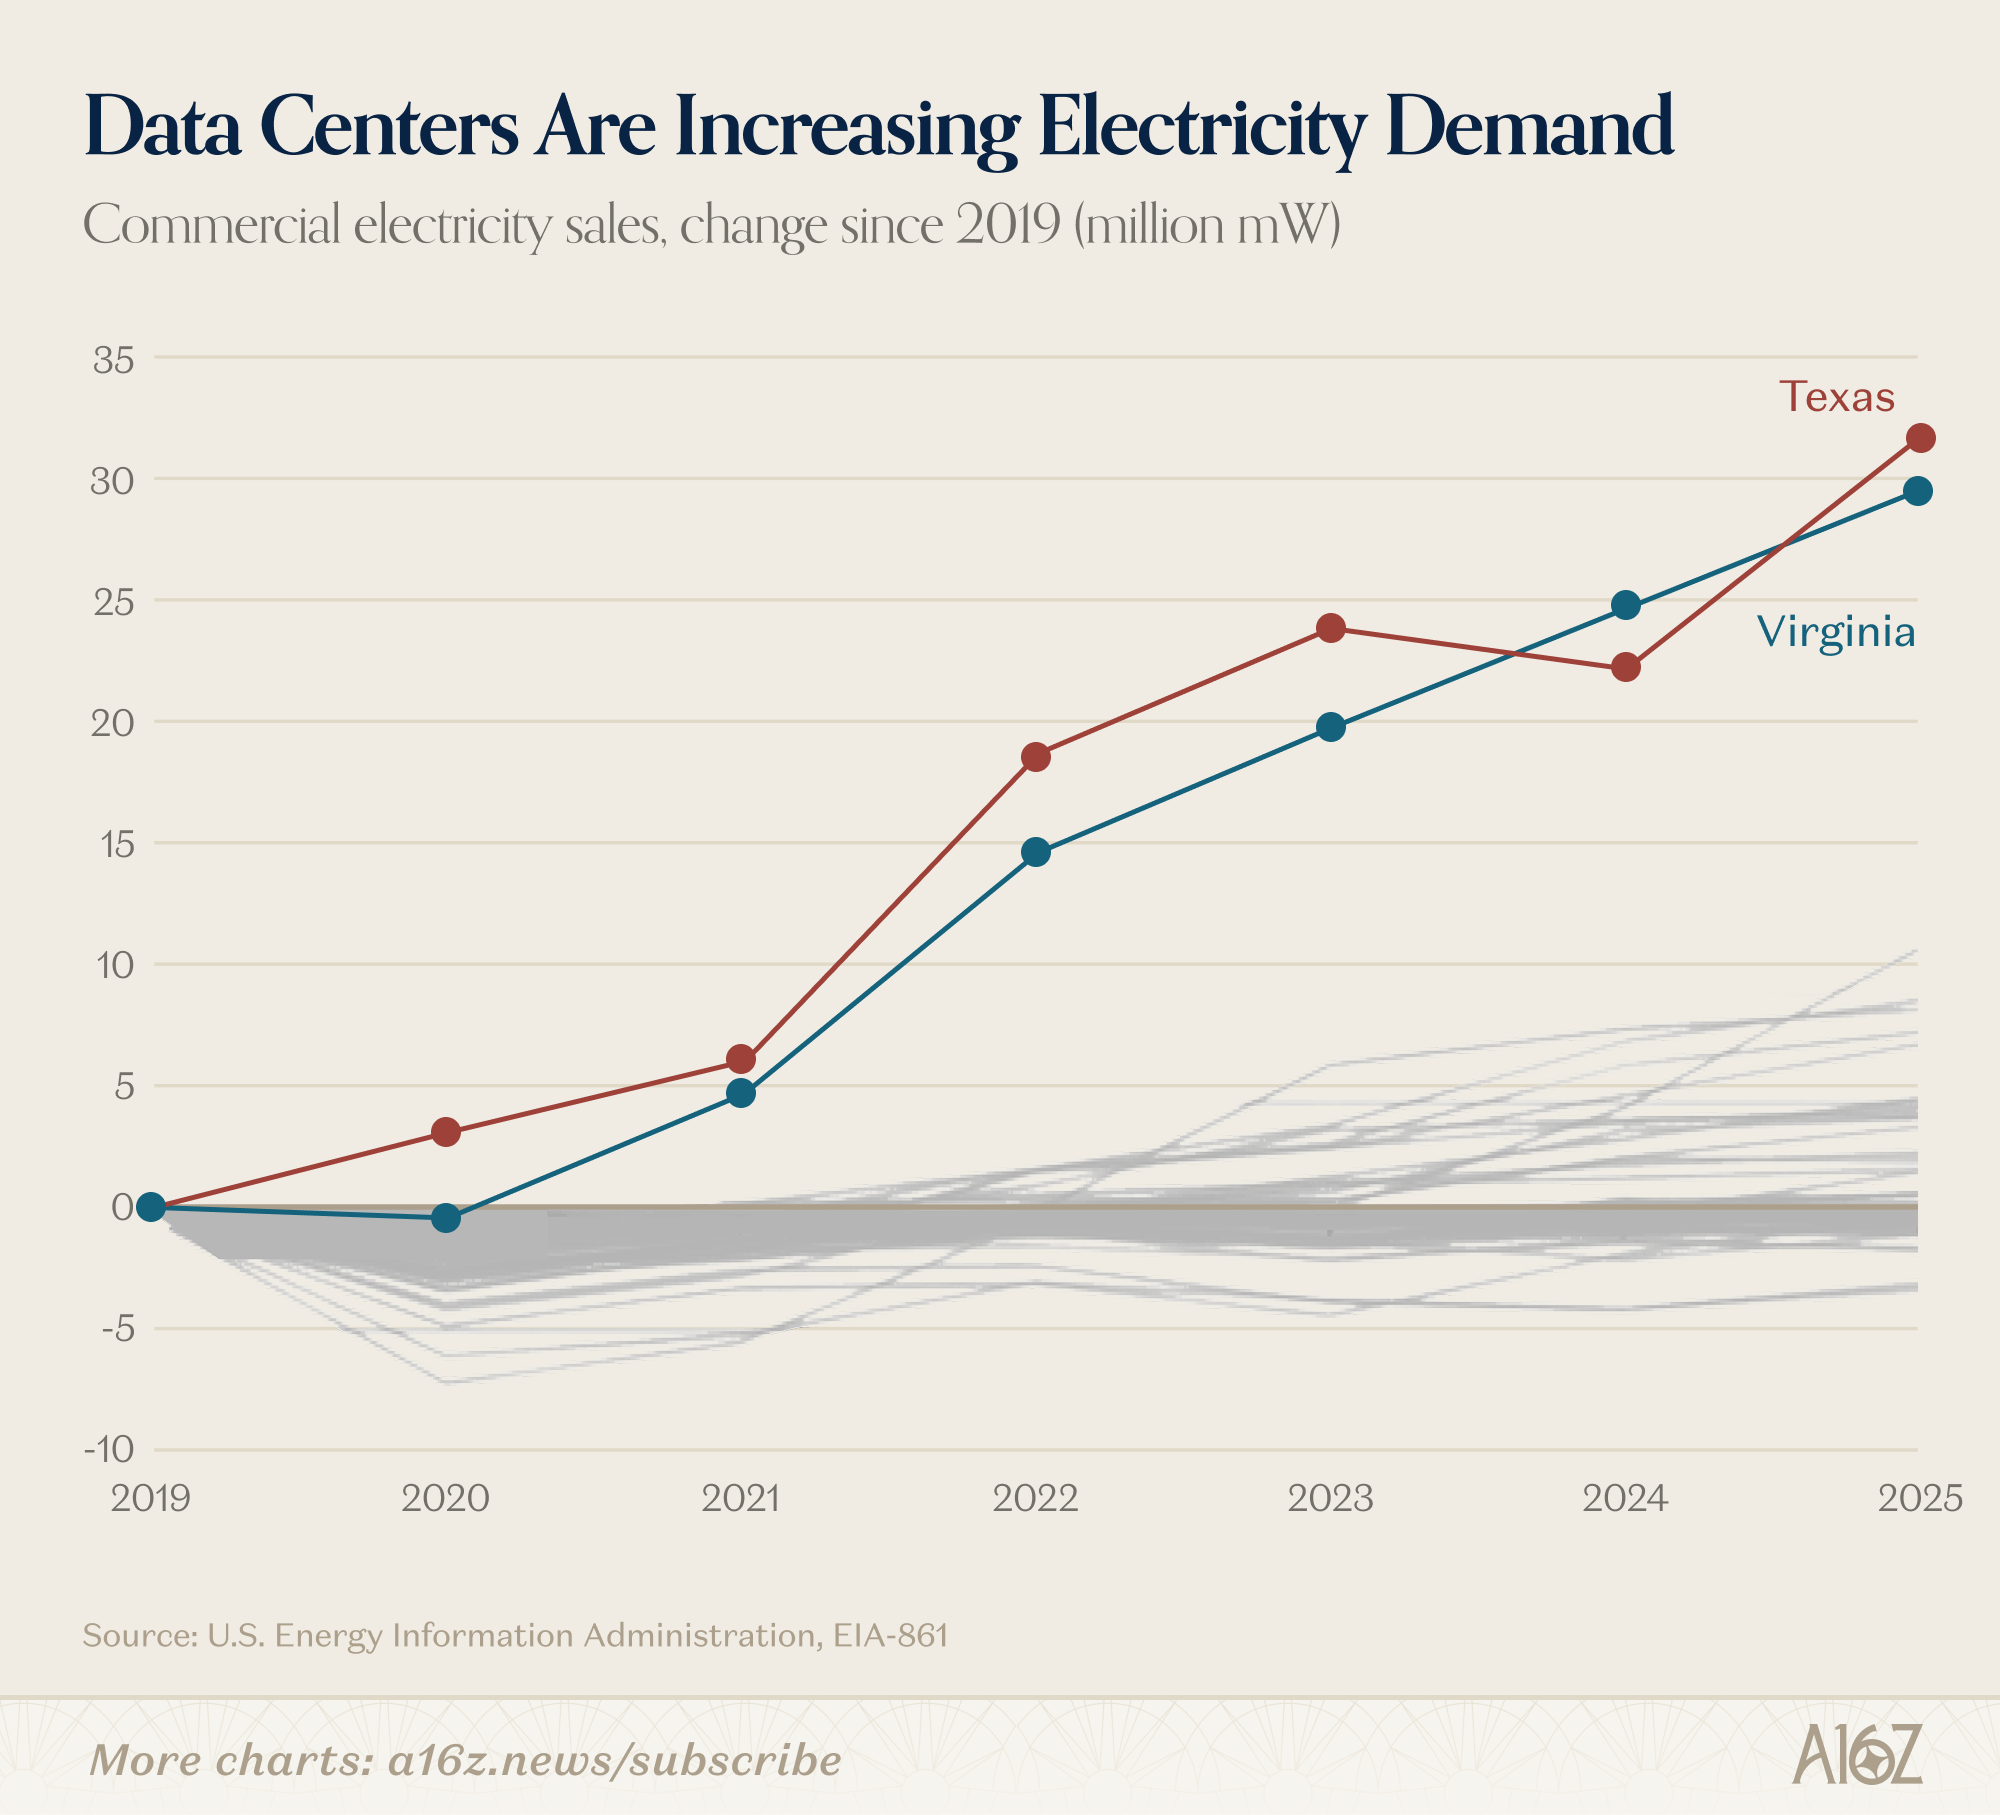
Commercial electricity sales for both Texas and Virginia have both grown substantially ahead of the field (which is also still growing) since 2020.
Virginia especially has one of the highest concentrations of data centers in the world (and is a much smaller grid, relatively), so it’s not unreasonable to make a connection between the two: more data centers, more power. Query why the progression in electricity sales appears somewhat linear, as opposed to having a more pronounced inflection ~’23 when LLMs really took off, so it’s also not unreasonable to conclude that there’s more to the story than just data centers, but the point stands: data centers are already consuming more power, and they’re going to need a lot more going forward.
How that plays out is anyone’s guess. There will, of course, be innovation and efficiency gains, there is the rise on-prem power supply, nuclear is undergoing a hoped-for revival, and there are big plans for orbital compute (i.e. solar-powered and space-cooled), as well. Most of all, necessity is as-always the necessity of invention, and part of the contextual backdrop here is that (up until very recently), electricity demand has been more or less flat for decades, so there’s every reason to expect exciting new tech, for what’s historically been a pretty sleepy industry.
Maybe we’ll get our flying cars soon enough.

This newsletter is provided for informational purposes only, and should not be relied upon as legal, business, investment, or tax advice. Furthermore, this content is not investment advice, nor is it intended for use by any investors or prospective investors in any a16z funds. This newsletter may link to other websites or contain other information obtained from third-party sources - a16z has not independently verified nor makes any representations about the current or enduring accuracy of such information. If this content includes third-party advertisements, a16z has not reviewed such advertisements and does not endorse any advertising content or related companies contained therein. Any investments or portfolio companies mentioned, referred to, or described are not representative of all investments in vehicles managed by a16z; visit https://a16z.com/investment-list/ for a full list of investments. Other important information can be found at a16z.com/disclosures. You’re receiving this newsletter since you opted in earlier; if you would like to opt out of future newsletters you may unsubscribe immediately.
And also, a 14% dip in office vacancy rate given a 30% dip in weekly office visits isn't bad!
I'd be curious to see what office space costs look like during the same time period. Given the number of high valuation companies out there - they may be willing to pay more for less space.
I love your Charts of the Week series!